
Leveraging Juniper Networks Streaming Telemetry - OpenJTS Start UP Hands-on lab
Overview
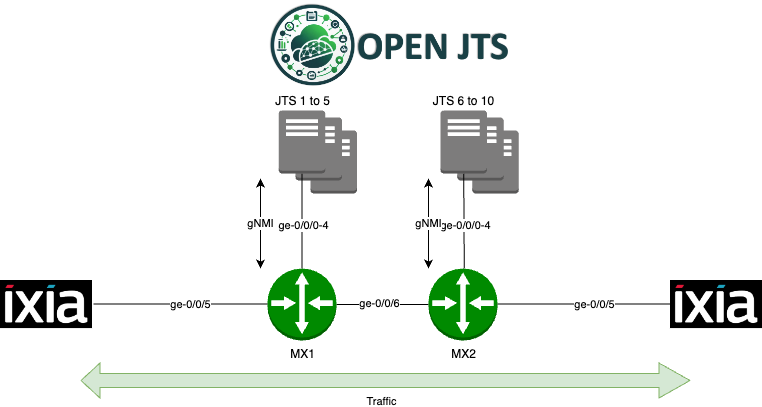
In this engaging hands-on lab session, Juniper Networks Sales Engineers will dive into the power of our Streaming Telemetry platform. Tailored for professionals working on proof-of-concept validations or lab testing, this session demonstrates how to effectively deploy and utilize the Streaming Telemetry stack. By observing key parameters in real-time, participants will see firsthand how telemetry can enhance network observability and aid in planning for production environments.
Objectives
By the end of this lab, participants will:
Understand the architecture and functionality of Juniper Platforms Streaming Telemetry.
Learn to deploy and configure telemetry services for monitoring network events.
Explore sensor paths and navigate through different telemetry streams efficiently.
Key Topics
Introduction to Juniper Networks Streaming Telemetry
Configuring and deploying telemetry sensors
Analyzing and visualizing telemetry data in real-time
Planning the implementation of telemetry in production environments
Skills and Tools
Prerequisites: Basic familiarity with network operations and Junos OS is beneficial.
Tools Used: JUNOS OS, Juniper Streaming Telemetry tools (e.g., gNMI, gNOI), telemetry visualization platforms.
Methodology
Participants will follow a step-by-step guide to set up the streaming telemetry environment on a simulated network. Through guided exercises, attendees will deploy sensors, explore different data streams, and visualize key metrics. The session includes interactive discussions for troubleshooting and best practices in setting up telemetry for production environments.
Benefits
This lab provides practical skills necessary for leveraging Juniper’s Streaming Telemetry to enhance network observability. Participants will gain confidence in deploying telemetry solutions that can significantly improve monitoring and operational efficiency. These capabilities are invaluable for sales engineers, enabling them to demonstrate the strategic value of Juniper’s telemetry offerings to potential customers.
Starting Lab
Step 1: Login to OpenJTS VM
Please use SecureCRT from your desktop to connect to the OpenJTS VM provided (details below according to user ID) and follow the next steps:-
Name |
Project |
Lab Name |
URL |
Username |
Password |
|---|---|---|---|---|---|
JTS-1 |
OpenJTS |
Openjts_lab1.1 |
user1 |
Juniper!1 |
|
JTS-2 |
OpenJTS |
Openjts_lab1.2 |
user2 |
Juniper!1 |
|
JTS-3 |
OpenJTS |
Openjts_lab1.3 |
user3 |
Juniper!1 |
|
JTS-4 |
OpenJTS |
Openjts_lab1.4 |
user4 |
Juniper!1 |
|
JTS-5 |
OpenJTS |
Openjts_lab1.5 |
user5 |
Juniper!1 |
|
JTS-6 |
OpenJTS |
Openjts_lab1.6 |
user6 |
Juniper!1 |
Step 2: Download and install OpenJTS stack
Downloading and installing the OpenJTS stack is straightforward. Few commands are needed if you keep default parameters, such as using default ports and clear-text gPRC/gNMI sessions. First, from your OpenJTS VM, once connected to the Linux VM (labuser/Juniper!1) create a dedicated JTS directory under /opt:
sudo su
>> fill in the password: Juniper!1

mkdir /opt/JTS

cd /opt/JTS
Then, download/clone the OpenJTS repository – Do not forget the trailing “dot”.
git clone https://github.com/door7302/openjts.git .
Step 3: Build OpenJTS and start the stack
The first time you launch the OpenJTS stack, each container will be fetched either from DockerHub or GitHub and will be compiled. This could take a few minutes. Be patient. As mentioned, only the first time will request more time to boot up the stack - further start will take only few seconds.
From your OpenJTS VM, move first in ./compose directory, compile the stack (only the first time) and launch the stack:
cd /opt/JTS/compose

docker compose build --no-cache

and then

docker compose up -d
At the end of the compilation process, you should see all the containers up and running:
 ✔ Network compose_default  Created                                                                                                                      0.2s
 ✔ Container jtso           Started                                                                                                                      0.6s
 ✔ Container influxdb       Started                                                                                                                      0.5s
 ✔ Container kapacitor      Started                                                                                                                      1.6s
 ✔ Container grafana        Started                                                                                                                      1.6s
 ✔ Container telegraf_vmx   Started                                                                                                                      1.3s
 ✔ Container telegraf_ptx   Started                                                                                                                      1.7s
 ✔ Container telegraf_acx   Started                                                                                                                      1.1s
 ✔ Container telegraf_mx    Started
Step 4: Initial MX configuration
Connect to the MX attached to your OpenJTS VM and apply this initial configuration. Let’s acccess to the jump server:
http://66.129.235.205:38063/guacamole/#/
From the above link:
You need to select VMX1 in case you use OpenJTS VM 1, 2 or 3
You need to select VMX2 in case you use OpenJTS VM 4, 5 or 6
The configuration you have to add:
Add a jts user (pwd: grpc123)
Enable netconf server
Enable gRPC server (clear text) that listens to tcp port 9339
edit private

set system login user jts class read-only
set system login user jts authentication plain-text-password
  New password: grpc123
  Retype new password: grpc123
set system services netconf ssh
set system services extension-service request-response grpc clear-text port 9339
set system services extension-service request-response grpc max-connections 30

commit and-quit
Step 5: Initial OpenJTS configuration
Once your OpenJTS stack is up and running, you can access its Web UI from the below table: Refer below table for Relevant user IDs and corresponding URLs
To access to the OpenJTS GUI - from Guacamole page:
Click on Helper VM
Open a Web Browser and create a new tab and finally enter the following URL to access to your OpenJTS:
User Number |
GUI Address |
|---|---|
1 (JTS1) |
http://100.123.42.1:80 |
2 (JTS2) |
http://100.123.42.2:80 |
3 (JTS3) |
http://100.123.42.3:80 |
4 (JTS4) |
http://100.123.42.4:80 |
5 (JTS5) |
http://100.123.42.5:80 |
6 (JTS6) |
http://100.123.42.6:80 |
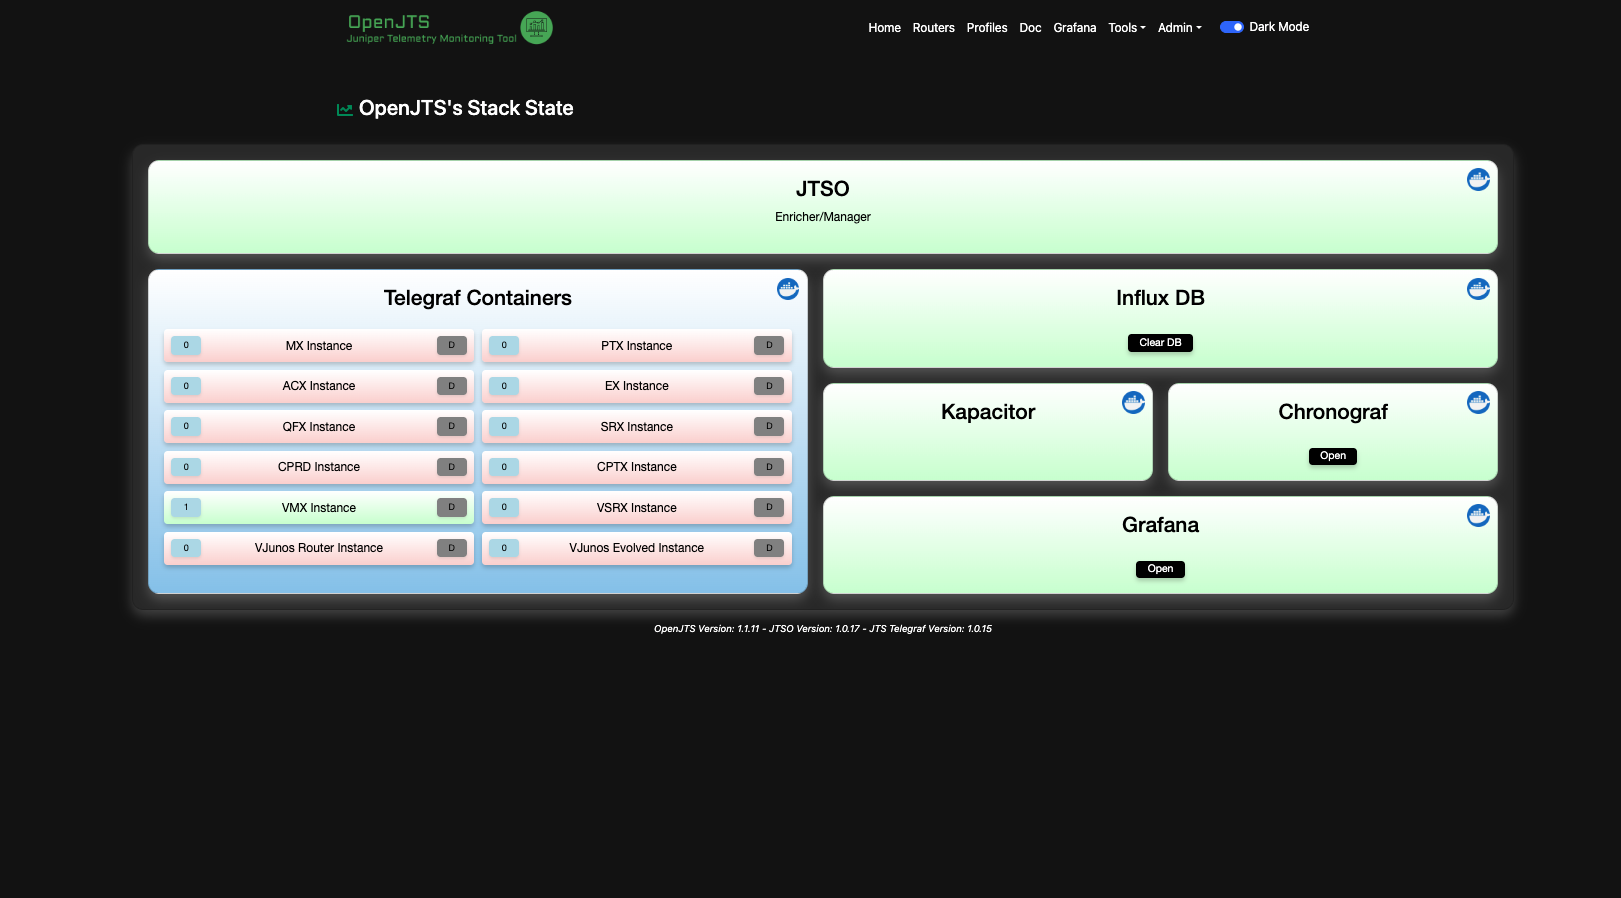
You should see the following web page, which gives you each container’s status. Unsed containers are automatically shutdown by the JTSO (JTS Orchestrator).
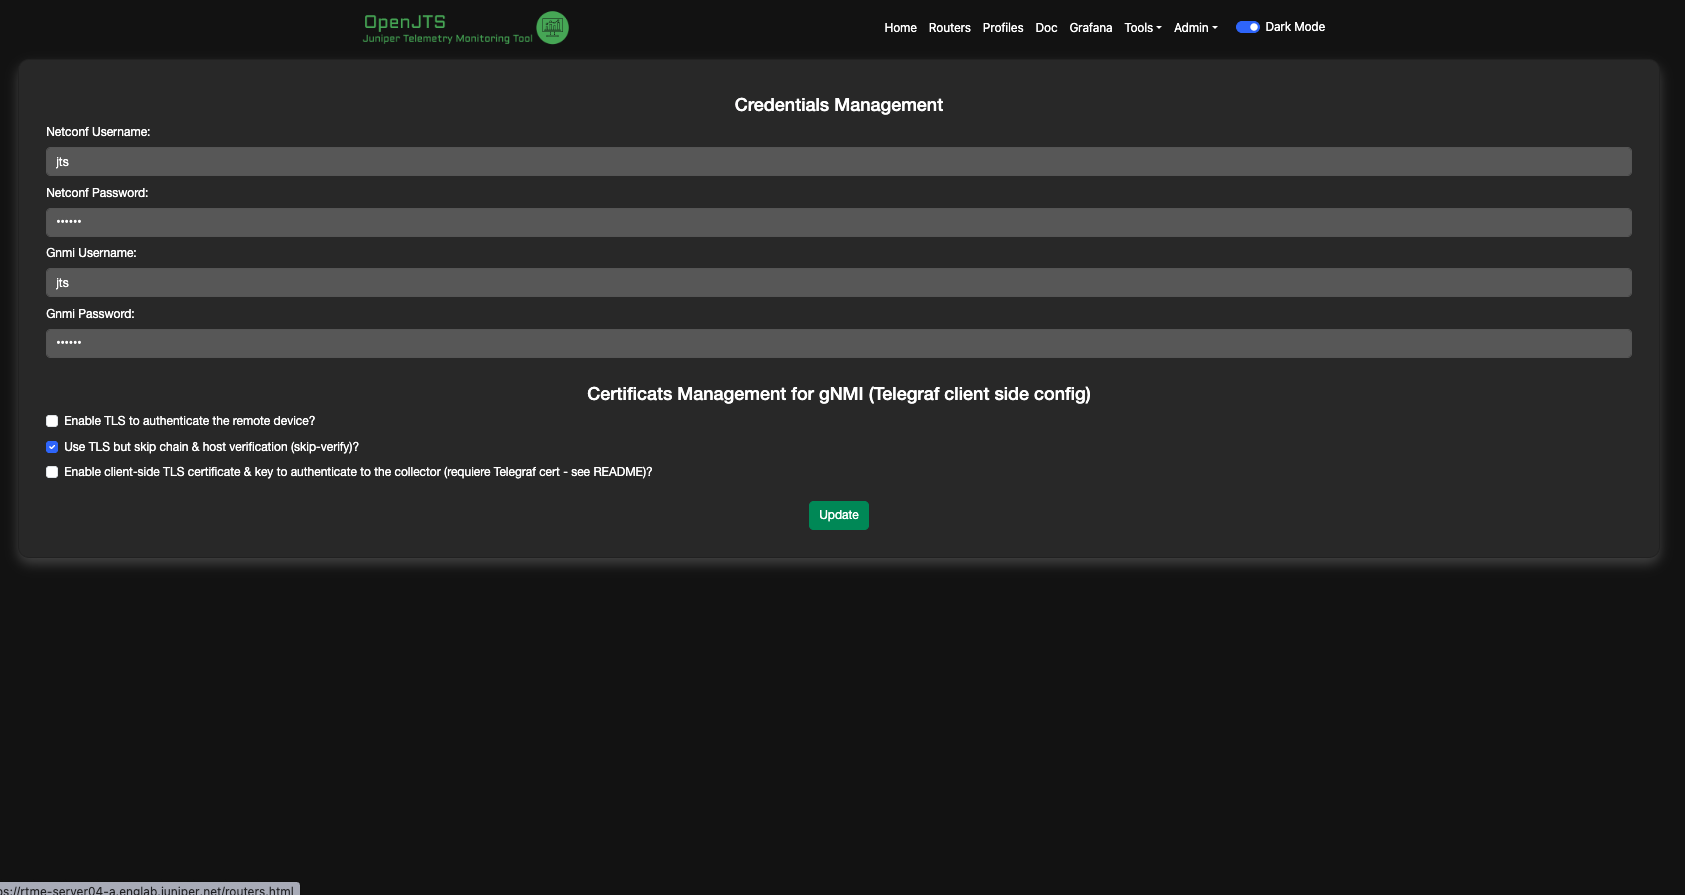
**Fill in the credentials
Go on to the “Admin -> Credentials” page, and for both Netconf and gRPC credentials fill in the Username=jts and the Paswword=grpc123 Then apply the changes (button “Update”)
Add your MX router in your inventory
Go on to the “Routers” page, and depending on which MX router is connected to your OpenJTS VM, add a short name + the IP address of your MX.
User Number |
MX Name |
MX IP Address |
|---|---|---|
1 (JTS1) |
MX-1 |
10.0.1.1 |
2 (JTS2) |
MX-1 |
10.0.2.1 |
3 (JTS3) |
MX-1 |
10.0.3.1 |
4 (JTS4) |
MX-2 |
10.0.4.1 |
5 (JTS5) |
MX-2 |
10.0.5.1 |
6 (JTS6) |
MX-2 |
10.0.6.1 |
Once the “Add router” button is pressed, automatically, a Netconf session will be established between OpenJTS and the remote router, and some facts, such as the router’s model, version, and family, will be gathered.
Test gNMI connectivity
The simplest way to test the gNMI connectivity between your OpenJTS VM and your router is to use the embedded “Browser” tool. This tool is usually used to troubleshoot a sensor path or build a new JTS profile.
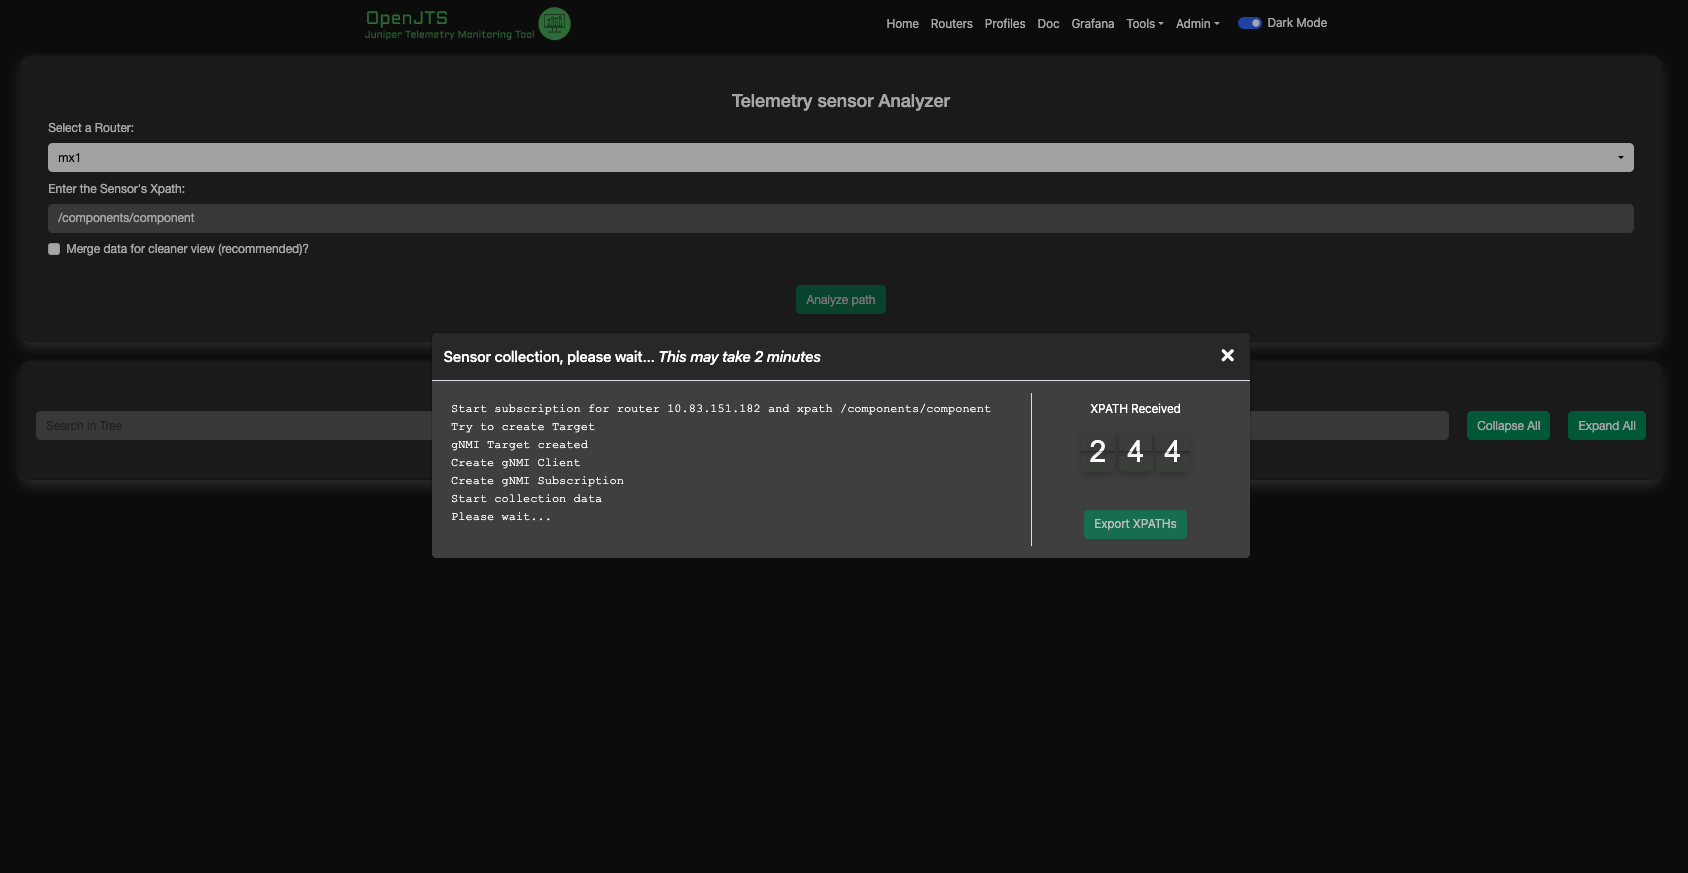
Let’s try, go on to the “Tools > gNMI Browser” page, select you MX in the list and try to browse the well-known OpenConfig “platform” sensor path starting from: /components/component
Unselect the “Merge…” option to have the full sensor path view.
The data collection takes around 1 to 2 minutes. You can follow the paths extracted in real-time.
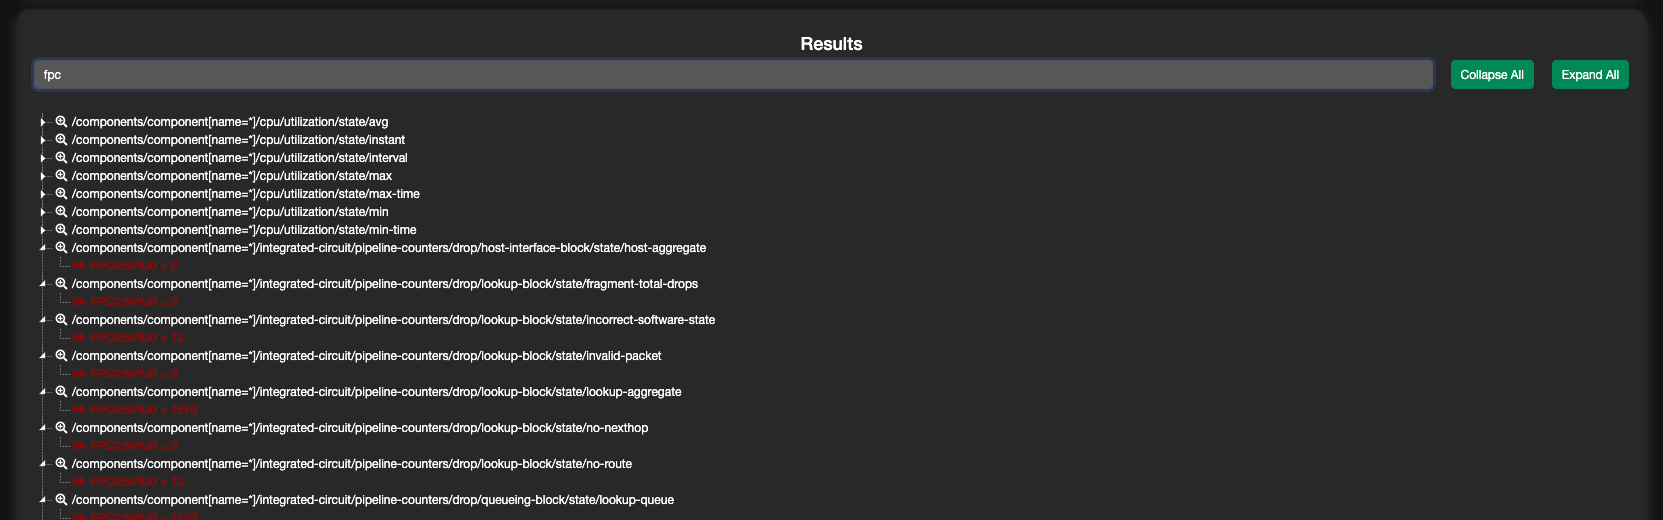
Once the data collection is finished, you can navigate into the results via a Tree View representation. You can also search for a given “string,” such as “fpc,” in the example below. All the Keys and Values matching the string will be highlighted.
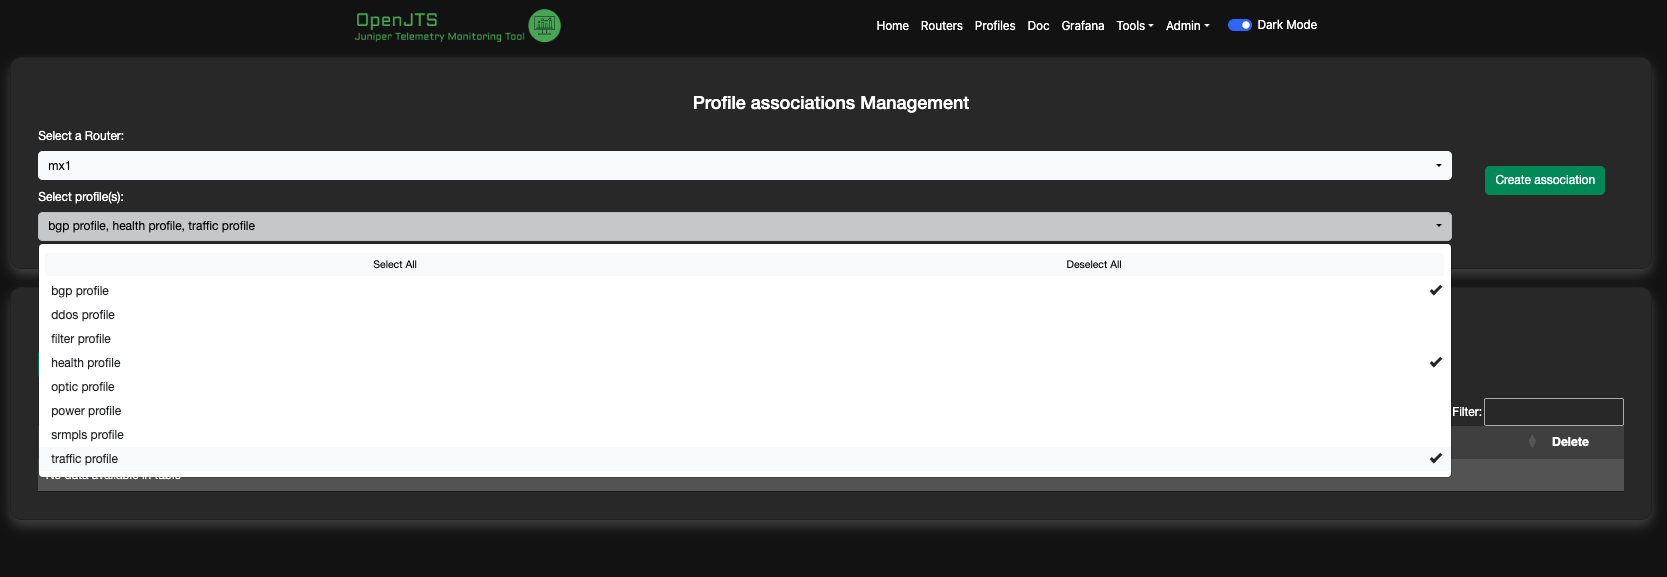
Profile(s) assignement
It’s time to start collecting some Telemetry sensors. Go to the “Profiles” page and select your MX router in the list. Then, select three profiles: BGP, Traffic, and Health profiles. Finally, press the “Create Association” button.
The OpenJTS stack is automatically fully reconfigured, data collection starts, and KPIs are saved in the database.
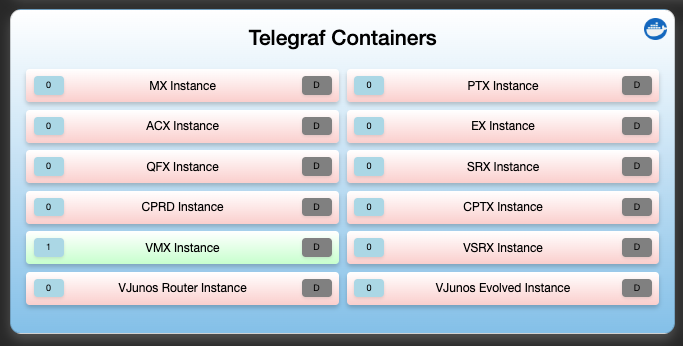
You can switch to the “Home” page to see if the “VMX Telegraf” container has been started.
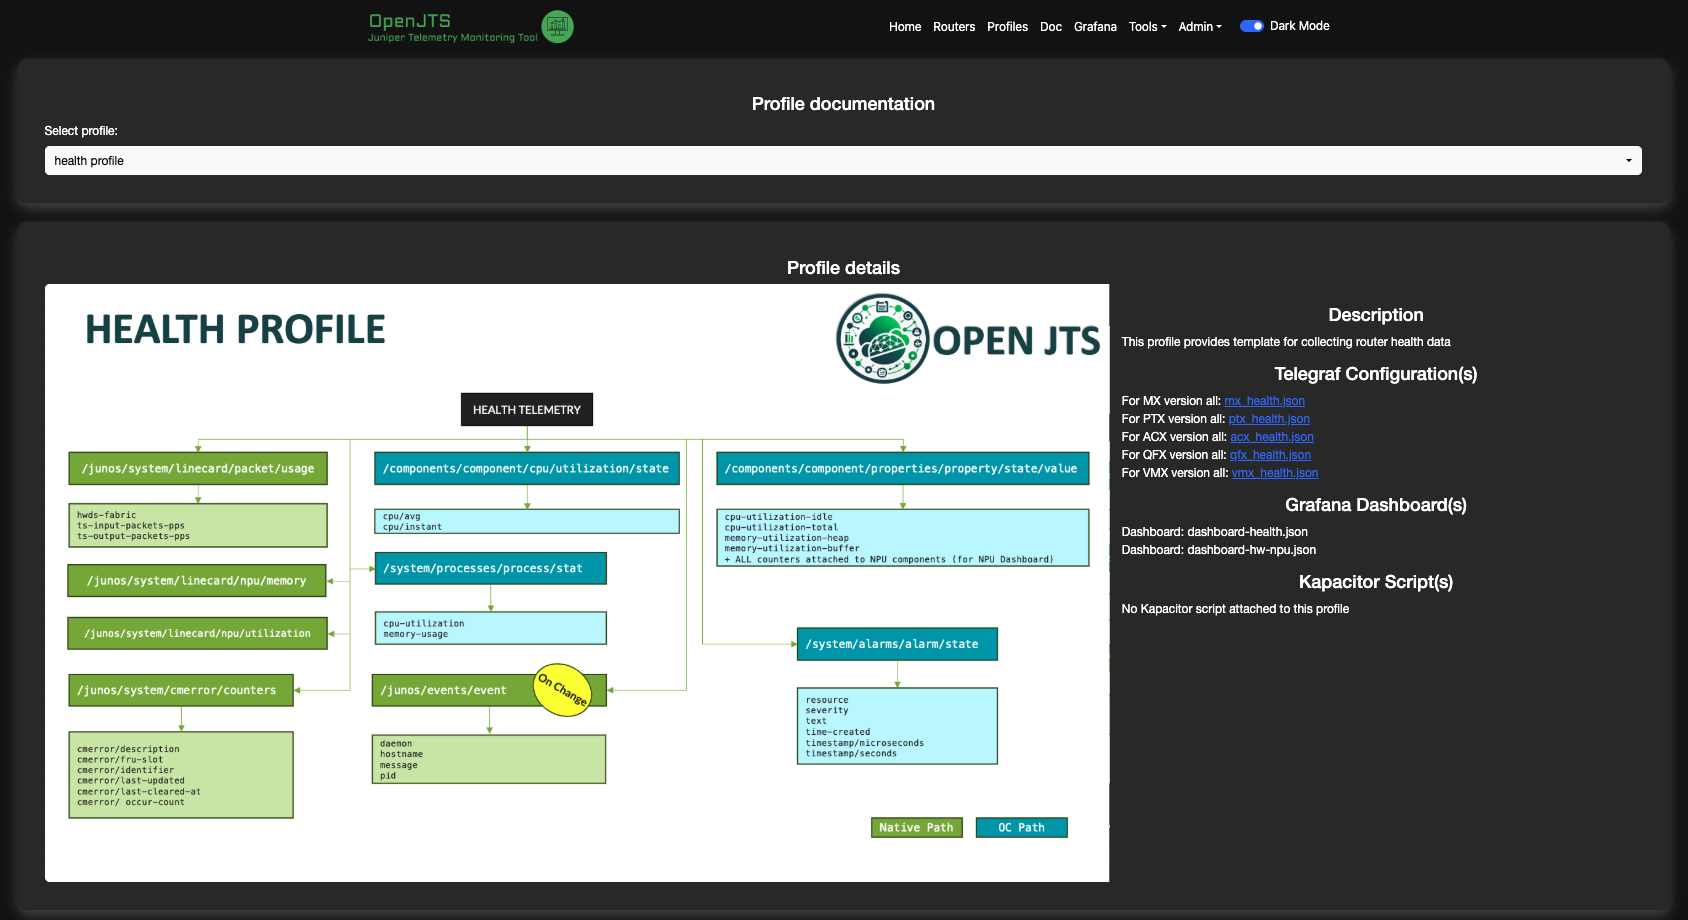
Profile(s) Documentation
Before visualizing data using pre-included Dashboards, let’s examine the Documentation menu. Go to the “Doc” page and select one profile in the list. For instance, select the Health profile. This menu helps you determine which sensor paths have been subscribed and which specific counters. A color indicates the type of DataModel: Native vs. OpenConfig.
Visualize data
It’s time to switch to Grafana. HTTP to OpenJTS
You can select one of the available Dashboards associated with the profiles you assigned to your router. For the “Health” profile, prefer to use the dedicated “VMX ROUTER Health” profile. Note: VMX does not support all the Telemetry paths - some data may be missing.
To access to the OpenJTS Grafana - from Guacamole page:
Click on Helper VM
Open a Web Browser and create a new tab and finally enter the following URL to access to your OpenJTS:
User Number |
GUI Address |
|---|---|
1 (JTS1) |
http://100.123.42.1:8080 |
2 (JTS2) |
http://100.123.42.2:8080 |
3 (JTS3) |
http://100.123.42.3:8080 |
4 (JTS4) |
http://100.123.42.4:8080 |
5 (JTS5) |
http://100.123.42.5:8080 |
6 (JTS6) |
http://100.123.42.6:8080 |
**!!!Perform the following step only after you are done working on this Lab!!!
Step 6: Stop OpenJTS and clean your VM
Before leaving the Hands-on lab, take care to stop the OpenJTS stack - From your OpenJTS VM:
sudo su
>> fill in the password: Juniper!1

cd /opt/JTS/compose

docker compose down
And finally clean all the containers for the next student:
docker system prune -a -f
You can now close all terminals. Thank you