Leveraging AI-Driven Observability for Enhanced Optical Network Assurance in DCI and WAN Links
Overview
As modern optical networks expand, precise real-time monitoring becomes essential to maintain signal integrity and service reliability across high-capacity links. This hands-on lab demonstrates Juniper’s Routing Director (formerly Paragon) integrated with an LLM-powered Ask Paragon interface, provides a smarter way to monitor and analyze custom optical KPIs specifically tailored for Enterprise Data Center Interconnect (DCI) over DWDM and transcontinental service providers’ WAN links.
Objectives
Participants will learn how AI-assisted observability through the Routing Director can optimize monitoring strategies and improve decision-making processes for complex network environments, ensuring robust performance in DCI and expansive WAN scenarios.
Key Topics
Easily provision optics and configure their assigned wavelengths using Routing Director.
Real-time tracking of critical optical metrics such as
OSNR,input/output power,pre-FEC BER, andtransceiverhealth.Utilizing natural language queries to obtain insights like “Which links have degrading Input Power trends?” or “Show me the pre-FEC BER spikes in the last 24 hours.”
Enhancing operational workflows with AI-driven trend visualization and alerts.
Skills and Tools
Prerequisites: Basic understanding of optical networking and DWDM.
Tools Used: Junos-based infrastructure, Routing Director, Ask Paragon interface.
Methodology Through guided exercises, participants will engage in real-time insights generation and trend analysis using a conversational AI interface. This lab is designed to simulate enterprise and WAN environments, focusing on the unique challenges these networks face.
Benefits Gain valuable skills in deploying AI-driven observability tools that enhance network assurance for DCI over DWDM and transcontinental WAN links. Participants will walk away with actionable strategies to optimize their monitoring practices, thereby improving service reliability and operational efficiency.
Starting Lab
This Lab covers basic optical use cases. It will cover basic configuration needed to bring up ZR/ZR+ Optics and monitoring.
Unamplified Links
Point-to-Point Links where there is no Amplifier required.
Optical Power Limited
Router configuration only
Multiple channels on a single duplex fiber is also possible.
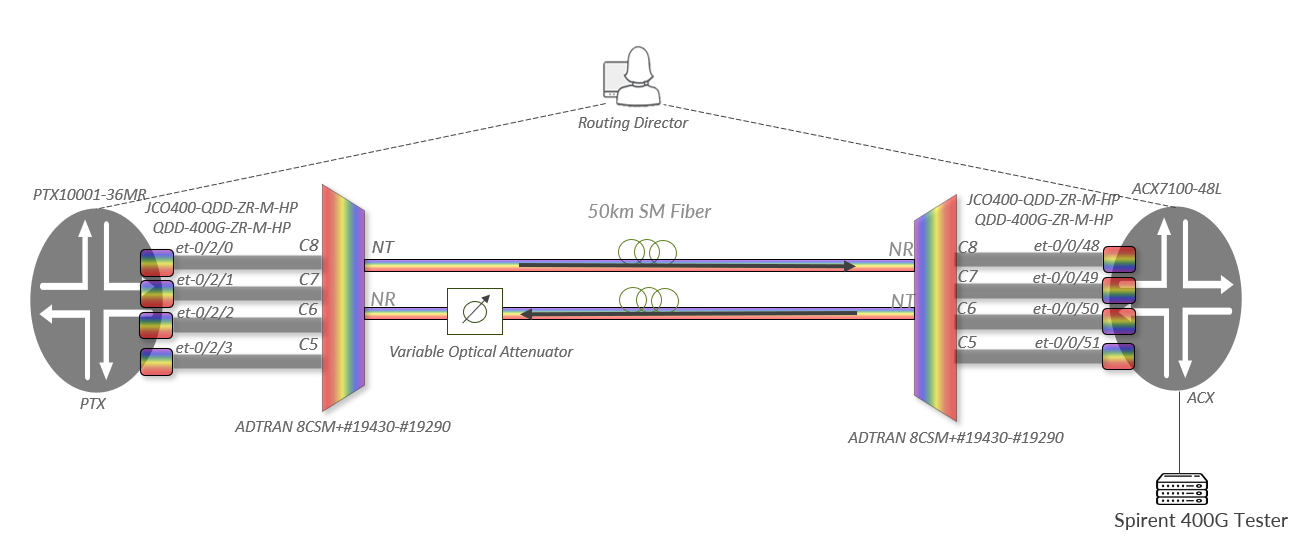
Unamplified 400G ZR+ HP Lab Topology
This topology has 2 Routers, PTX10001-36MR and ACX7100-48L with 400G-ZR+ HP modules. All 4 pairs of modules in this lab. An Adtran 8-channel passive filter is used to multiplex the optical signals then through 50km of fiber. Only 4 pairs of modules are used due to resource limitations. A Variable Optical Attenuator (VOA) will be used to degrade the line.
Users will configure all interfaces. The interfaces should be configured with the correct wavelength to ensure the signal can pass through the filter.
Connect to Routing Director
Make sure your Zscaler Private Connection is enabled.
Then go the Routing Director GUI URL provided via email. Click Advance and then Accept the Risk and Continue. If you using Chrome and cannot continue, click anywhere on the webpage and type thisisunsafe.
Use the same credentials provided via email.
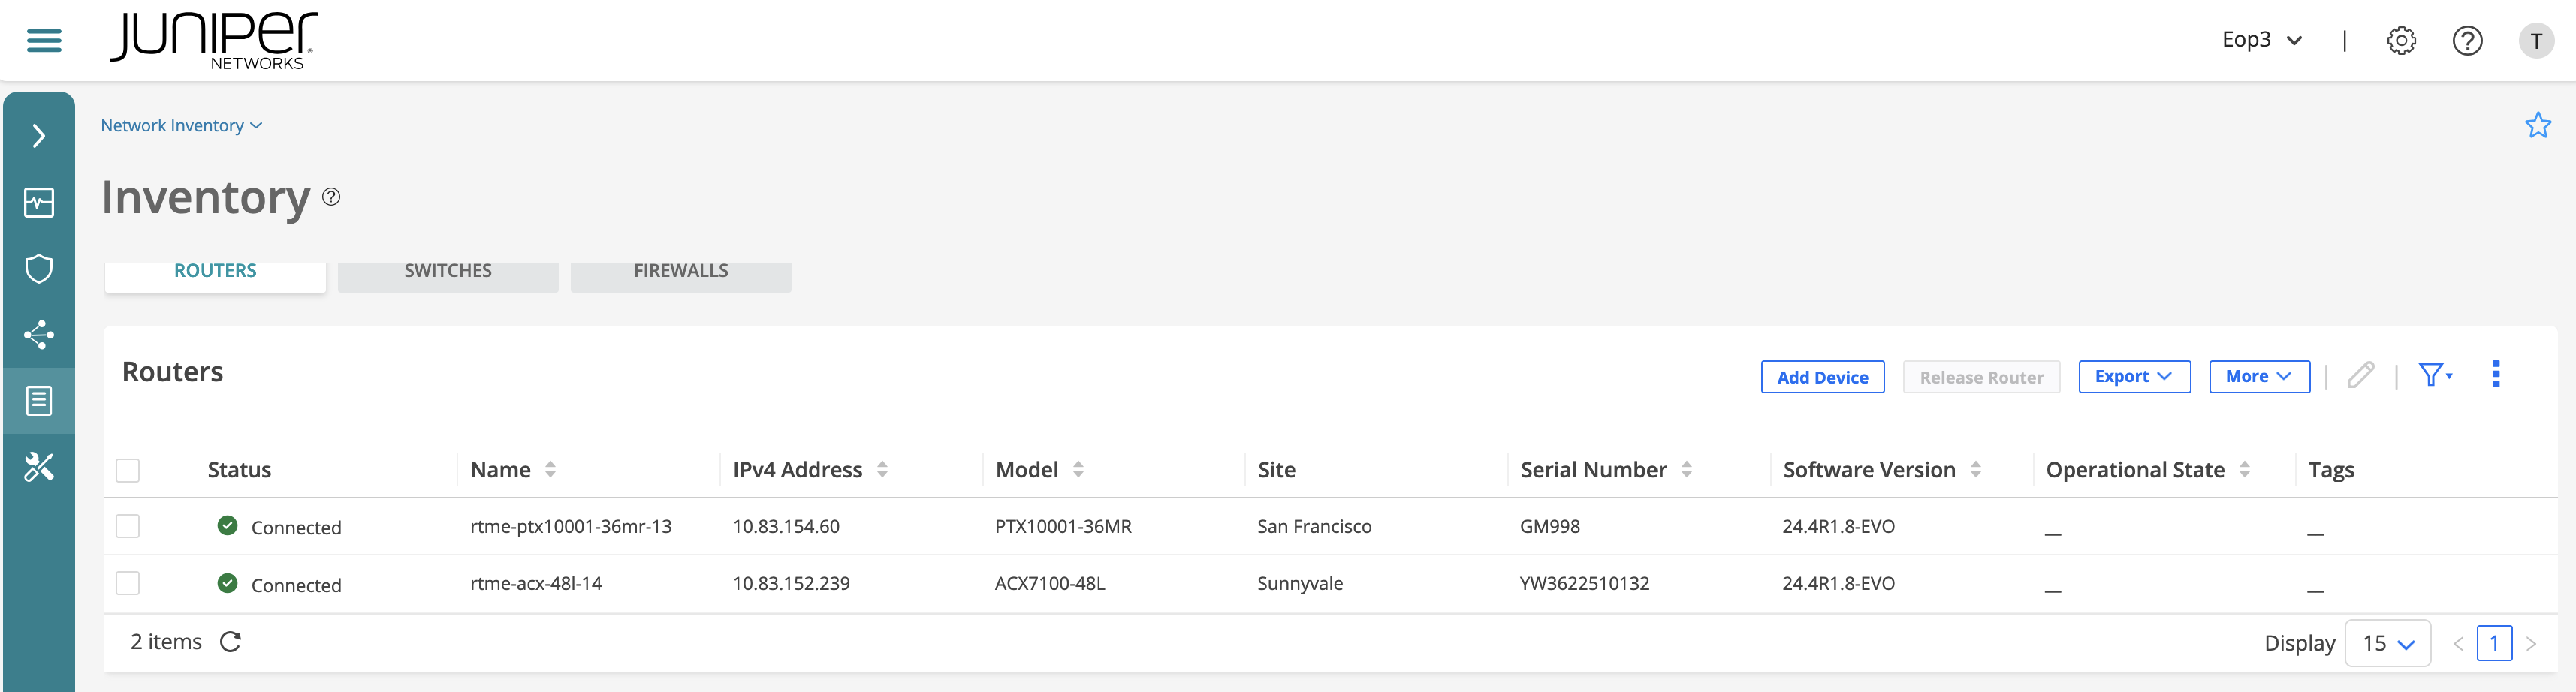
You should see the following at the Inventory > Network Inventory:
Configuration template
Go to Inventory > Configuration Templates and you should see a configuration template (CT) with the following name:
TechSummitOpticsLab_PTX
TechSummitOpticsLab_ACX
Select it and then click in the pencil icon (i.e. edit). A Warning will show up. Click Yes. Click Next and examine it:
configure
set interfaces {{ interface1 }} optics-options wavelength {{ lambda1 }}
set interfaces {{ interface2 }} optics-options wavelength {{ lambda2 }}
set interfaces {{ interface3 }} optics-options wavelength {{ lambda3 }}
set interfaces {{ interface4 }} optics-options wavelength {{ lambda4 }}
commit
Check at the Parameters the different fields required to generate a piece of config from that template. Expand the Parameters. Click Cancel and exit without saving any changes.
Select the configuration template again (TechSummitOpticsLab_PTX) and now click Deploy to Devices.
Select devices and click Deploy.
Select the configuration template again (TechSummitOpticsLab_ACX) and now click Deploy to Devices.
Select devices and click Deploy.
Fill in for each device with below table each of its optics interfaces. Click the > symbol to collapse the form and then select the assigned Interface and Lambda from the appropriate drop-down boxes. The options have been limited to only one to prevent misconfiguring other users’ interfaces.
PTX Channel Plan
Device |
Interface |
Wavelength |
Adtran Port |
|---|---|---|---|
PTX |
et-0/2/0 |
1554.13 |
C8 |
PTX |
et-0/2/1 |
1552.52 |
C7 |
PTX |
et-0/2/2 |
1550.92 |
C6 |
PTX |
et-0/2/3 |
1549.32 |
C5 |
ACX Channel Plan
Device |
Interface |
Wavelength |
Adtran Port |
|---|---|---|---|
ACX |
et-0/0/48 |
1554.13 |
C8 |
ACX |
et-0/0/49 |
1552.52 |
C7 |
ACX |
et-0/0/50 |
1550.92 |
C6 |
ACX |
et-0/0/51 |
1549.32 |
C5 |
Click Preview Configuration so you should see something like this:
PTX
set interfaces et-0/2/0 optics-options wavelength 1554.13
set interfaces et-0/2/1 optics-options wavelength 1552.52
set interfaces et-0/2/2 optics-options wavelength 1550.92
set interfaces et-0/2/3 optics-options wavelength 1549.32
ACX
set interfaces et-0/0/48 optics-options wavelength 1554.13
set interfaces et-0/0/49 optics-options wavelength 1552.52
set interfaces et-0/0/50 optics-options wavelength 1550.92
set interfaces et-0/0/51 optics-options wavelength 1549.32
Then click Deploy and you should see a workflow being started (Configuration Template request correctly submitted). Once it has successfully finished, the configuration should have been pushed to the devices. Click on Job Details and you should see at the Audit Logs the job.
Verification via SSH/CLI (Optional)
Optionally, logon to the devices by opening any terminal program on your laptop and ssh into them. You should be able to see it.
Use the following credentials to login:
User |
Password |
|---|---|
ts2025 |
ts_2025! |
# ssh ts2025@rtme-ptx10001-36mr-13.englab.juniper.net

root@rtme-ptx10001-36mr-13> show configuration | display set | match wavelength
set interfaces et-0/2/0 optics-options wavelength 1554.13
set interfaces et-0/2/1 optics-options wavelength 1552.52
set interfaces et-0/2/2 optics-options wavelength 1550.92
set interfaces et-0/2/3 optics-options wavelength 1549.32
# ssh ts2025@rtme-acx-48l-14.englab.juniper.net

root@rtme-acx-48l-14> show configuration | display set | match wavelength
set interfaces et-0/0/48 optics-options wavelength 1554.13
set interfaces et-0/0/49 optics-options wavelength 1552.52
set interfaces et-0/0/50 optics-options wavelength 1550.92
set interfaces et-0/0/51 optics-options wavelength 1549.32
Ask Paragon
At the bottom right corner of the GUI, you can find the Ask Paragon icon:
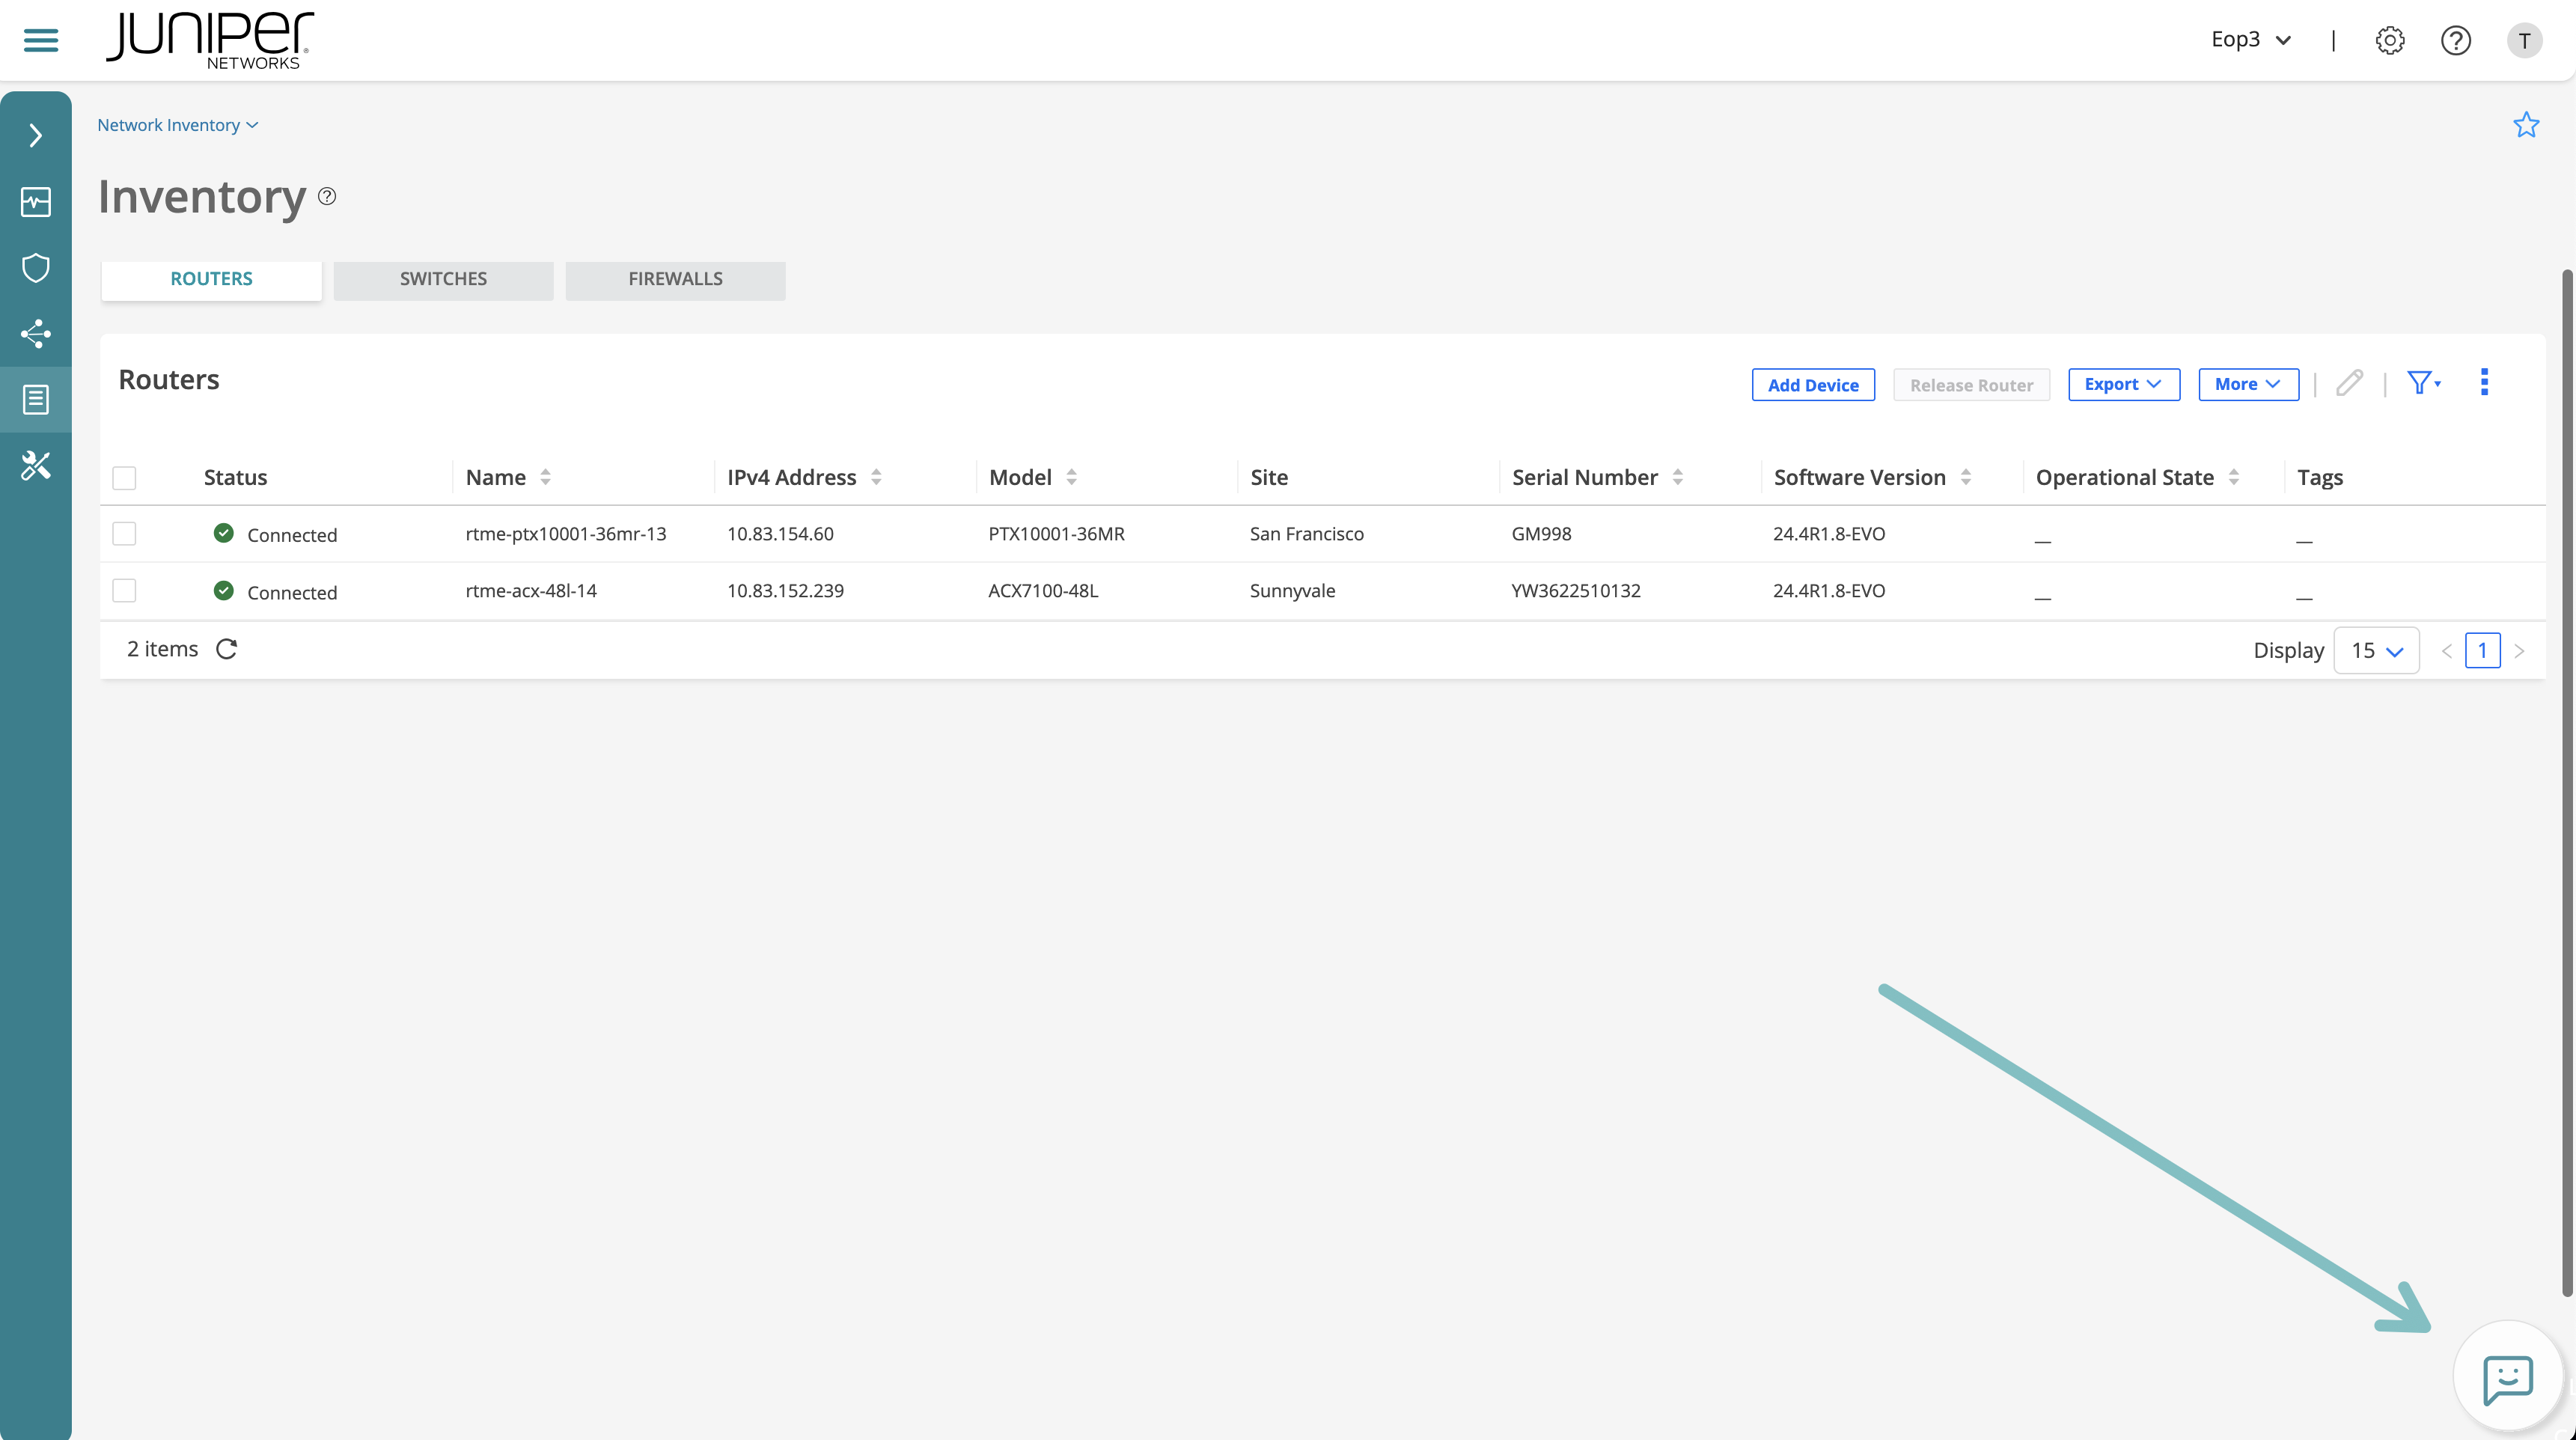
Click on it and it will open a window so you can interact with it. Here it is a scenario you can play with:
You are a working at Network Operator Center. There are complains of intermittent packet loss and sometimes complete traffic loss. Can Paragon save the day and find the root cause?
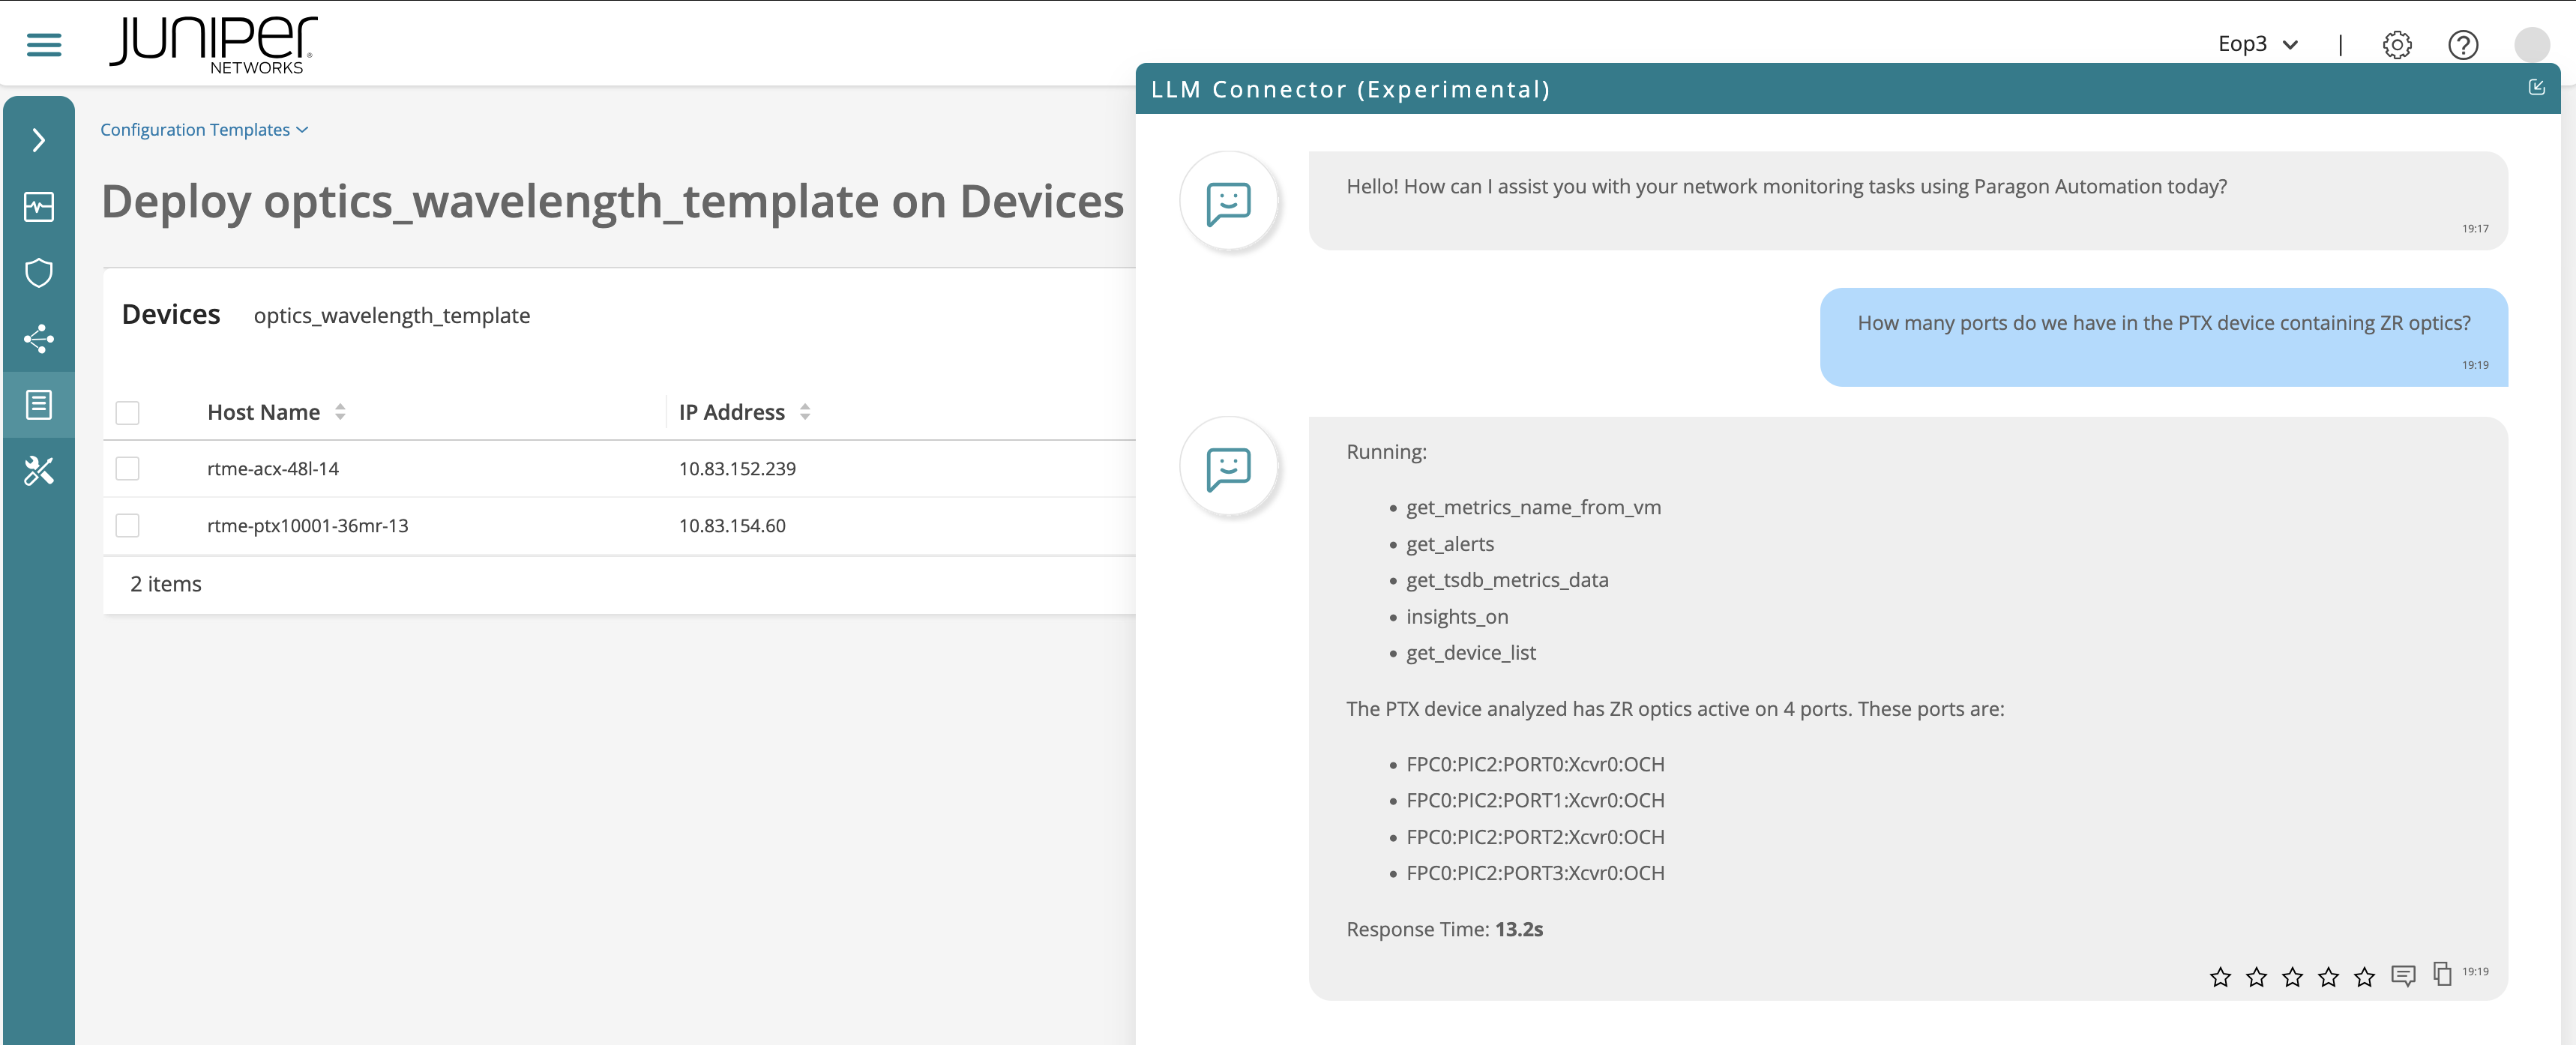
Ask Paragon “How many ports do we have in the PTX device containing ZR optics?”
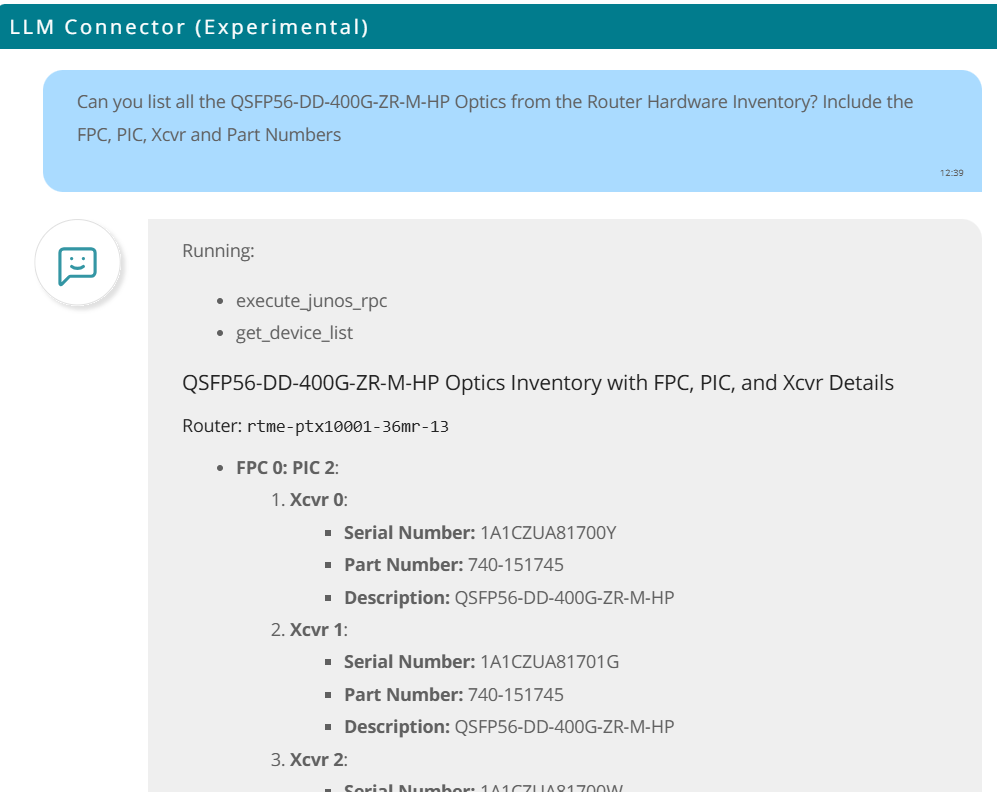
Ask Paragon “Can you list all the QSFP56-DD-400G-ZR-M-HP Optics from the Router Hardware Inventory? Include the FPC, PIC, Xcvr and Part Numbers”
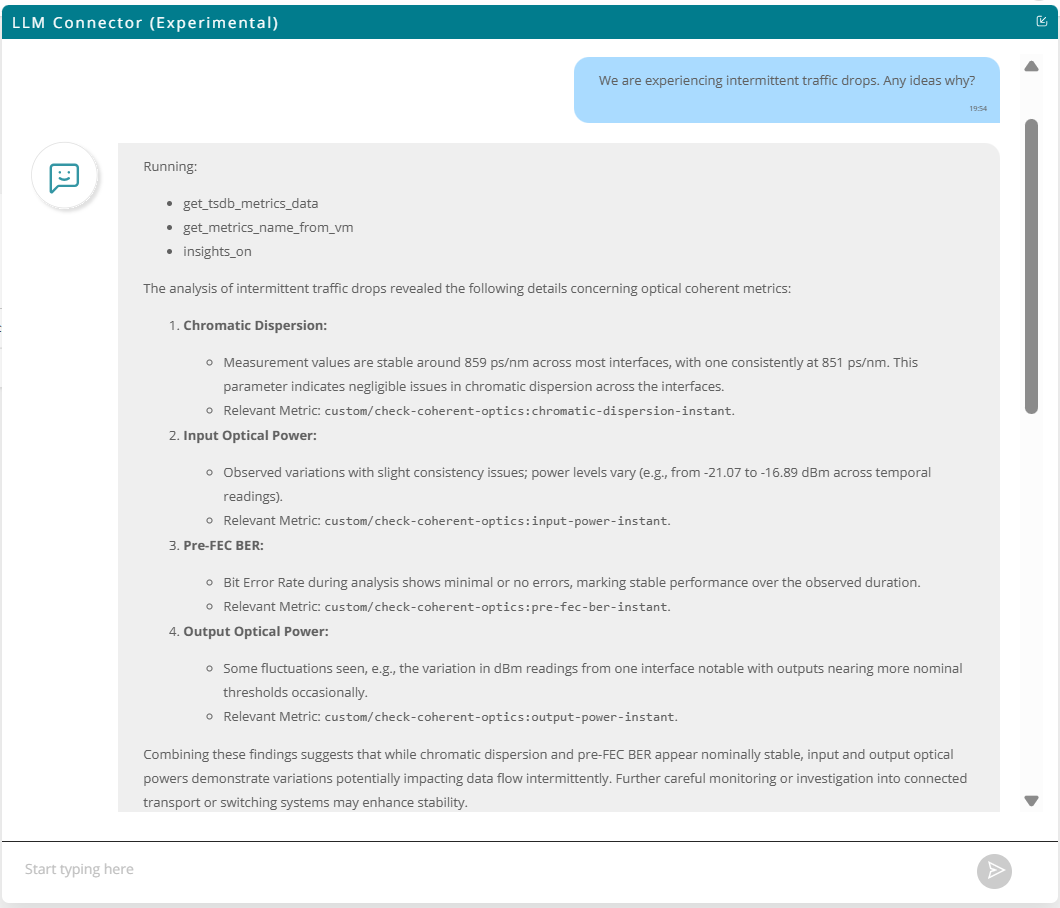
Ask Paragon “We are experiencing intermittent traffic drops. Any ideas why?”
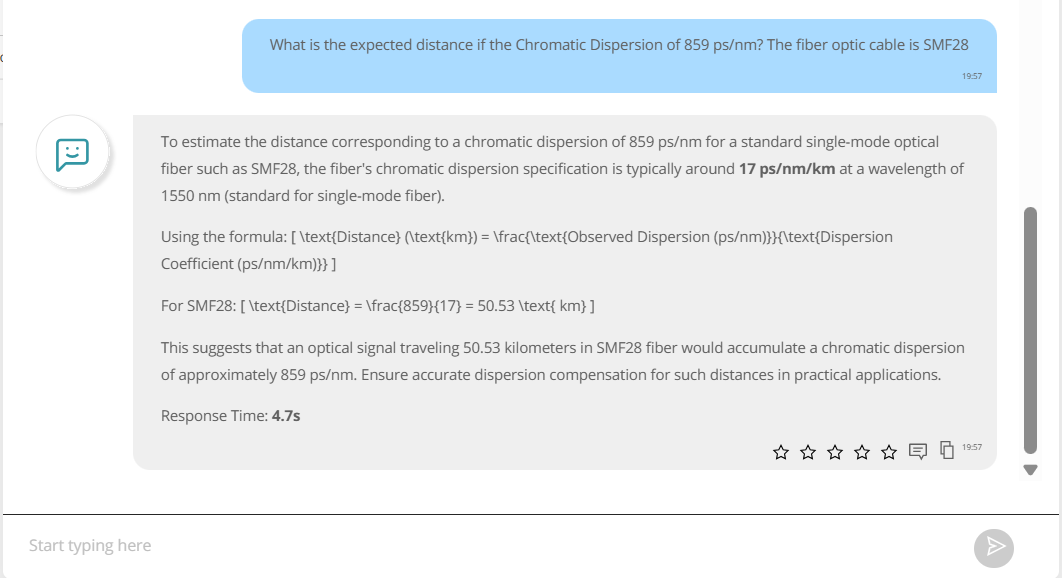
Ask Paragon “What is the expected distance if the Chromatic Dispersion of 859 ps/nm? The fiber optic cable is SMF28”
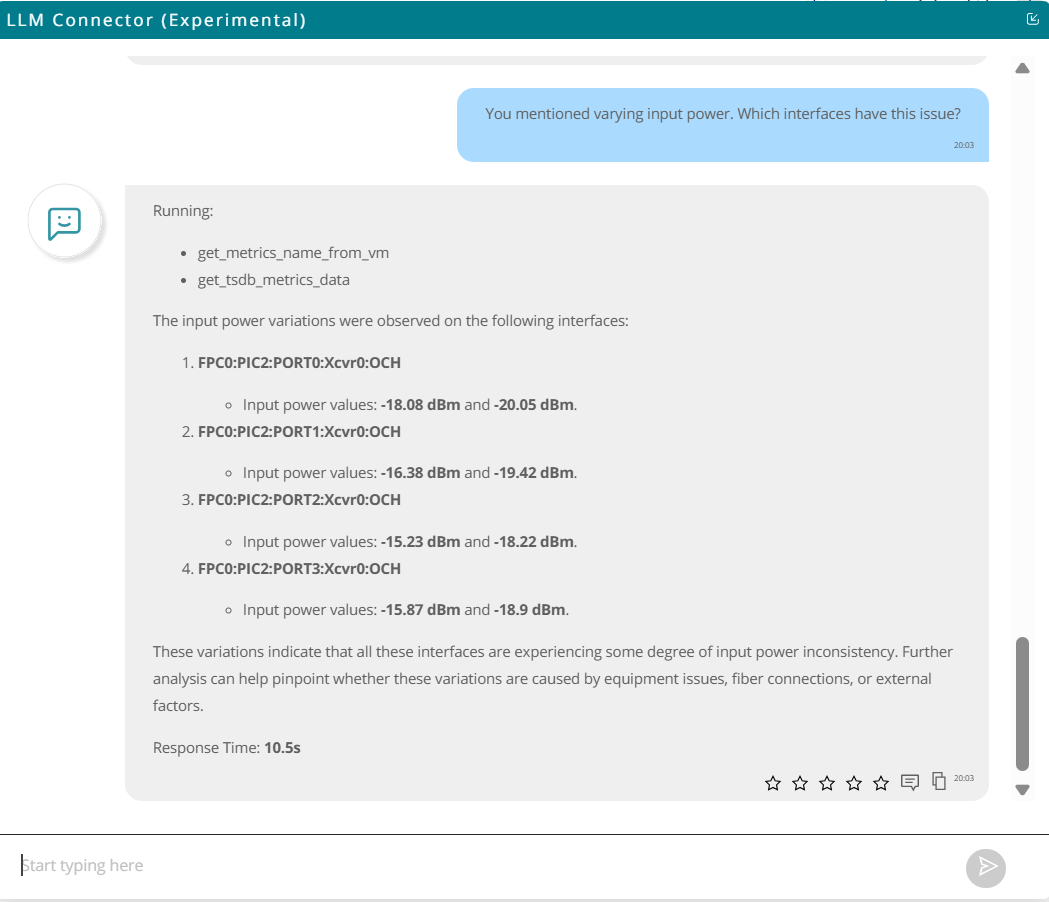
Ask Paragon “You mentioned varying input power. Which interfaces have this issue? Please list all affected interfaces.”
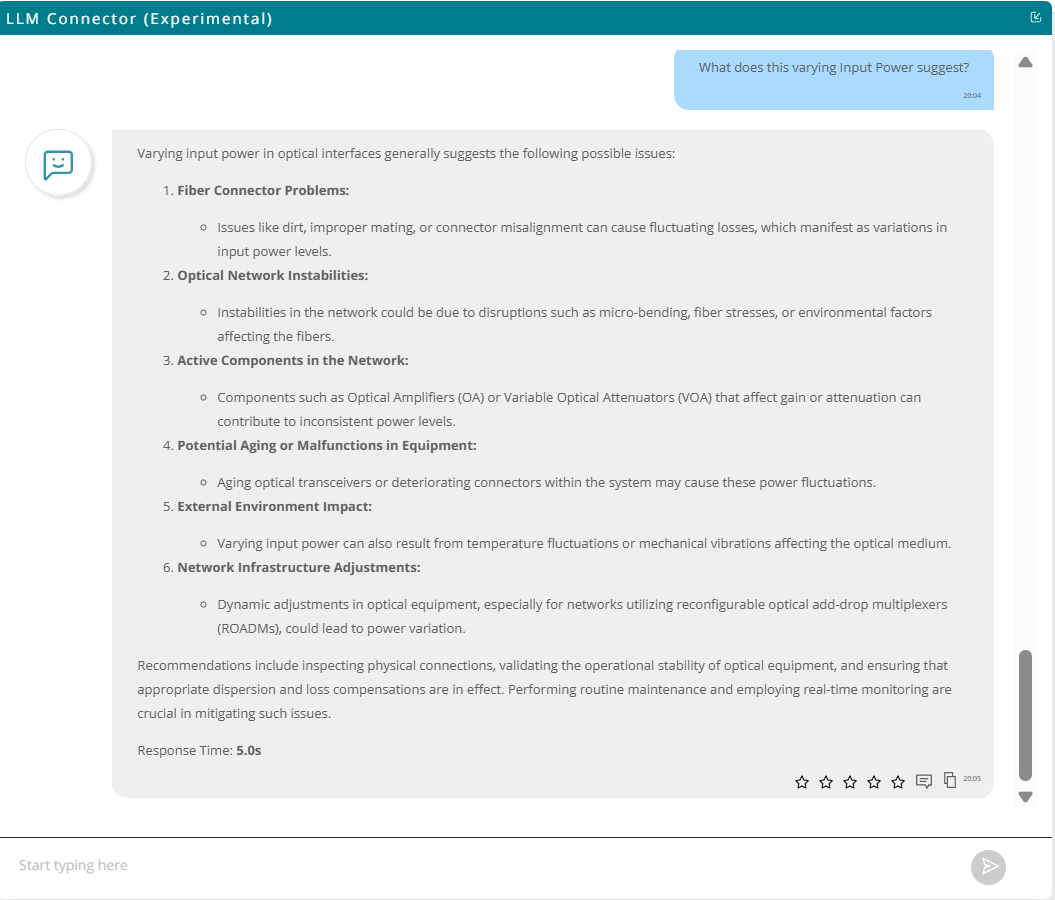
Ask Paragon “What does this varying Input Power suggest?”
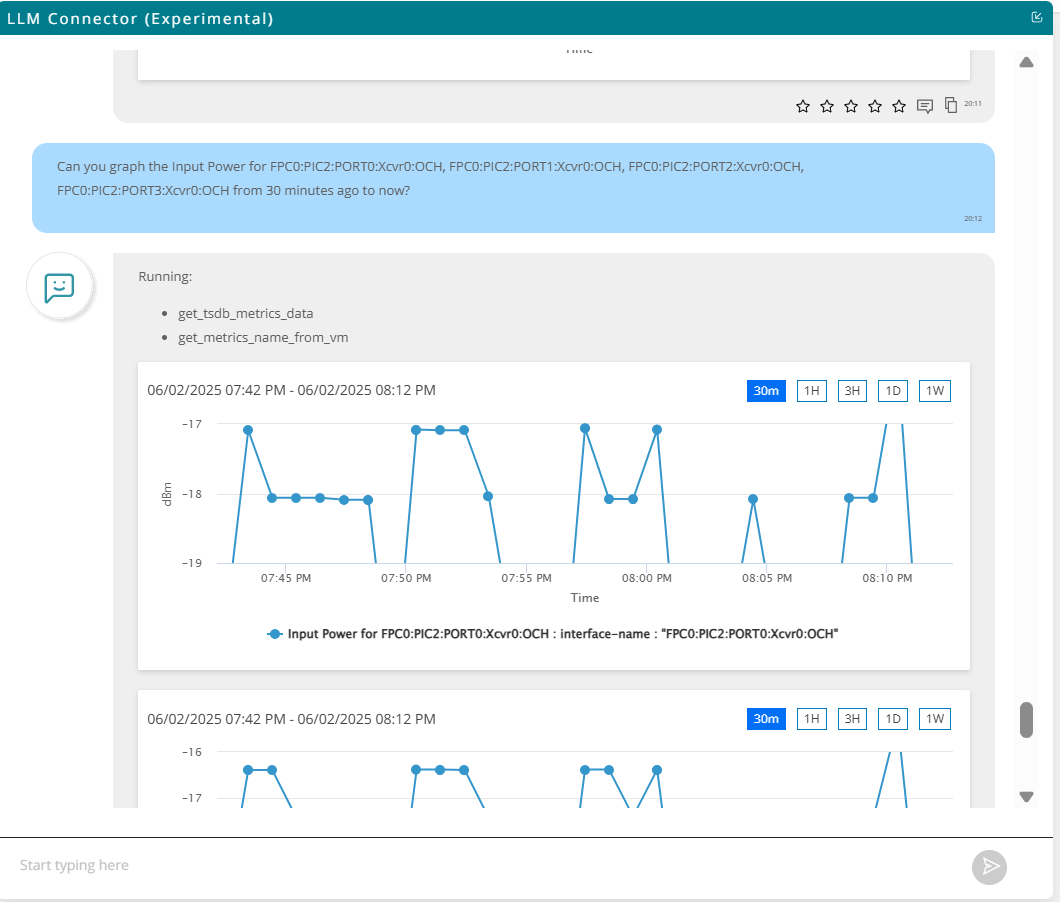
Ask Paragon “Can you graph the Input Power for FPC0:PIC2:PORT0:Xcvr0:OCH, FPC0:PIC2:PORT1:Xcvr0:OCH, FPC0:PIC2:PORT2:Xcvr0:OCH, FPC0:PIC2:PORT3:Xcvr0:OCH from 30 minutes ago”
If it does not answer correctly, maybe try in a different way:
Can you graph the Input Power for all the DWDM interfaces affected? One graph per interface, gathering data from the last 30 minutes.
Else, you can ask it to plot it one by one. For example:
Can you graph the Input Power for FPC0:PIC2:PORT0:Xcvr0:OCH interface?
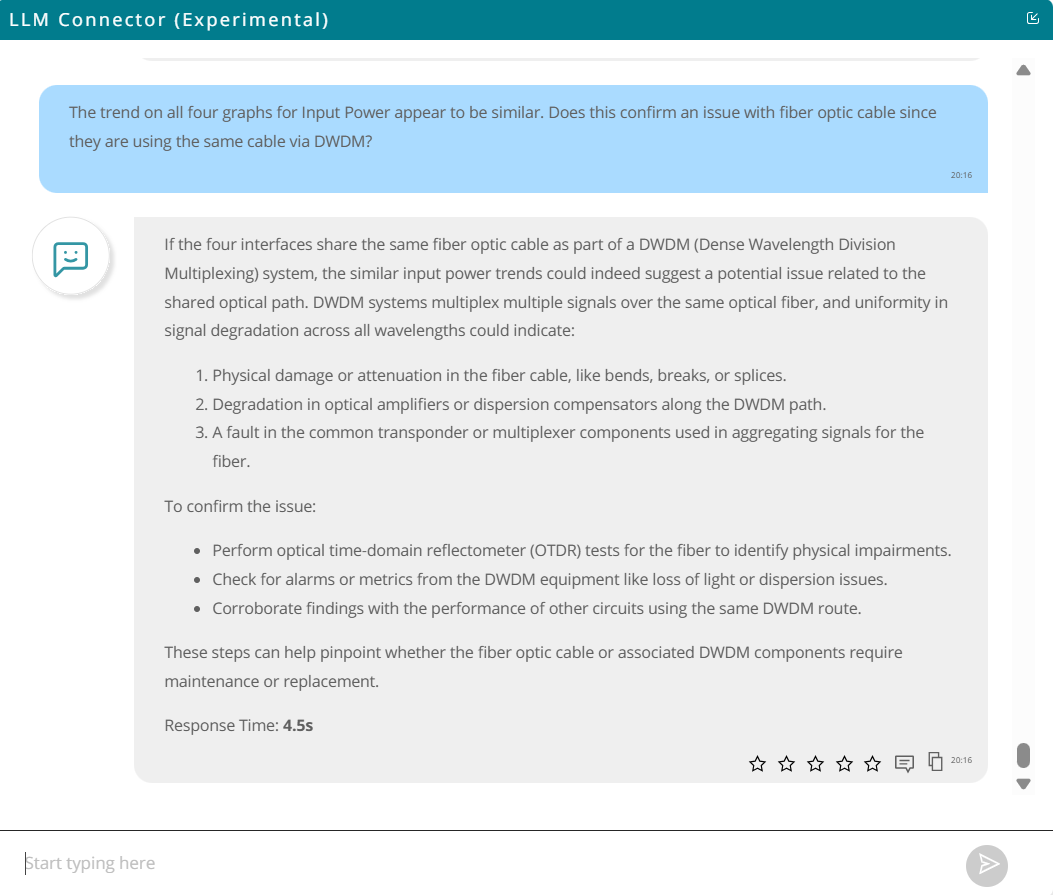
Ask Paragon “The trend on all four graphs for Input Power appear to be similar. Does this confirm an issue with fiber optic cable since they are using the same cable via DWDM?”
TIPS: If the response is not satisfactory, you can repeat the question. If the issue persists, rephrase the question with additional context for clarity. Alternatively, refresh the page to reset the context and try again. Keep in mind that this feature is experimental.
You have successfully completed this Hands-On Lab!
Lab Survey
Please take 2 minutes and complet the Optical Network Assurance Hands-On Lab Survey