Enterprise Routing Active Testing and Routing Director 2.4.0 API Lab
Overview
Routing Active Testing improves network Performance by using programmable, software-based test agents integrated with Routing Director as the controller that actively generates [synthetic traffic]{.underline} to simulate real-world network conditions. This active testing approach verifies application and service performance continuously throughout the service lifecycle, unlike passive monitoring which only observes existing traffic.
How Routing Active Testing enhances Network wide assurance and Solves Productivity issues in Enterprise
Real-time, multi-layer testing: Test agents measure Network or service quality across multiple layers (L2-L7) and technology domains in real time, enabling comprehensive visibility into network and application performance.
Proactive comprehensive Testing and Issue detection: Synthetic traffic is sent periodically by monitoring agents across different network locations, enabling continuous assessment of network metrics such as latency, packet loss, jitter, and throughput even when no real user traffic is present. Continuous active monitoring detects and troubleshoots problems before they impact end users, improving incident resolution times.
Flexible deployment Options: Test agents can be deployed as virtual machines, containers, software appliances, or embedded in network devices, allowing testing across physical, hybrid, and virtual networks. Routing Director acts as a Controller for these test Agents.
Augments Service or Network Changes with synthetic testing: Any additions or modifications of the network to enhance your network is assured to give quicker turnaround time by detecting issues proactively.
Comprehensive audit capabilities: Through strategically placed test agents, Routing Active Testing can audit thousands of endpoints simultaneously, providing detailed insights into network performance trends and problematic nodes. These Audits can catch issues related to control plane / data planes or misconfigurations of QOS policies or firewalls.
Automation and integration: With REST APIs and YANG models, it integrates with network controllers, orchestrators, and OSS systems to automate testing workflows, reducing manual effort and operational costs.
By actively verifying service configurations before deployment and continuously monitoring live services, Routing Active Testing enables network teams to deliver high-quality, reliable services faster and with fewer errors, ultimately optimizing network performance testing and assurance
Starting Lab
The objective of this Lab is to:
Get hands of experience of Routing Director 2.0 family with a concentration on Routing Active Testing.
Perform Active Assurance Tests and Monitors using Templates and Observability of test results.
Execute various Assurance Use-Cases from Activation Testing to Performance Monitoring.
Execute scripts to demonstrate seamless integration with third party applications by using REST APIs.
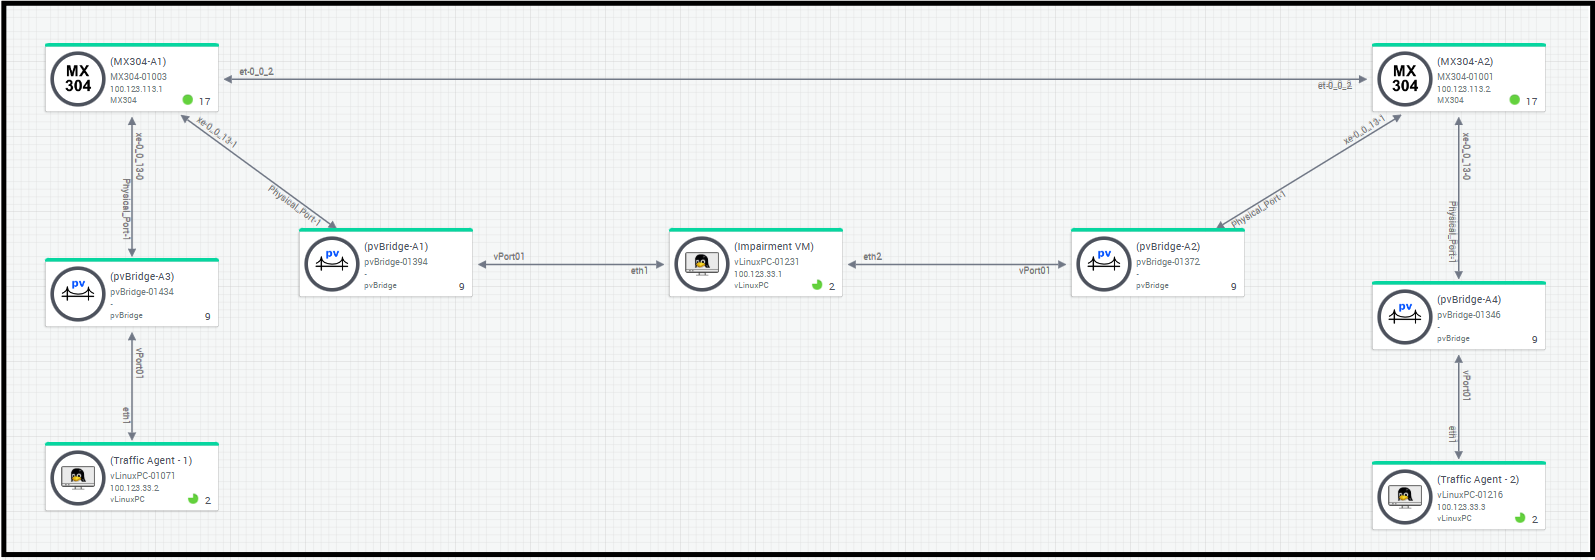
Lab Topology
Consists of a pair of MX204 or MX304 connected via an Impairment vm with Routing Active Test Agent Application running VM’s to send traffic streams. There is also a direct connection.
Enterprise Routing Active Testing
Login to Routing Director via Jumpbox
Using RDP Client, connect to your Labuser assigned IP address/Port
Login using your Lab User credentials
Open Chrome, and navigate to https://100.123.42.100, you should see the login page to Juniper Routing Director GUI
Login using your Lab User credentials
Username - jcluser@juniper.net
Password - Juniper!1
Test1 – Enterprise Service Activation / Reachability – Test DNS, Ping
Once the network or service is built, we need to be assured that this network or service is Up. At this stage we are not worried about performance, but whether the network or service is working at all and be assured that the network or service is functioning at optimal level by way of observing the KPI’s like delay, jitter, loss. so, we test connectivity from Branch to Branch and Branch to Internet.
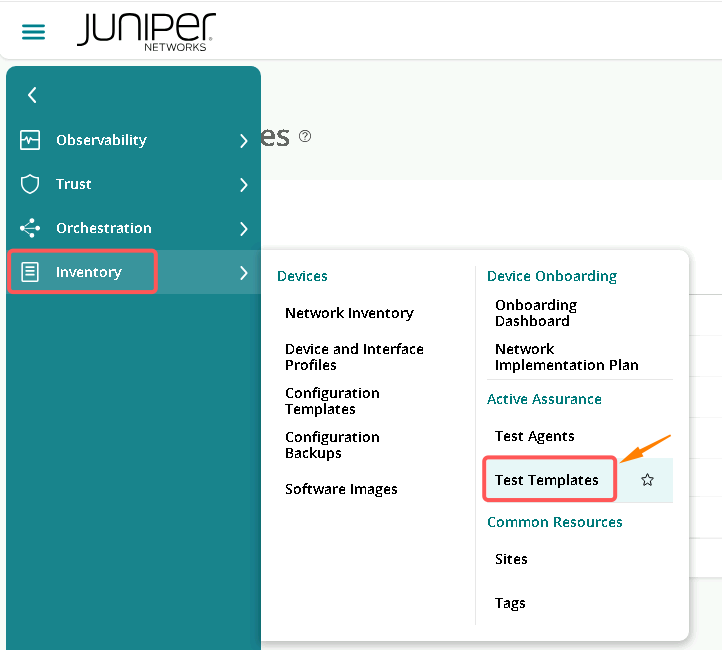
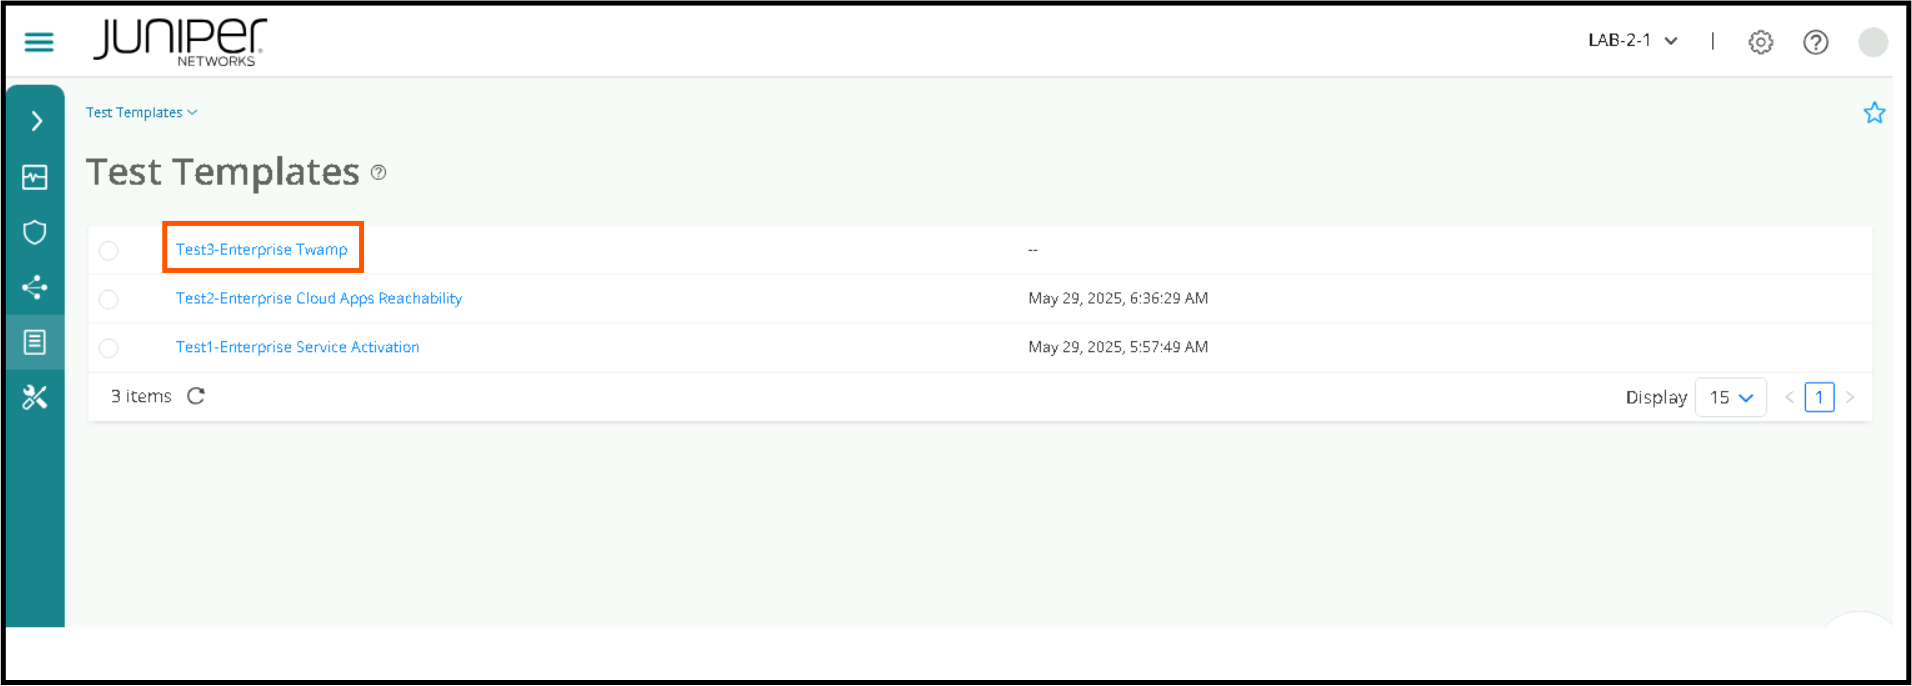
Navigate to the pre-configured Test Templates, Click on Inventory > Test Templates
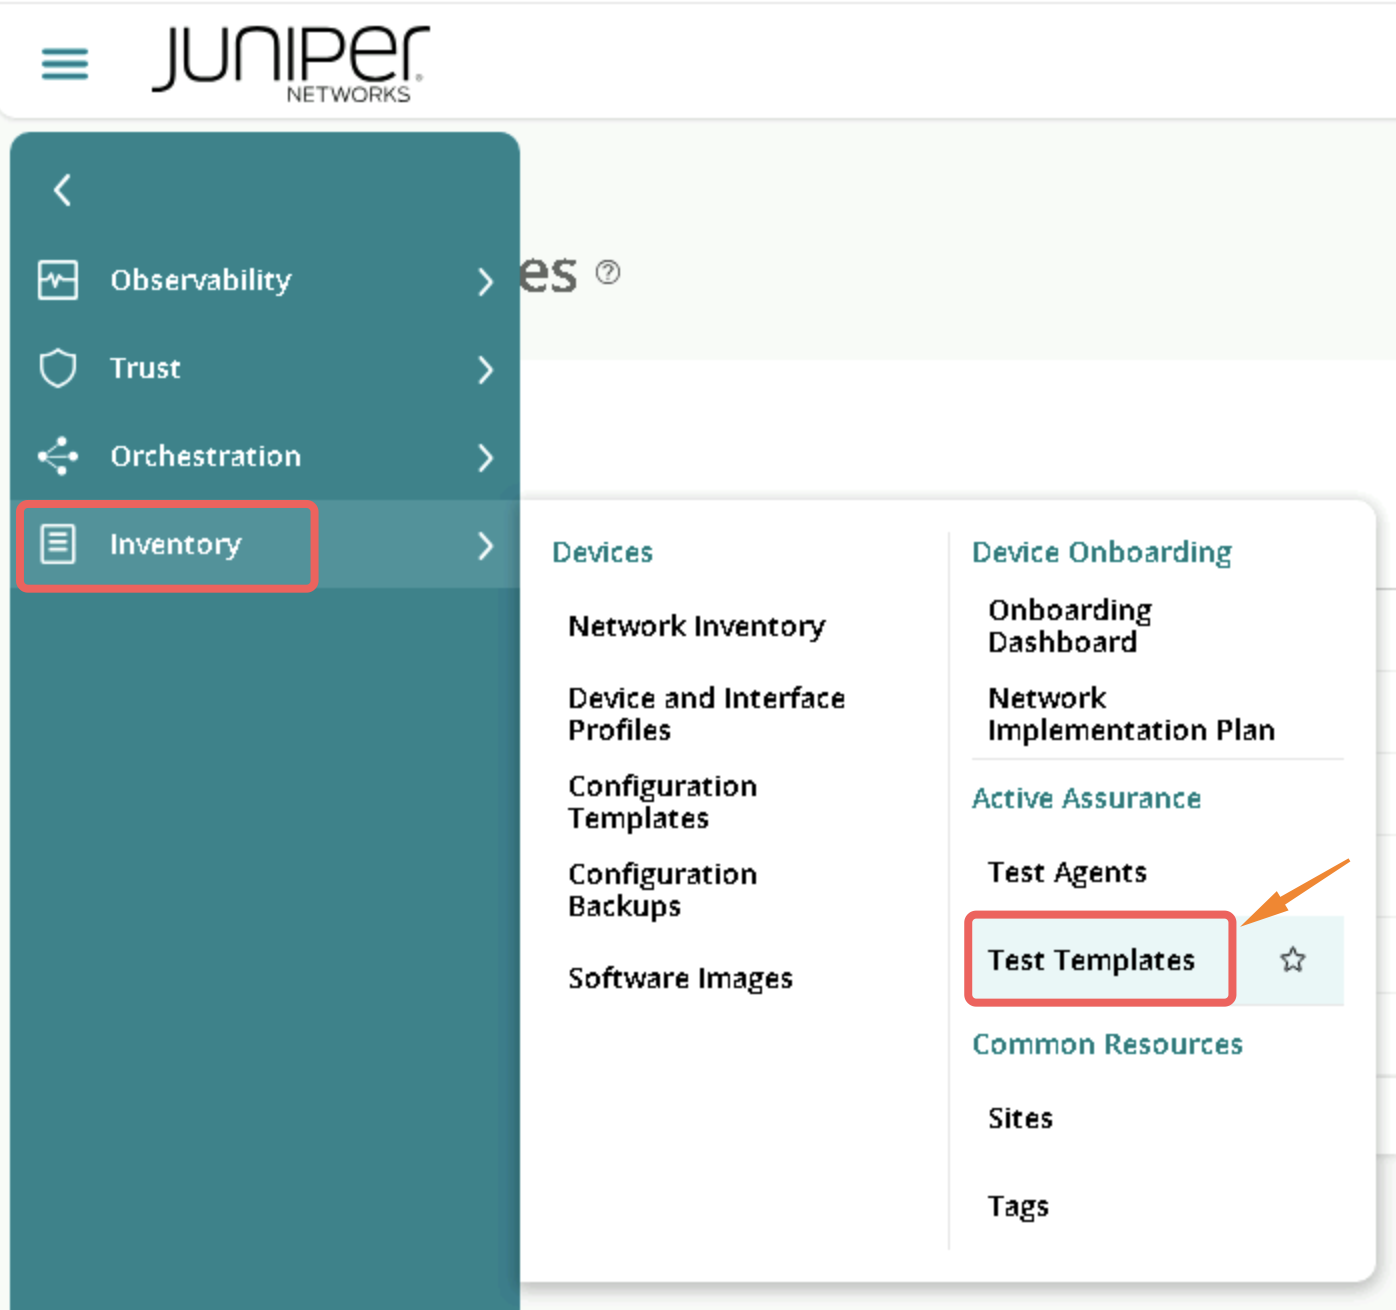
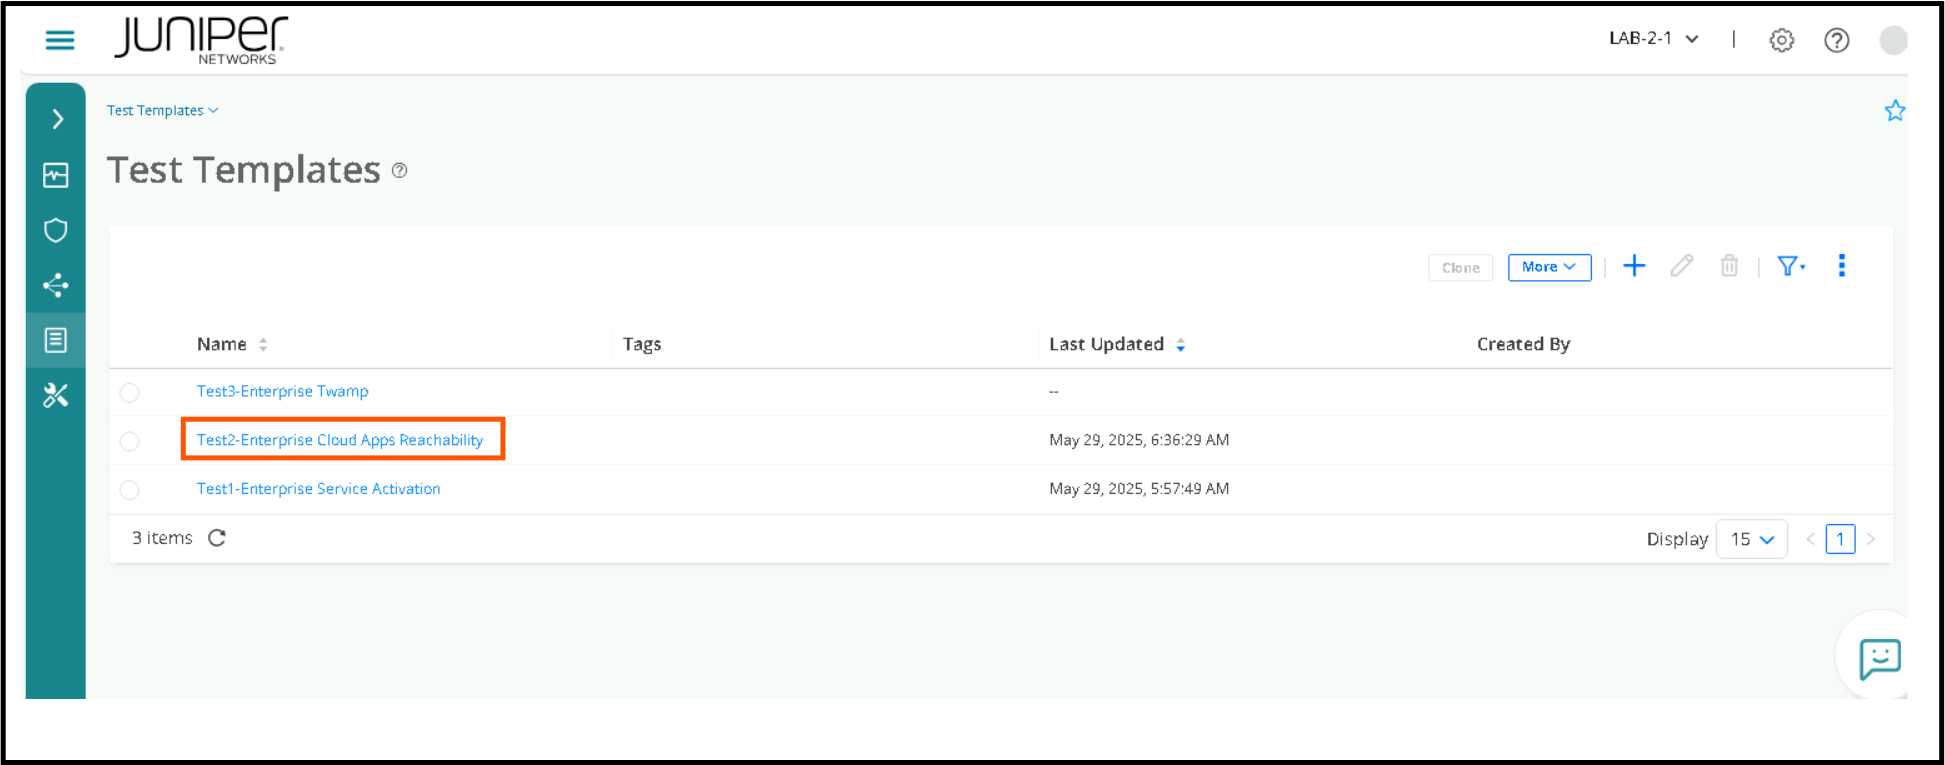
This page will show all the pre-configured Templates that we’ll be using for this Lab.
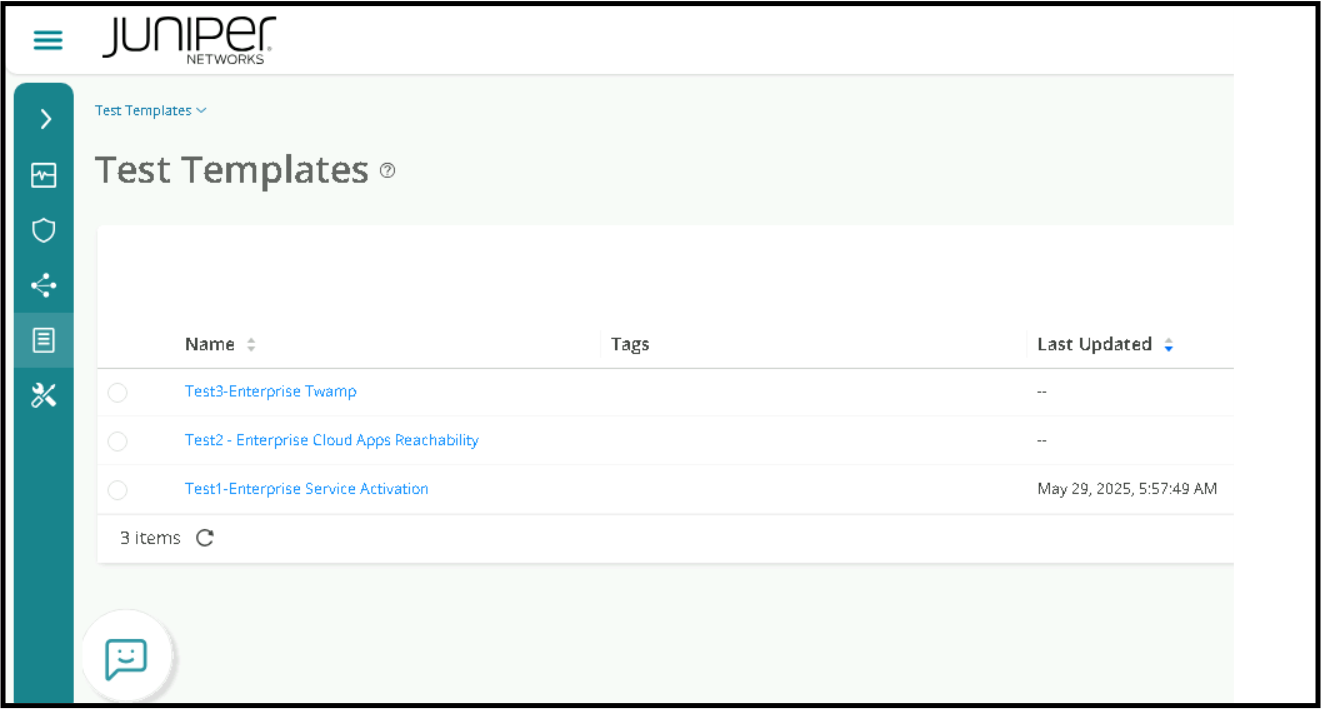
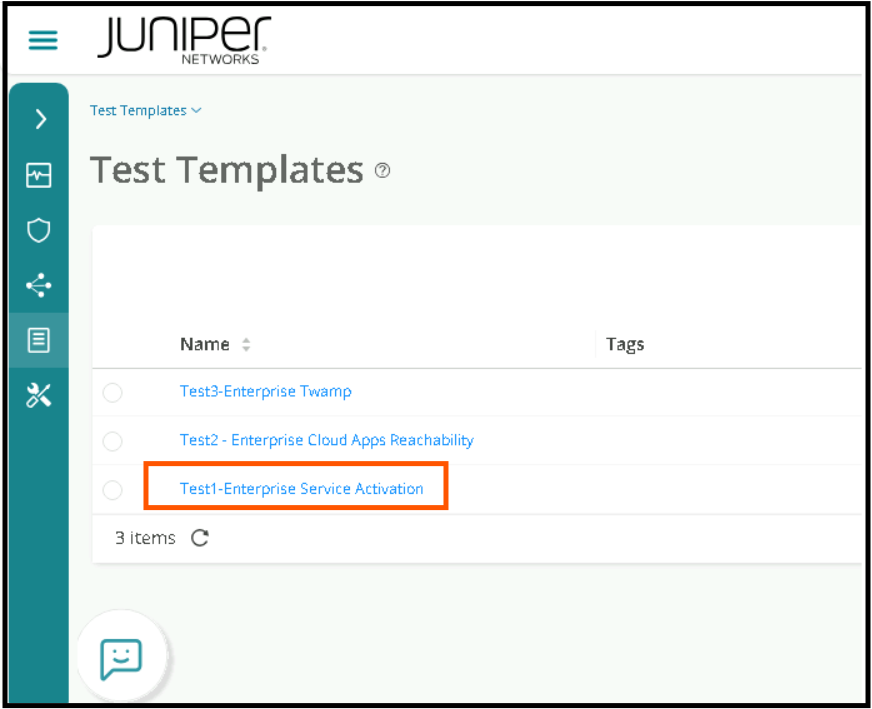
Go to Test Templates page and Click on Test 1 – Enterprise Service Activation
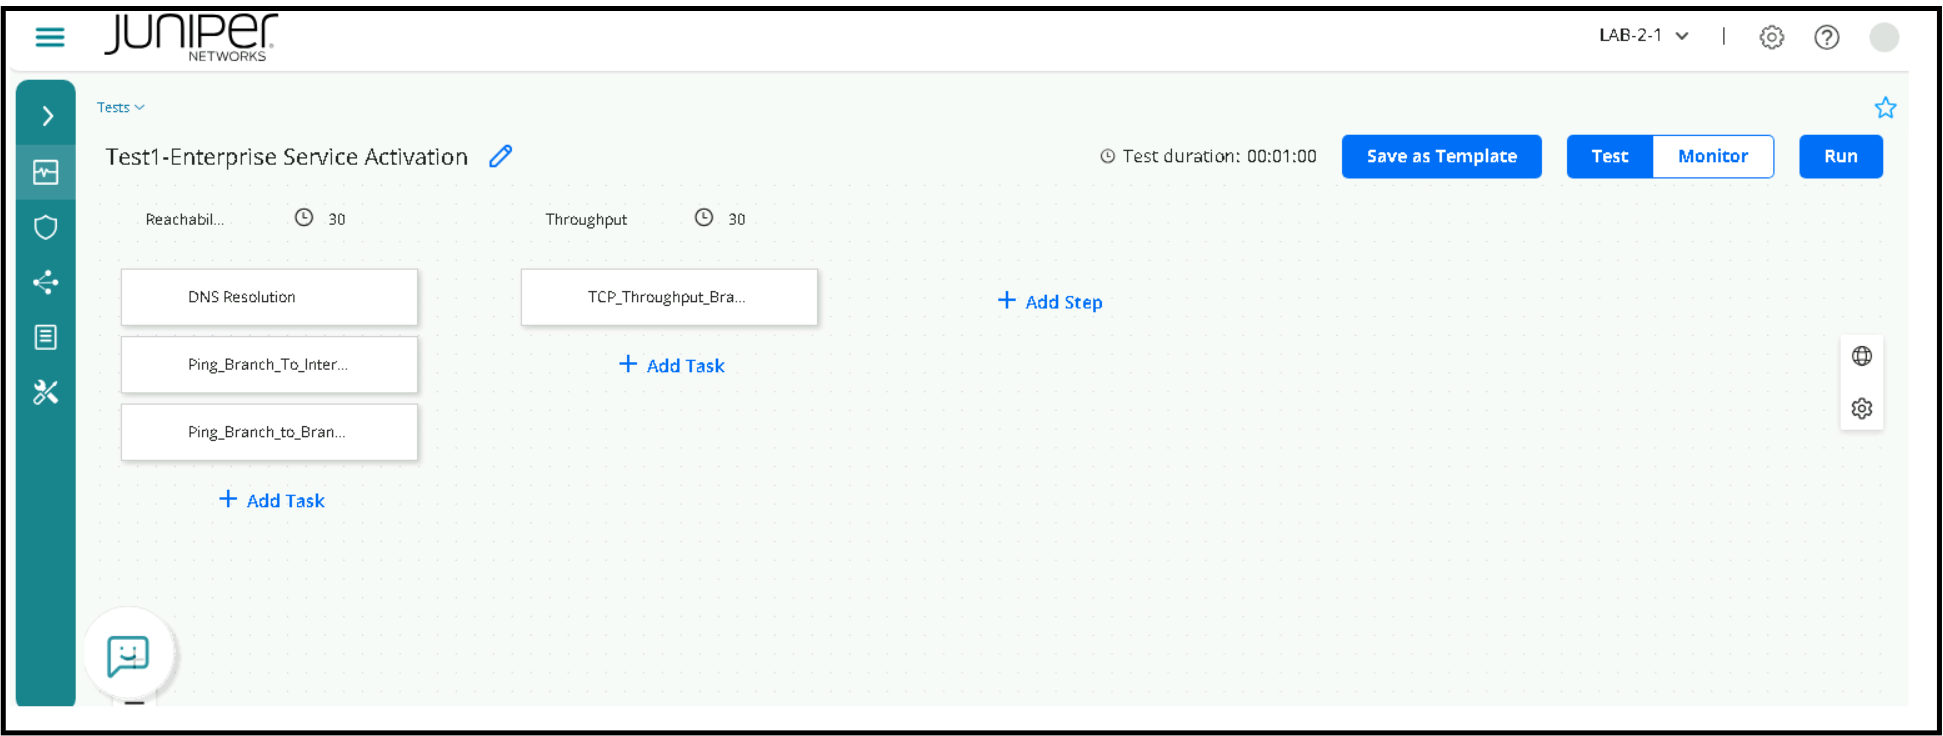
The test is further divided into Sub tasks. Please don’t change any parameters.
Task 1.1: DNS Resolution
This test will try to resolve google.com
Task 1.2: Ping from Branch to Internet
This test will do a PING from the Branch to the Internet (Google).
Task 1.3: Ping from Branch to Branch
This test will do a PING from one Branch to another Branch
Task 2.1: TCP throughput from Branch to Branch
This test will perform a Bandwidth test from one Branch LAN to another Branch LAN
Click on Run to execute the tests.
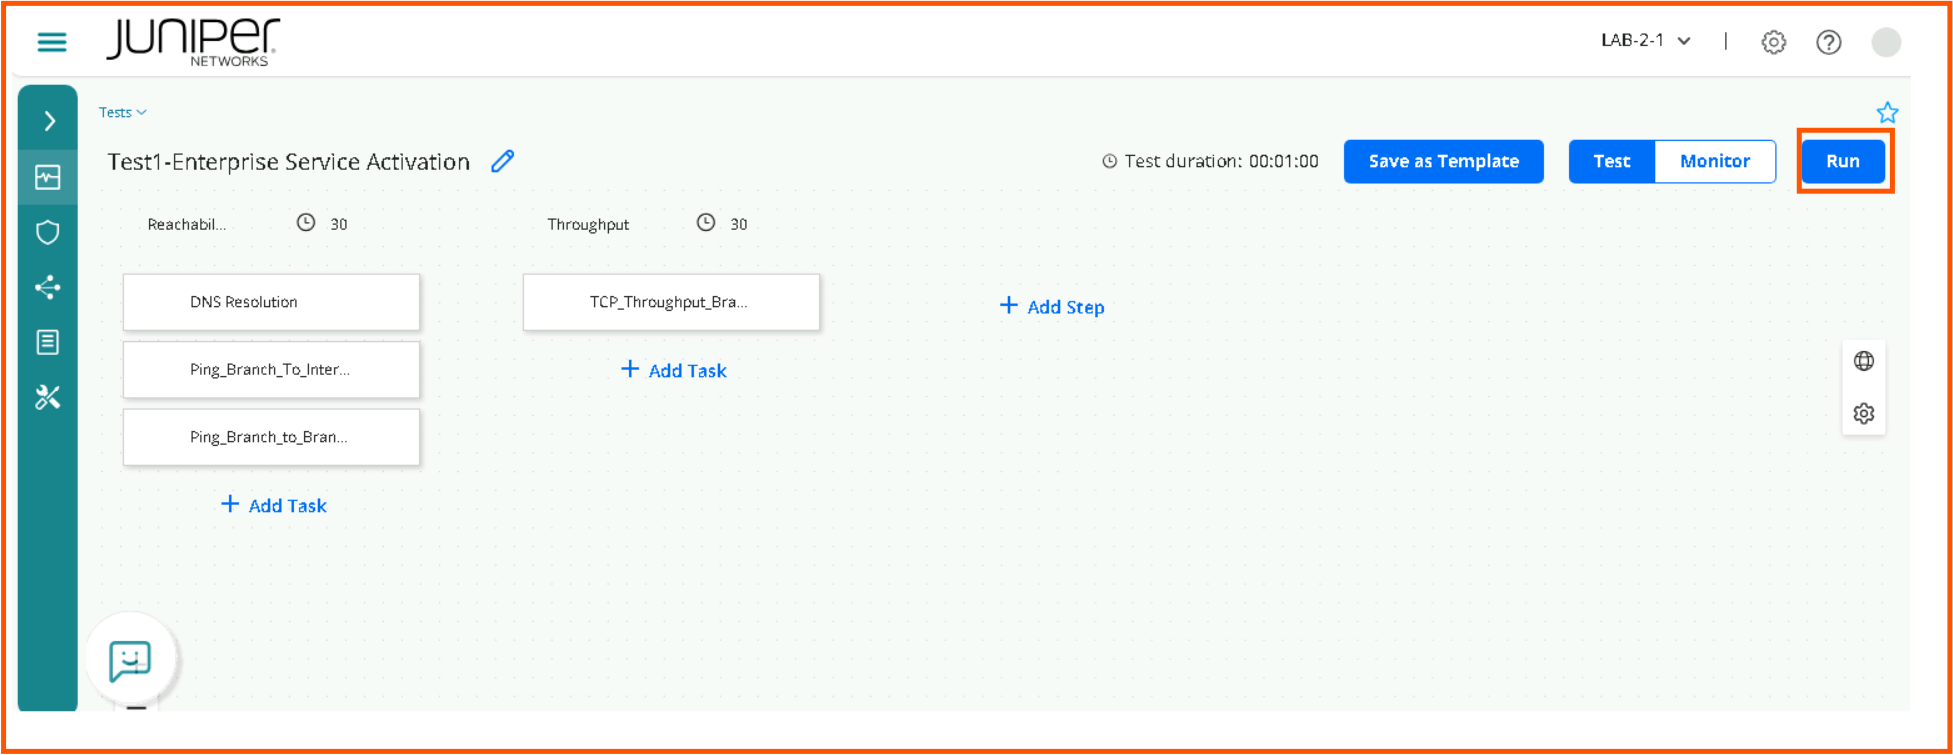
All the tests will run in sequence; Task 1.1 > Task 1.2 > Task 1.3 > Task 2.1, we need to wait for the Tests to complete. The screen will need to be refreshed periodically.
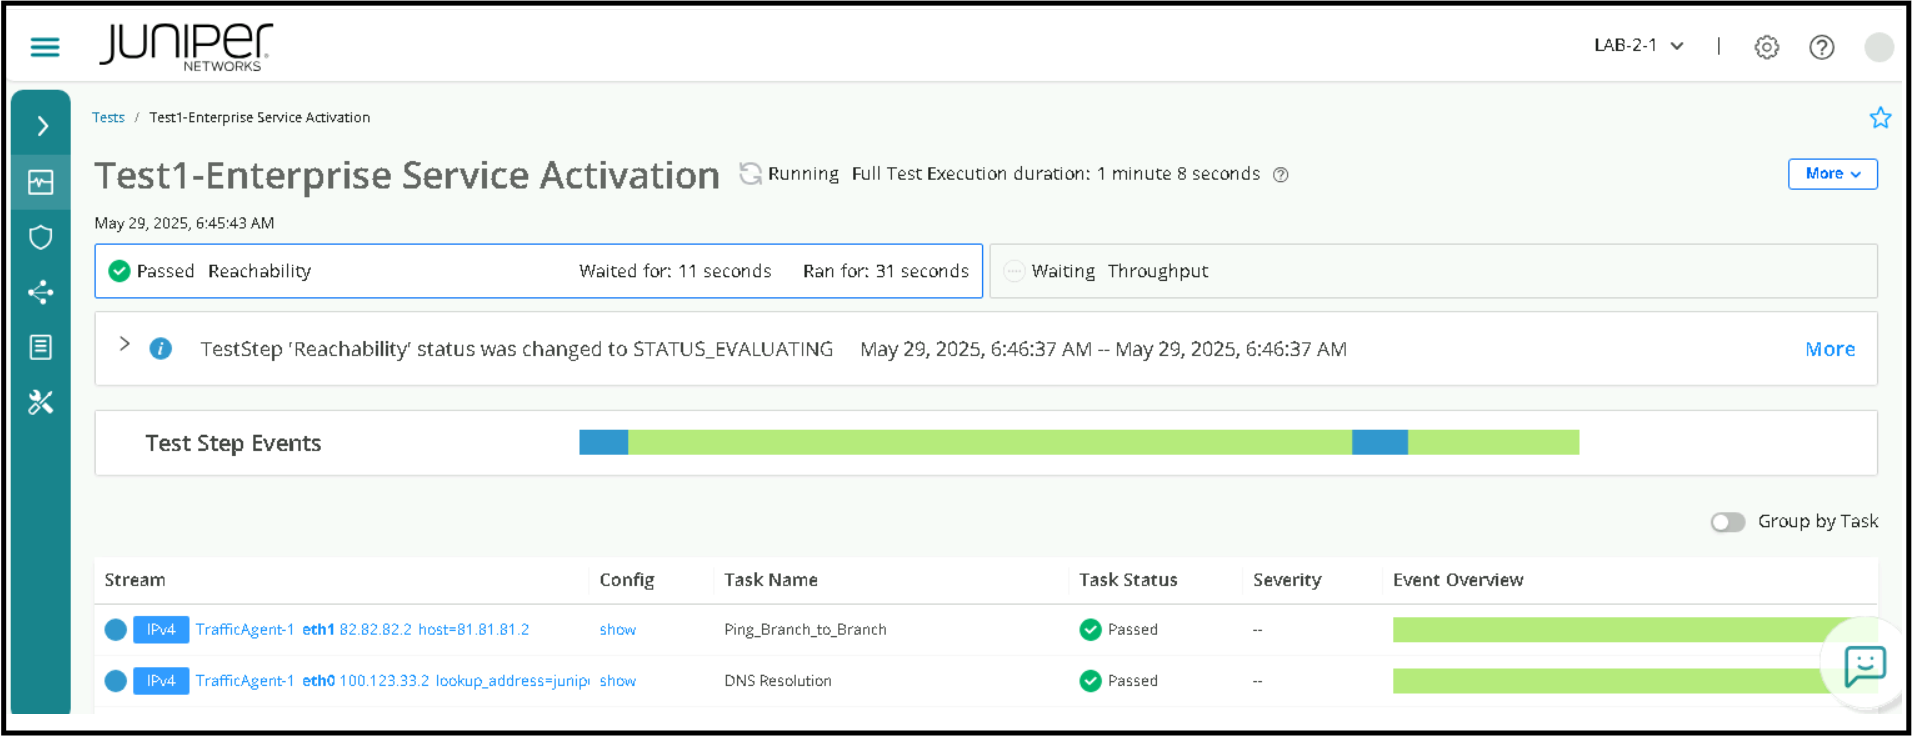
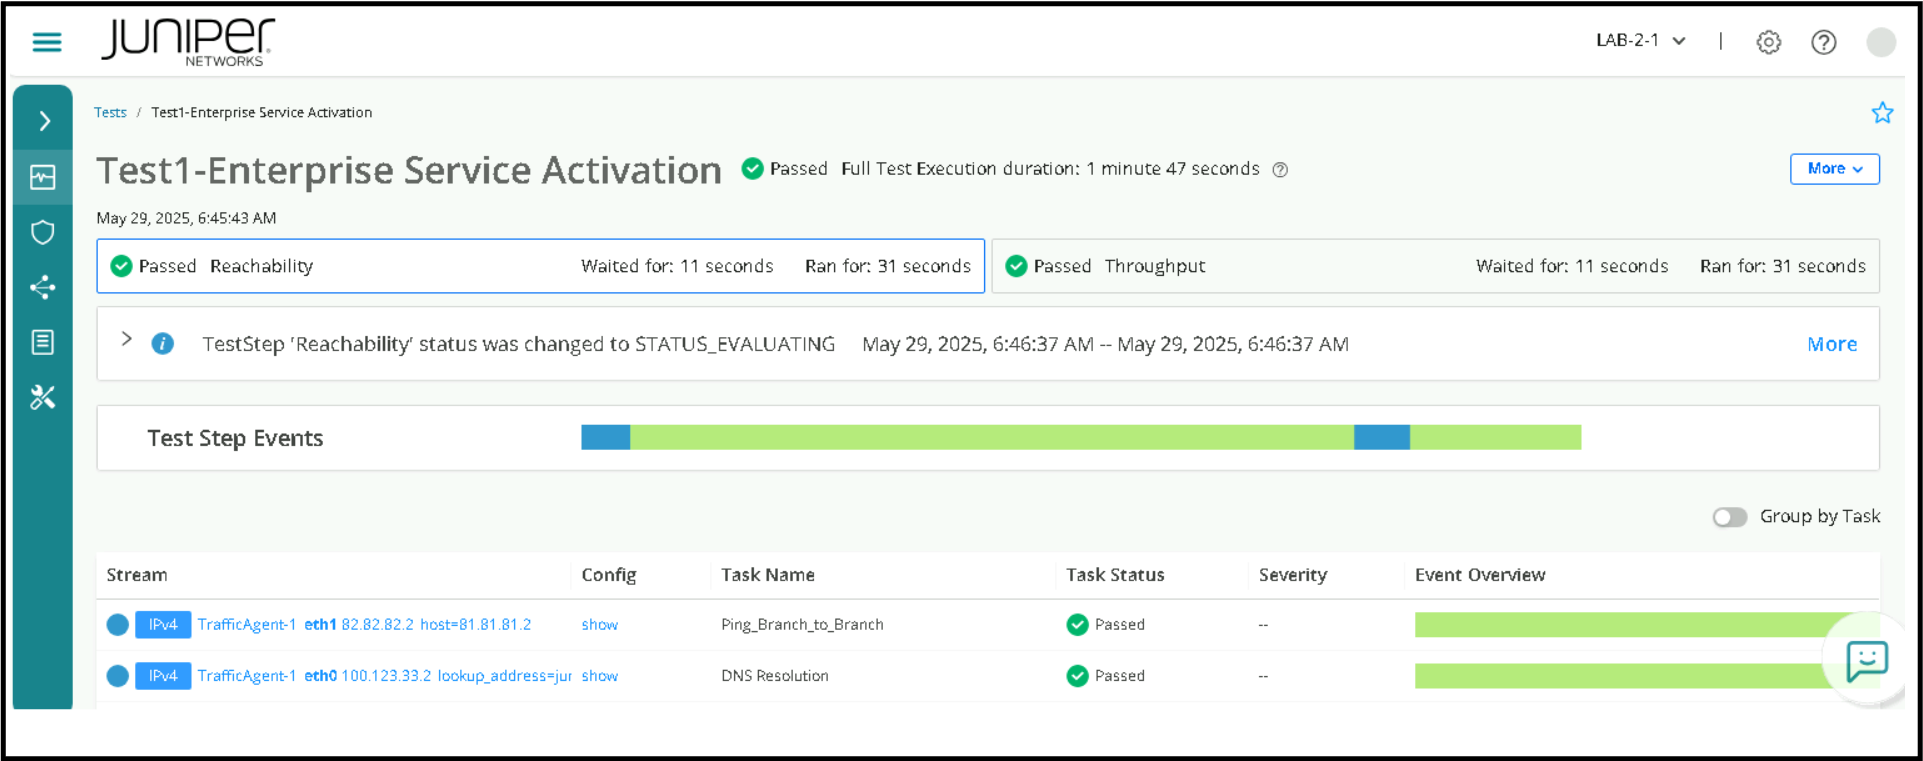
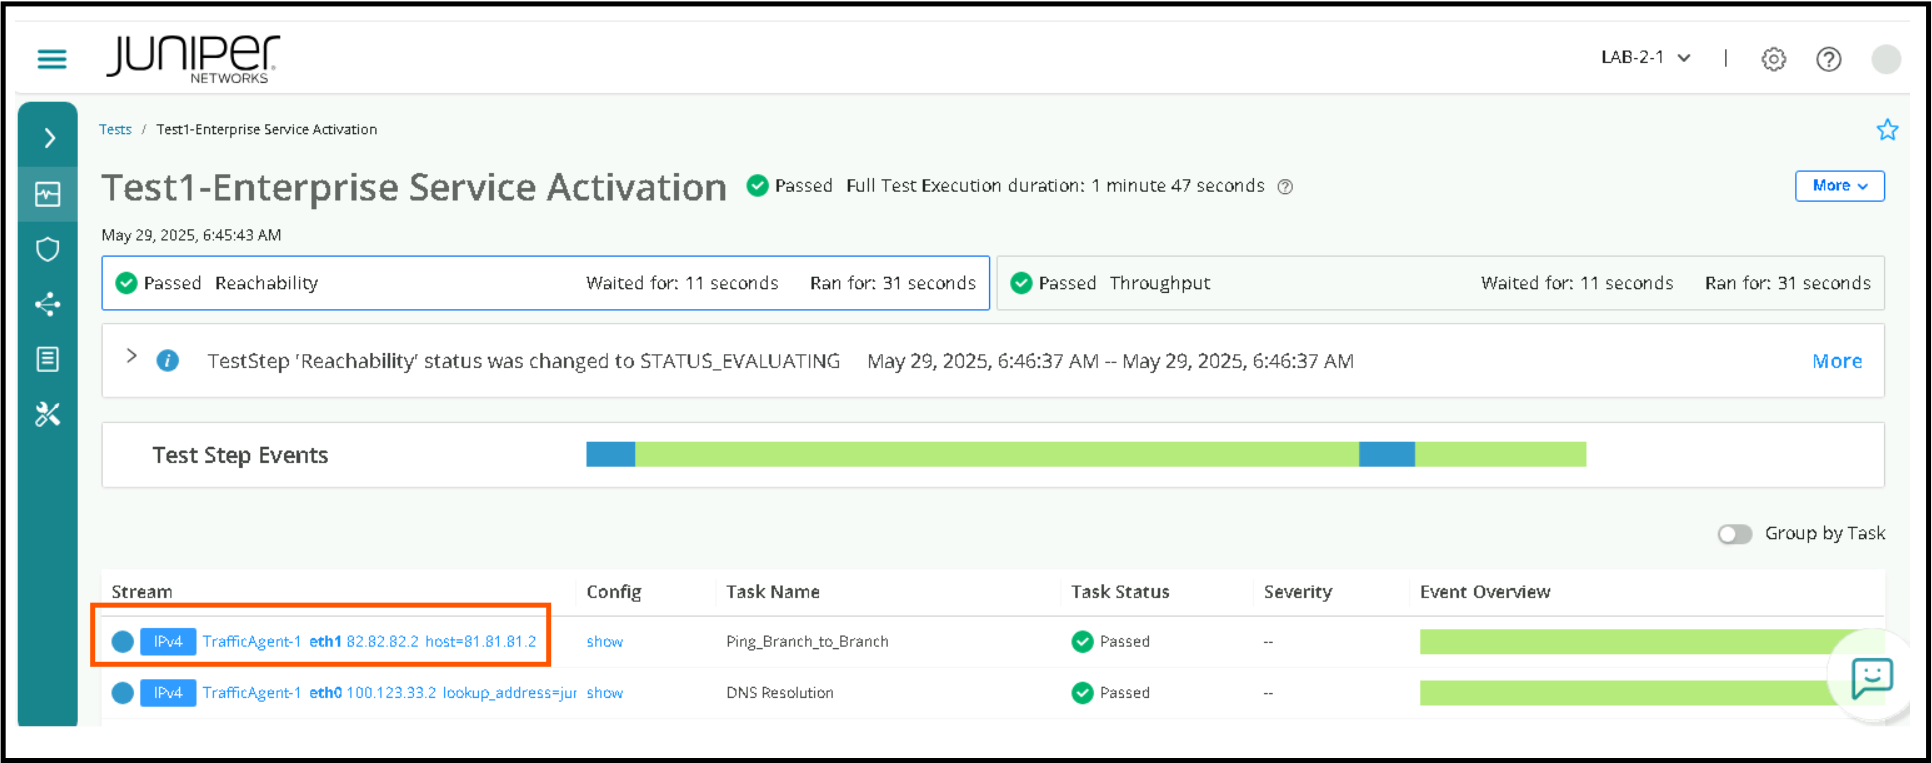
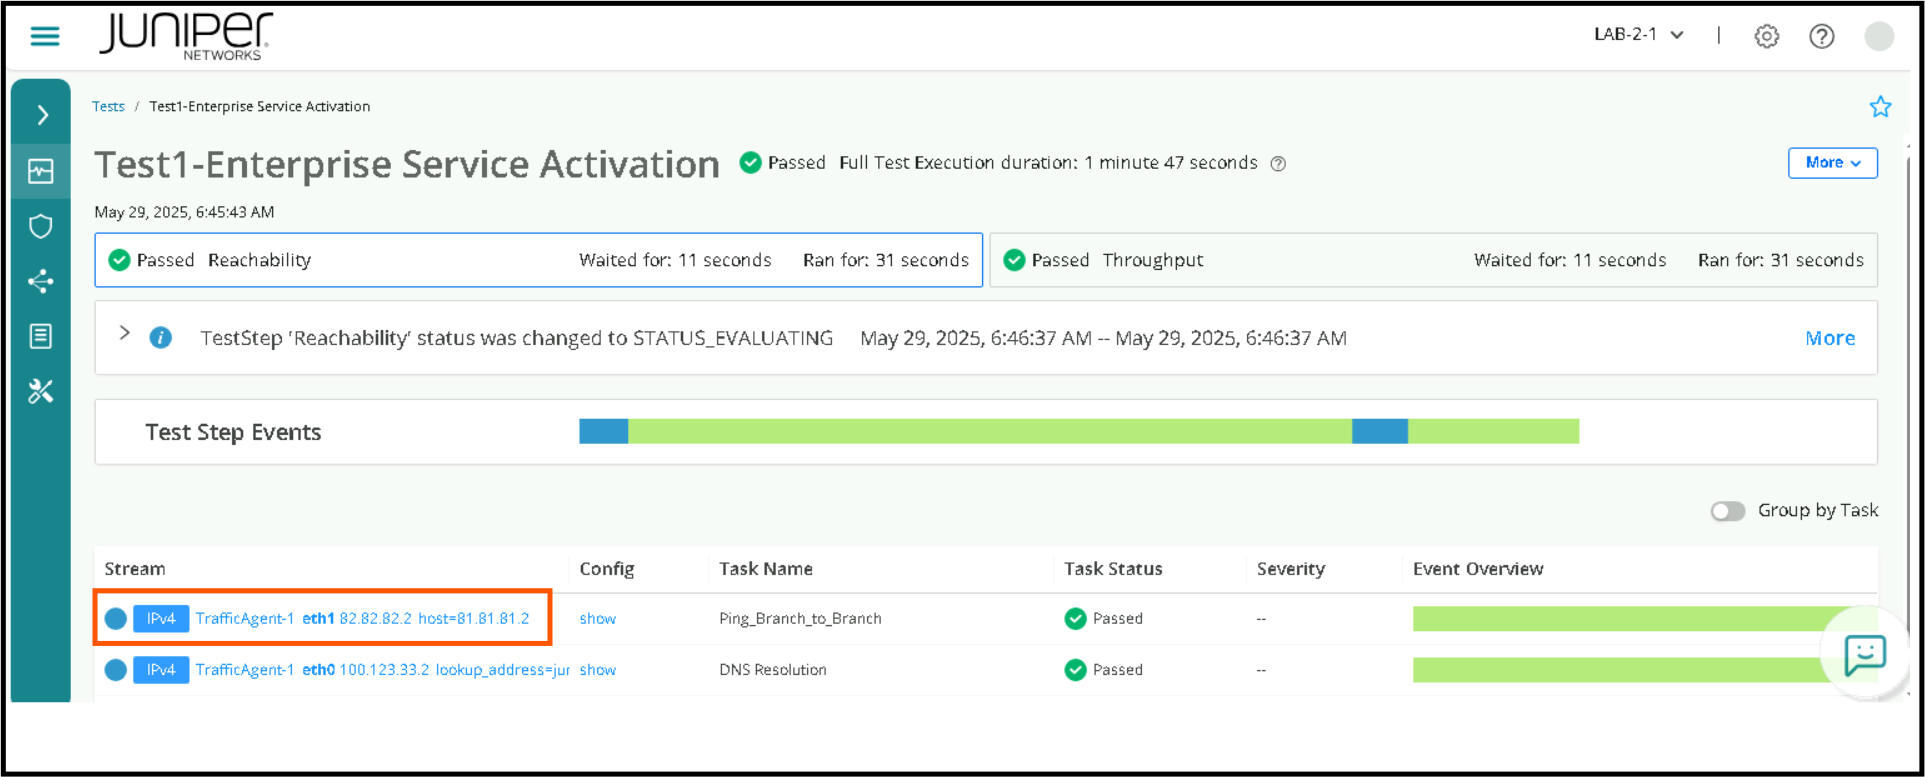
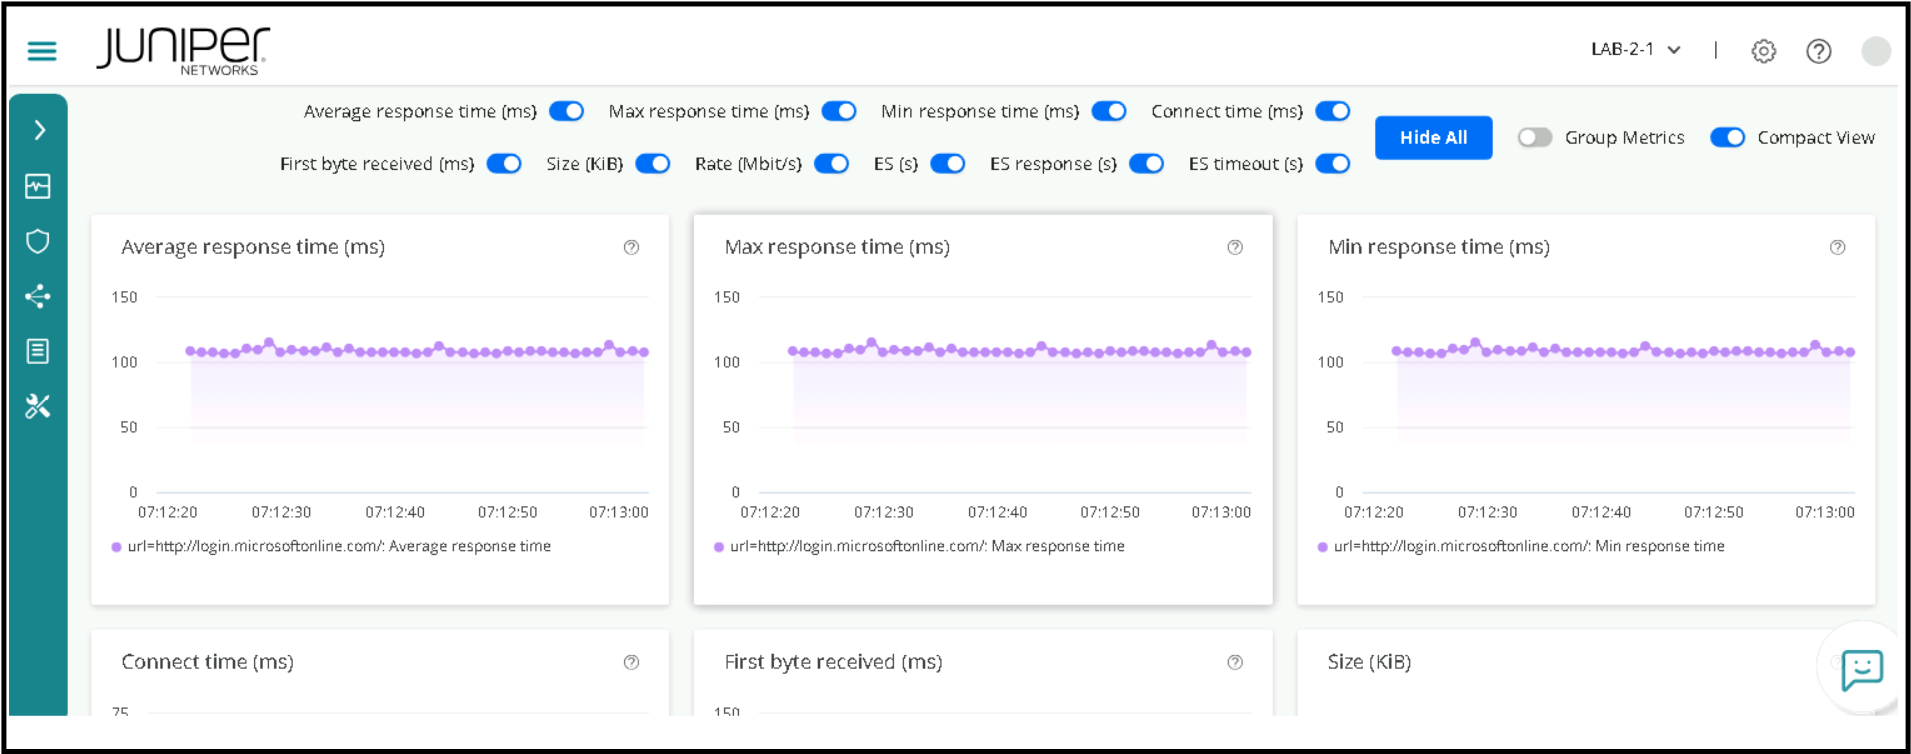
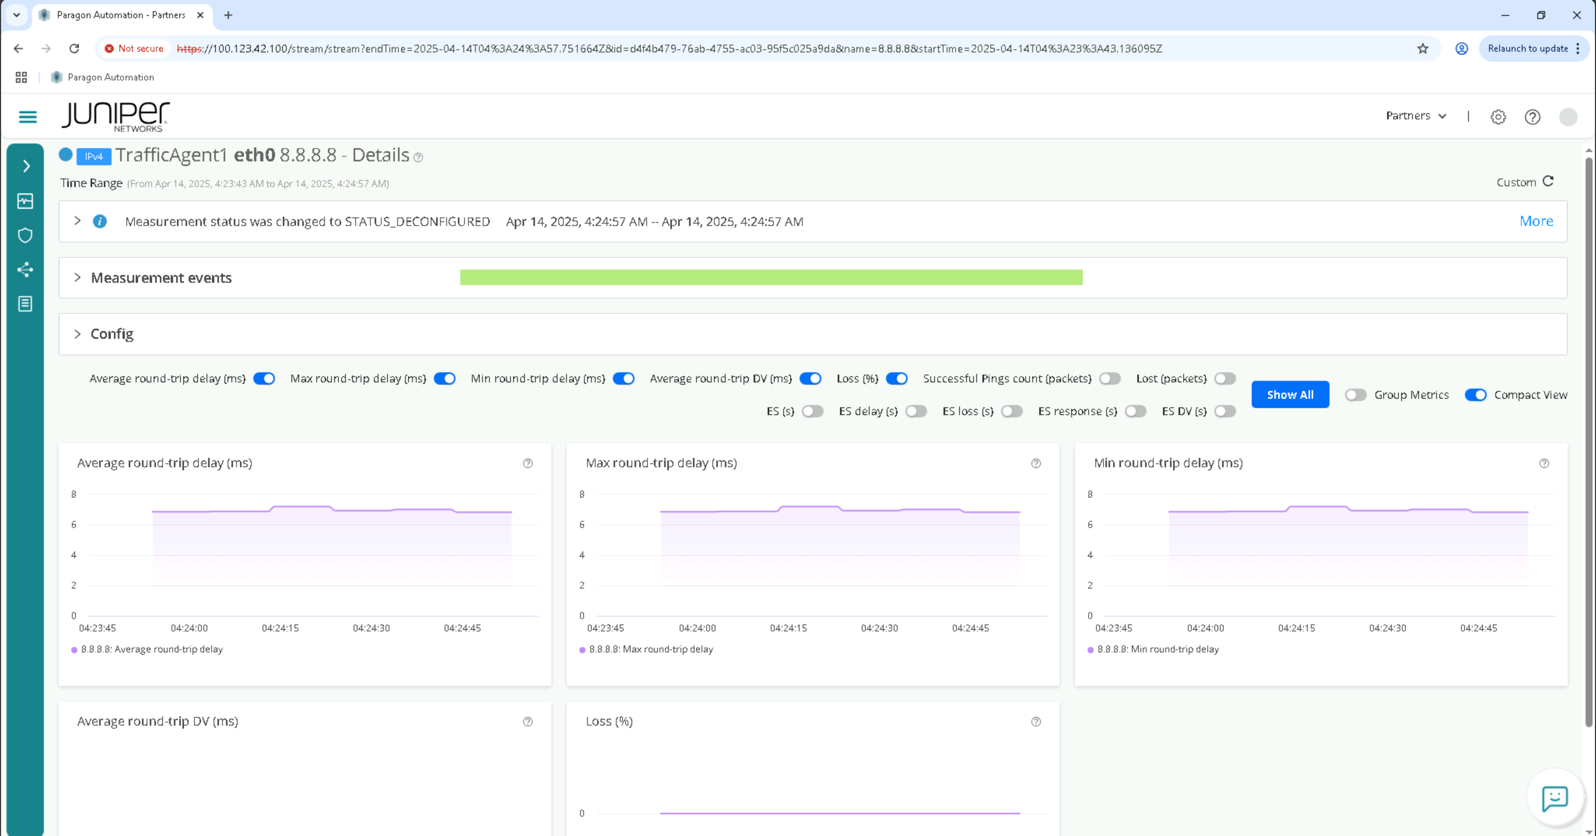
Once all the tests are completed, we can check the Task Status to see whether the tests are Passed or Failed . KPI’s can be visualized by clicking on individual Streams as below.
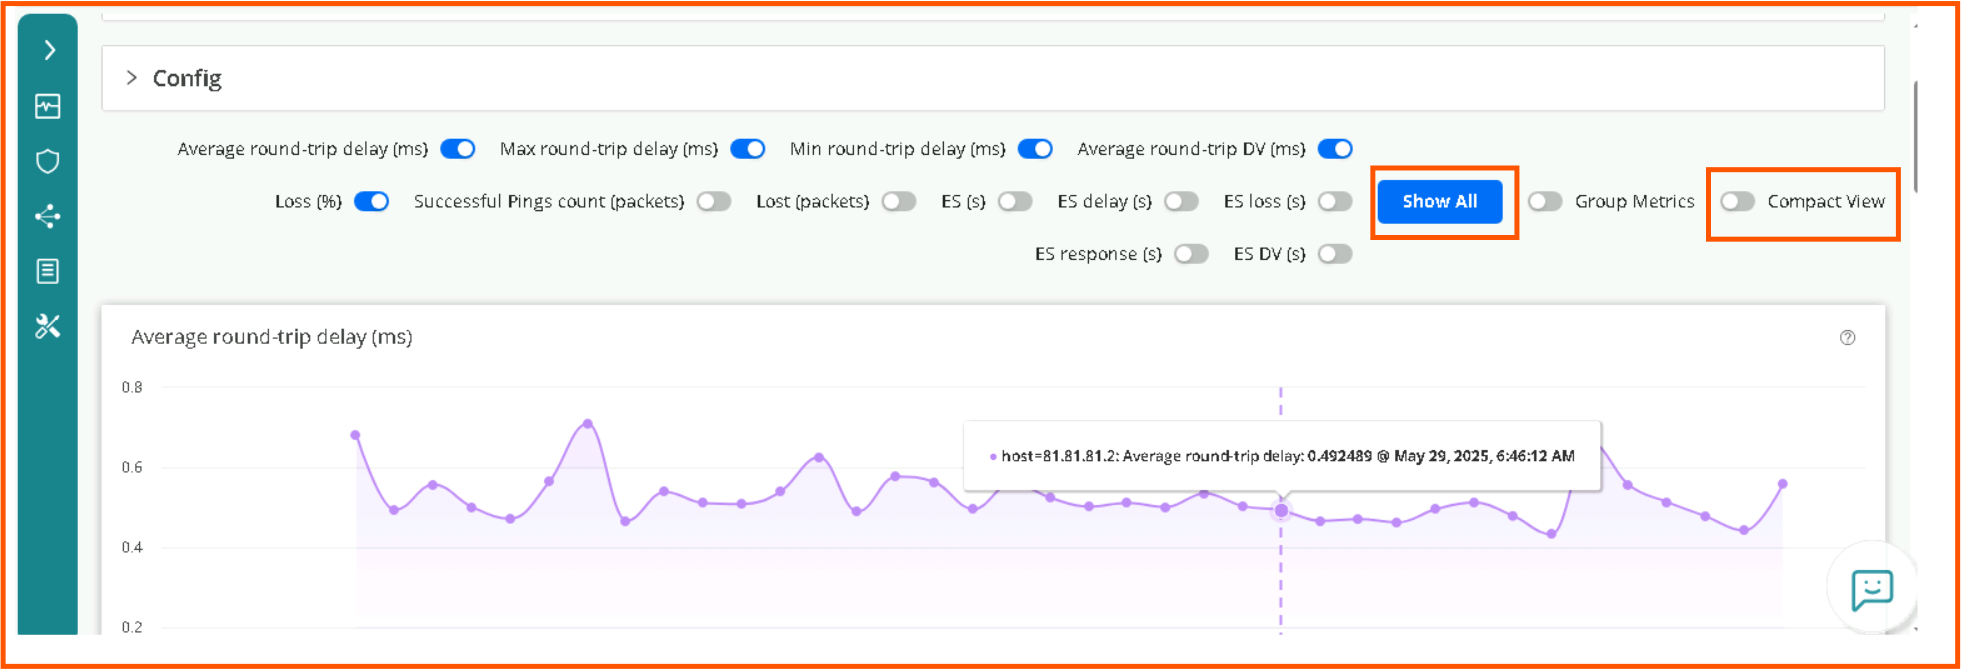
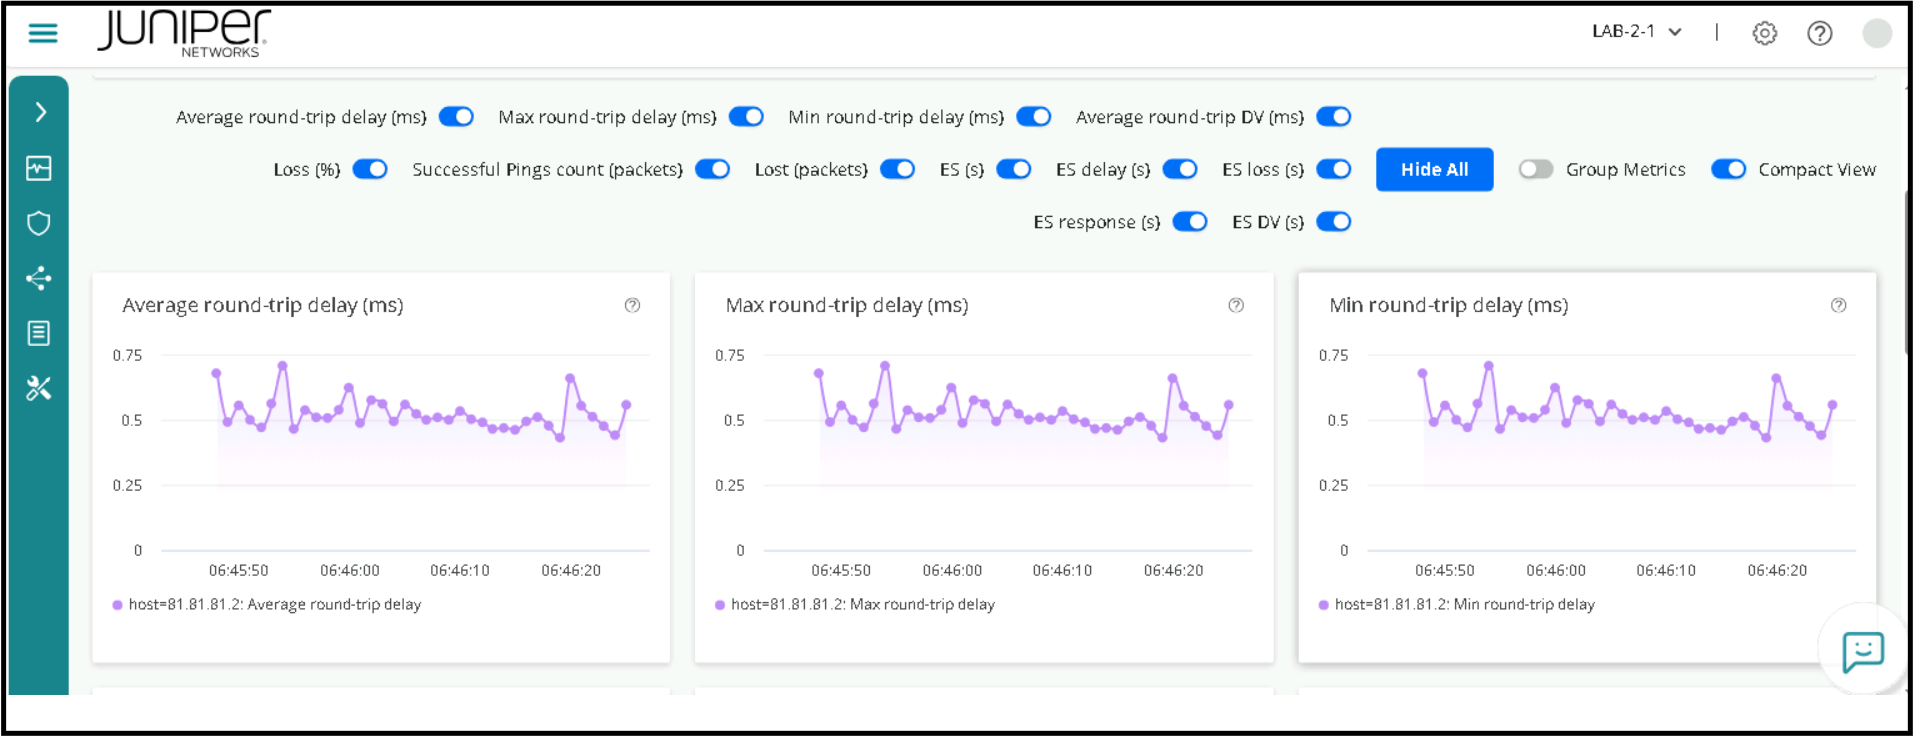
Visualization of KPI’s can be optimized by clicking on both Show All , Compact View as below
You can also go to Tests page and check the Status of a particular Test.
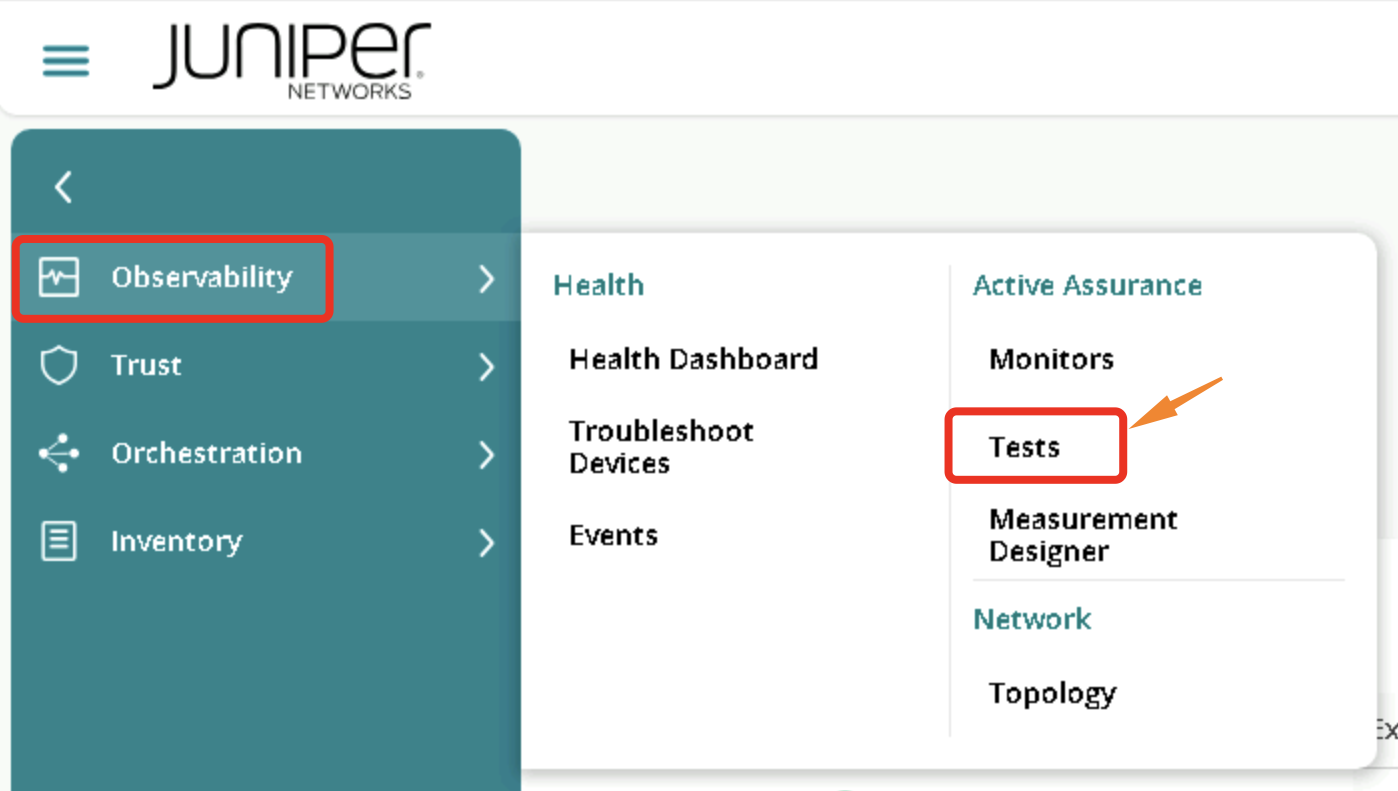
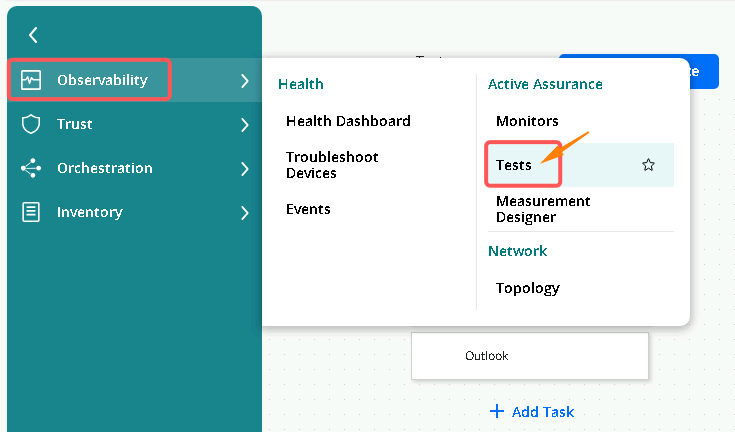
Click on Observability > Tests
Click on Test 1 – Enterprise Service Activation
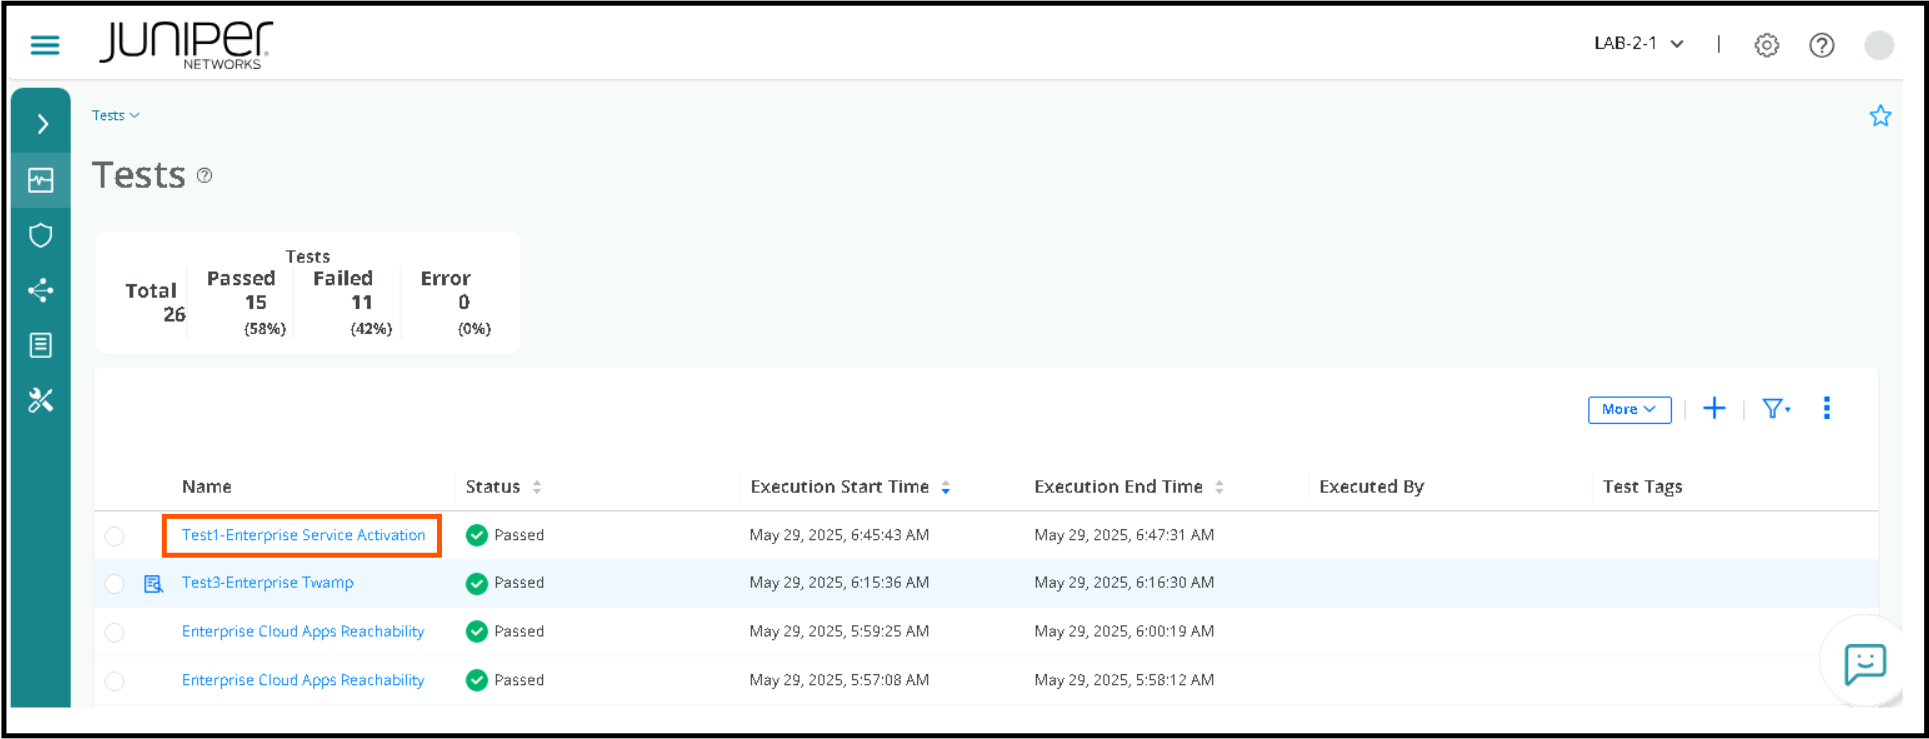
To check more details of any test.
Click on a particular Stream > then Enable Show All, Compact View
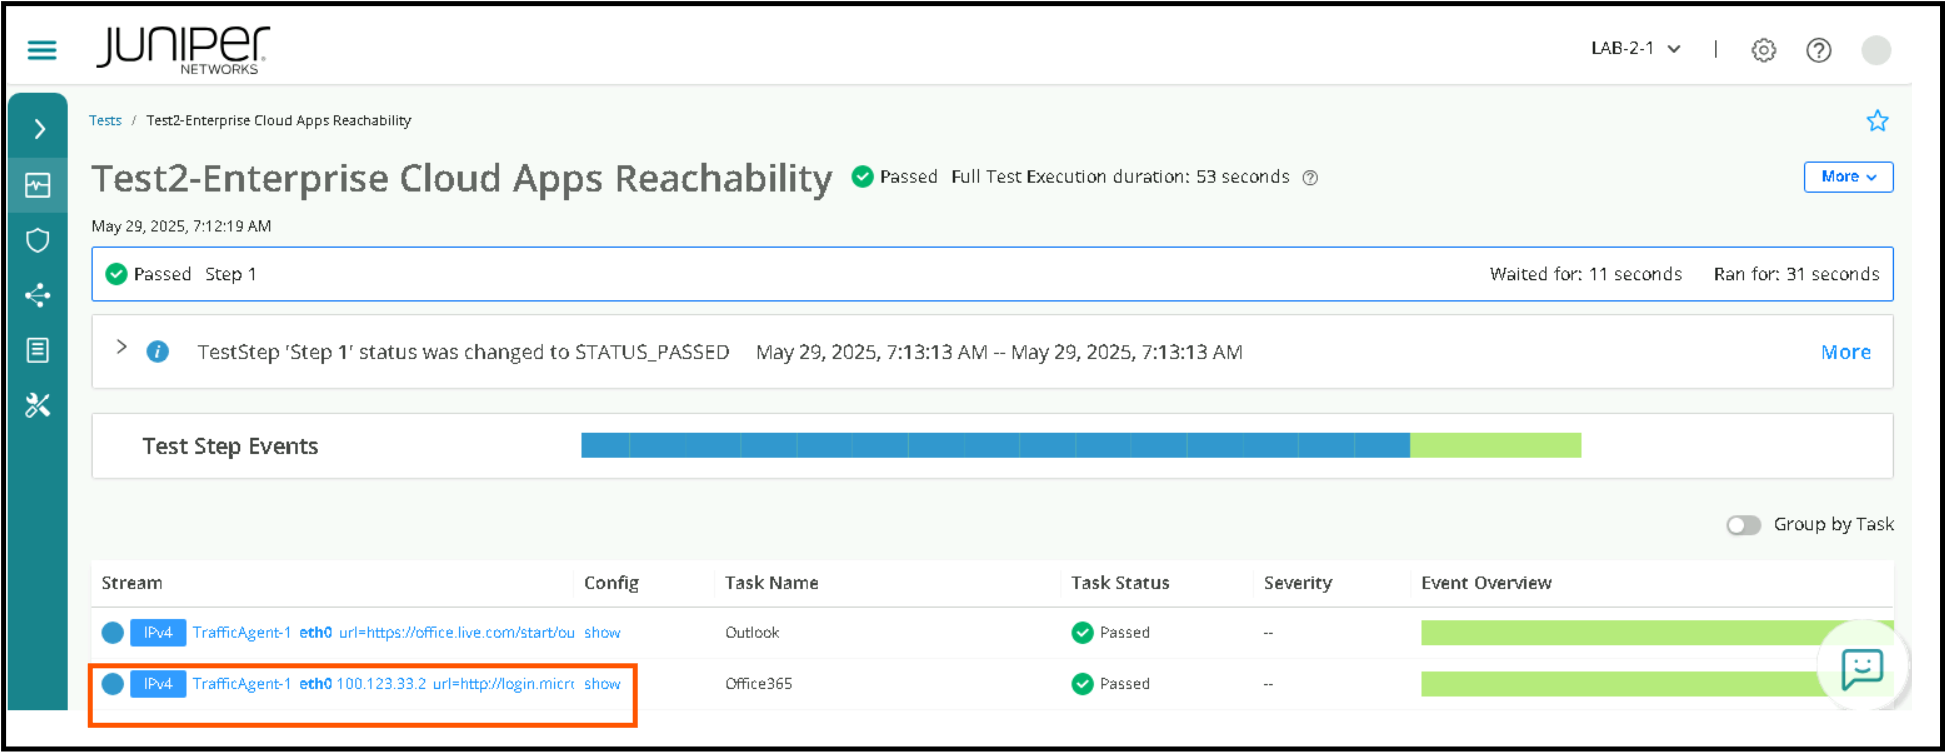
Test2 - Cloud Apps Reachability
Once we are assured that the lower layers of the network are working, we want to test application connectivity, there could be firewalls preventing access to application, maybe misconfigs. So Test2 is for checking applications like office365, outlook etc.
Navigate to Inventory > Test Templates
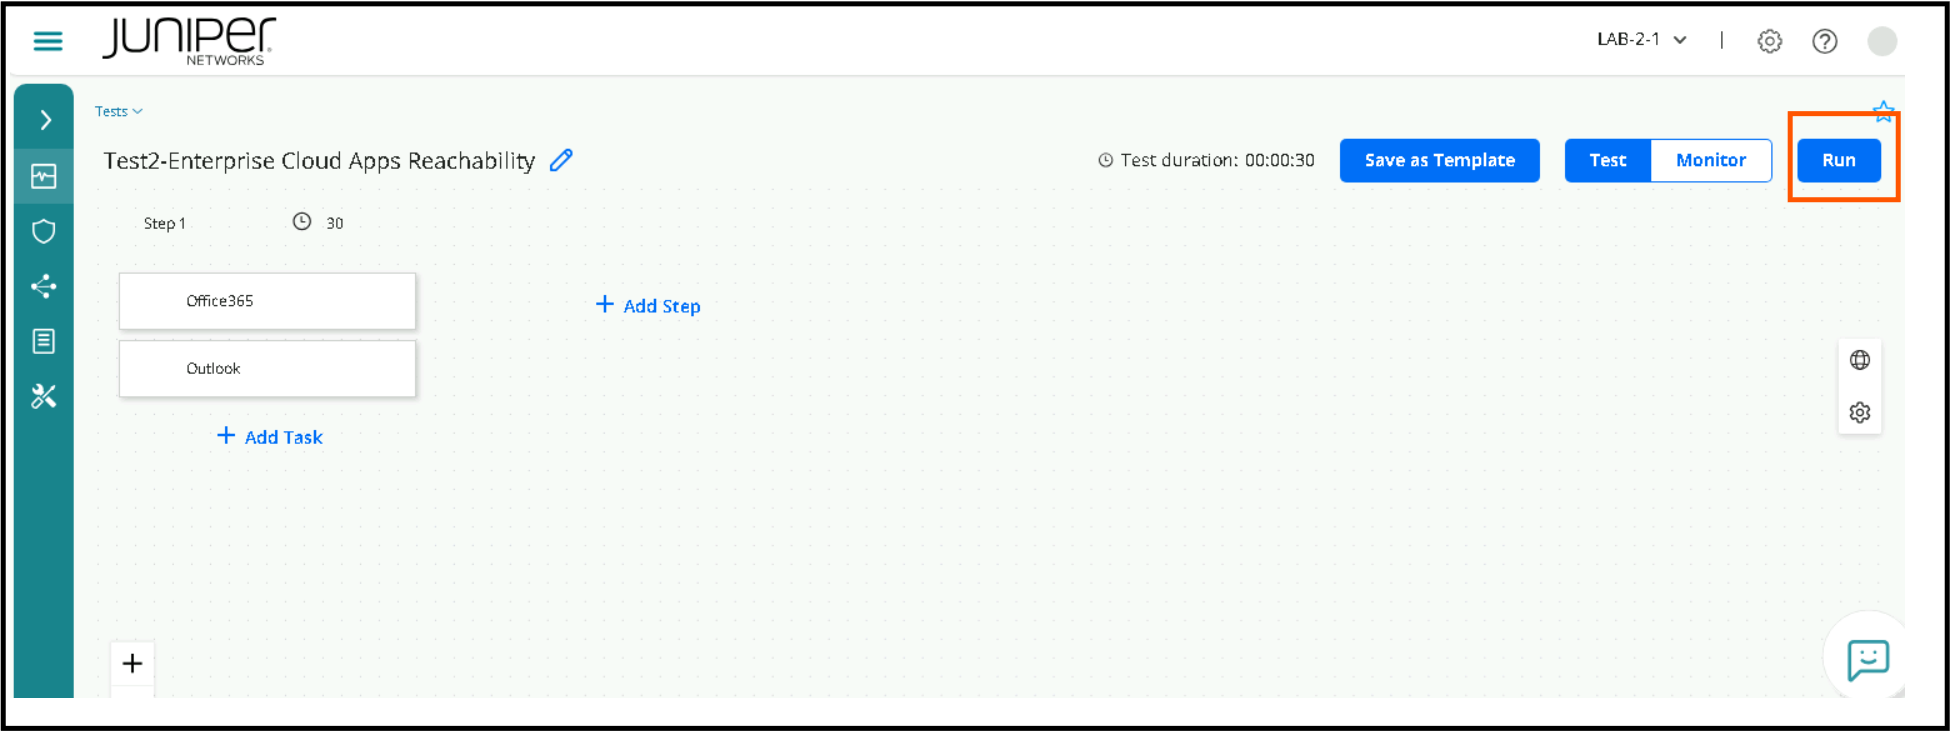
Click on Test 2 – Cloud Apps Reachability / Access
Click on Run to execute the test.
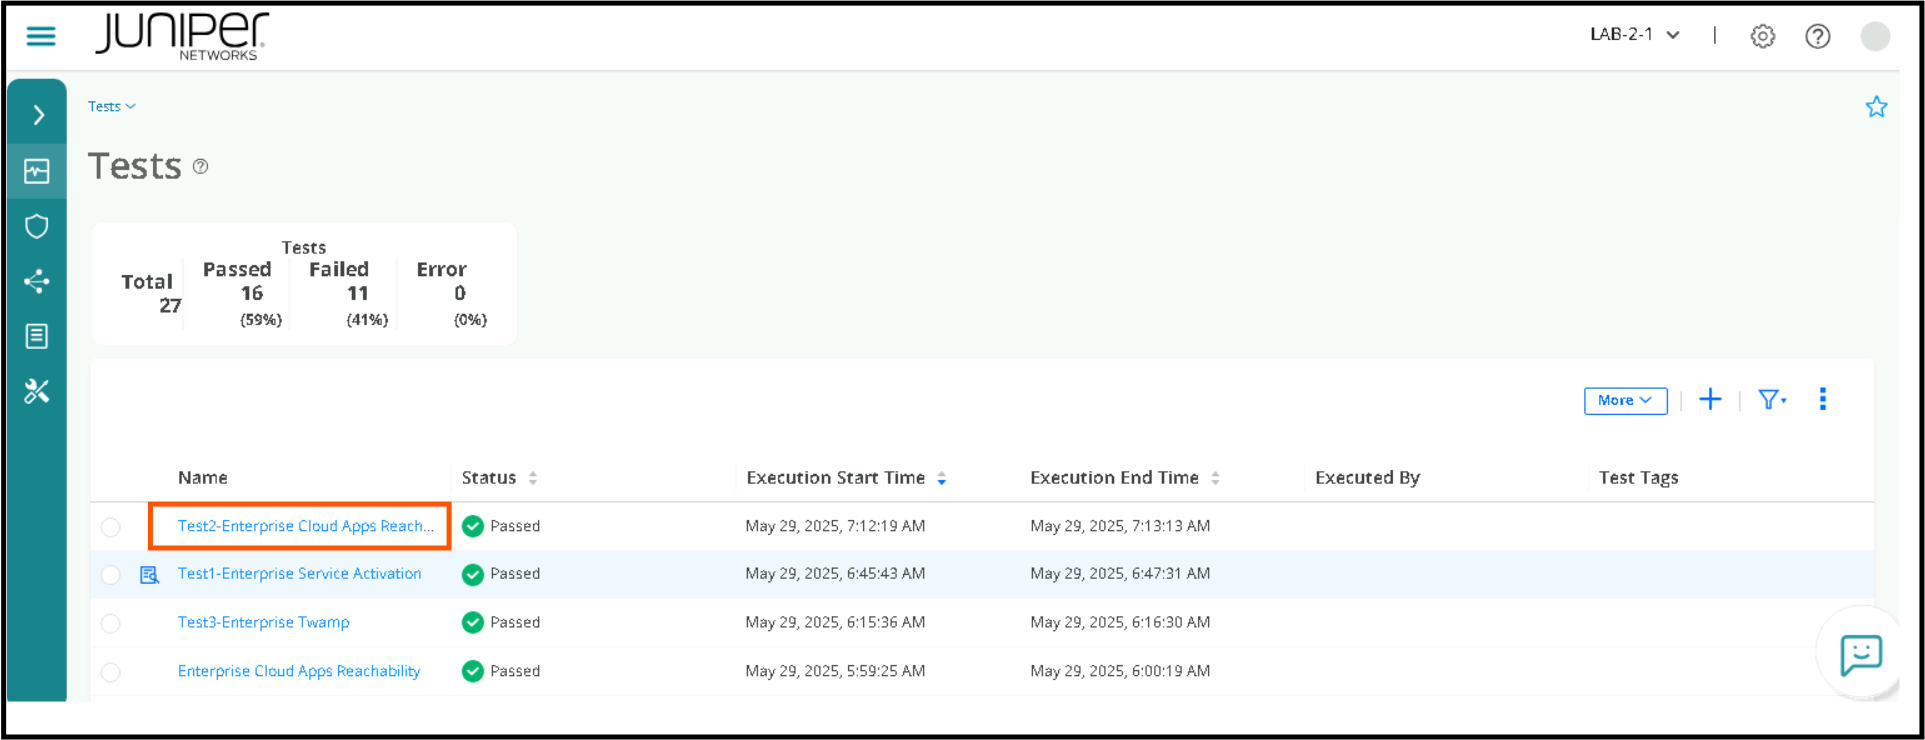
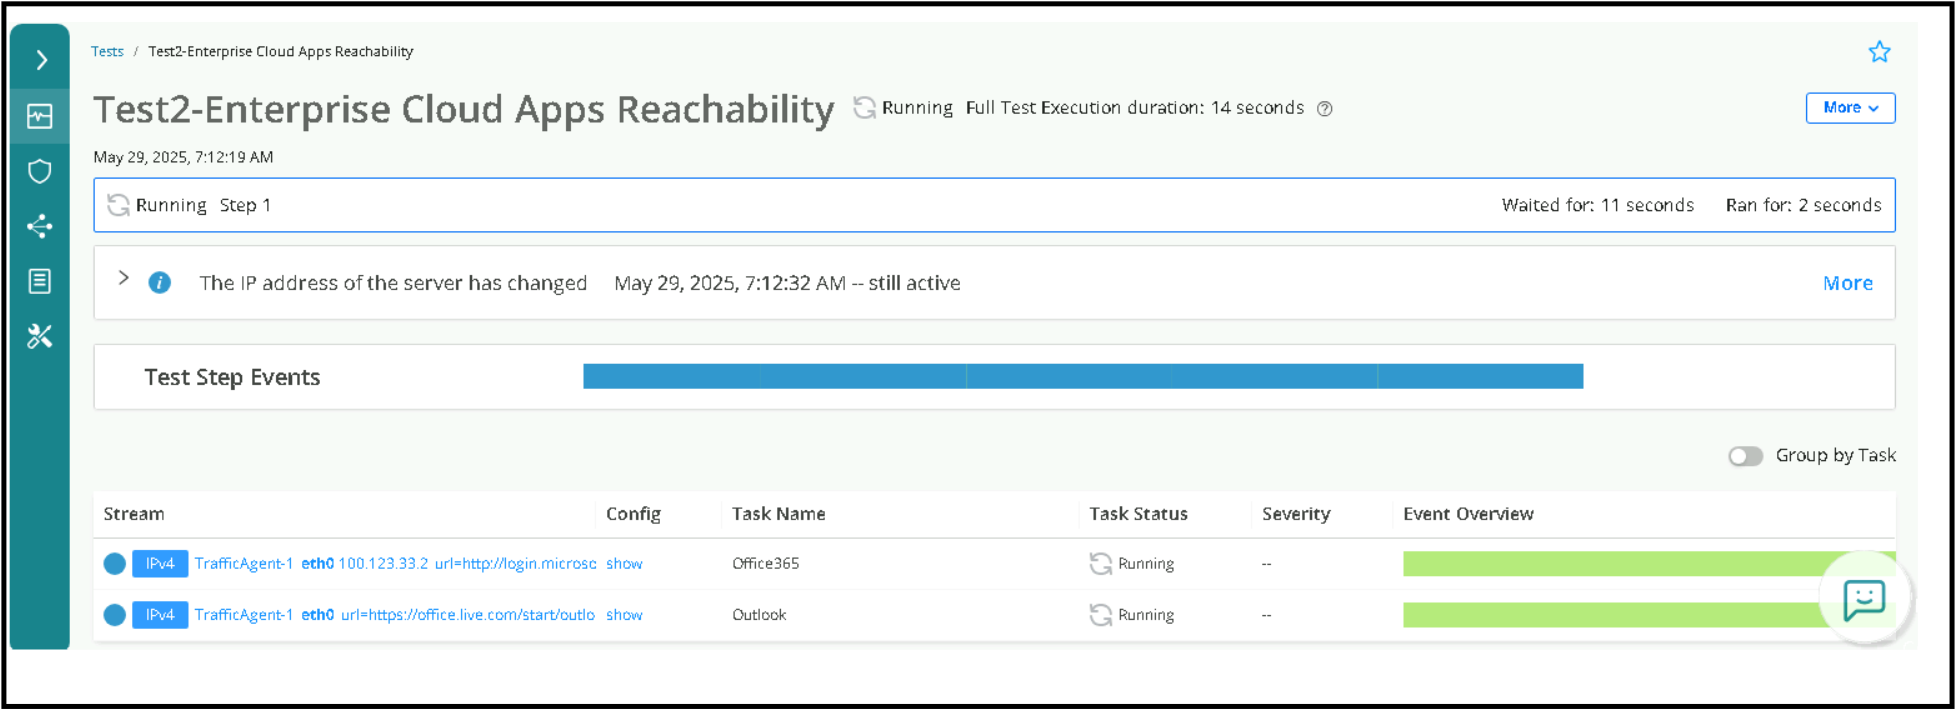
Go to Tests page to check the Test Status. Click on the latest Test run, and then click on the relevant stream to view the results.
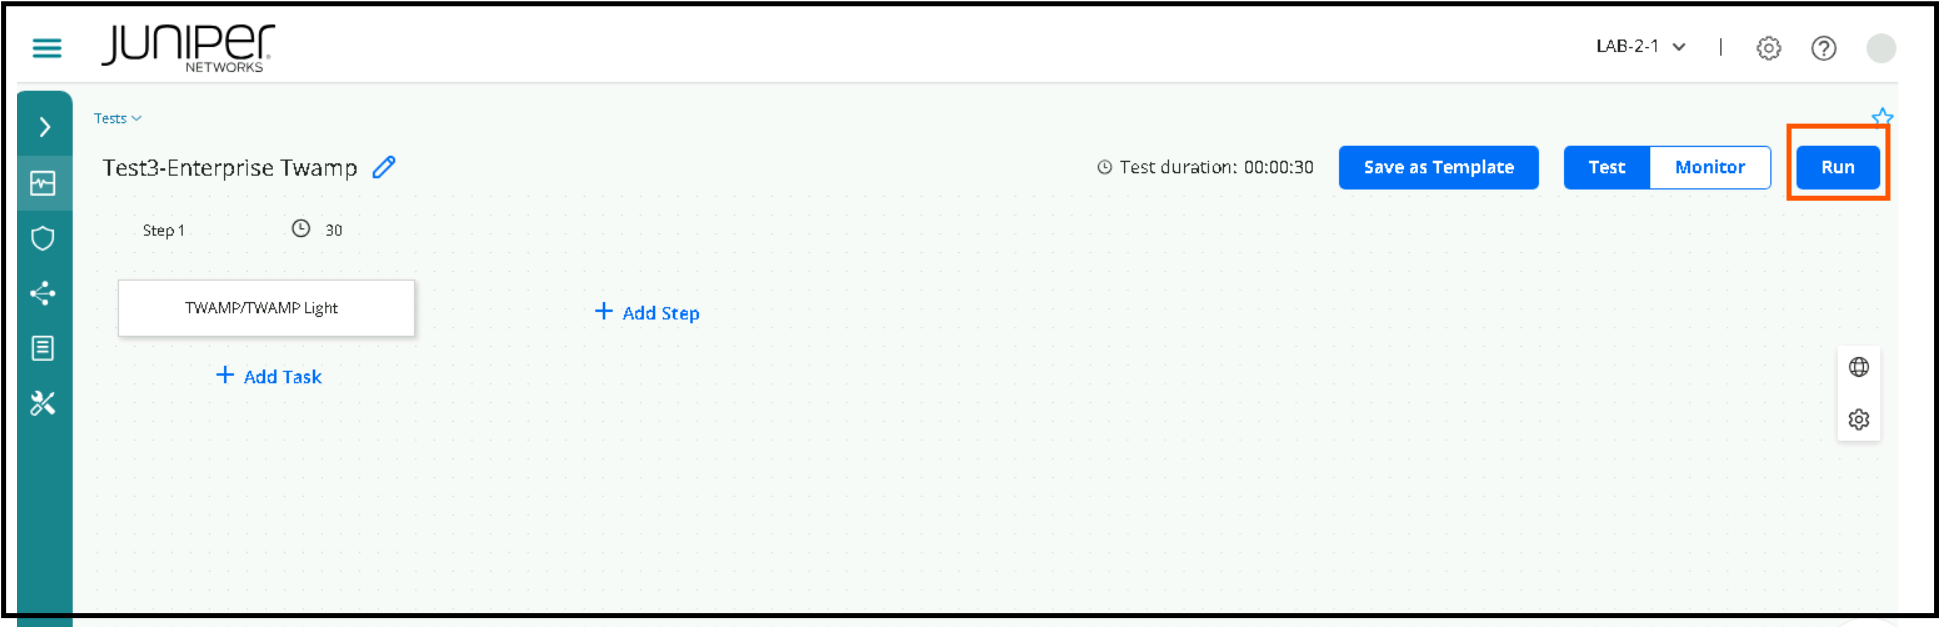
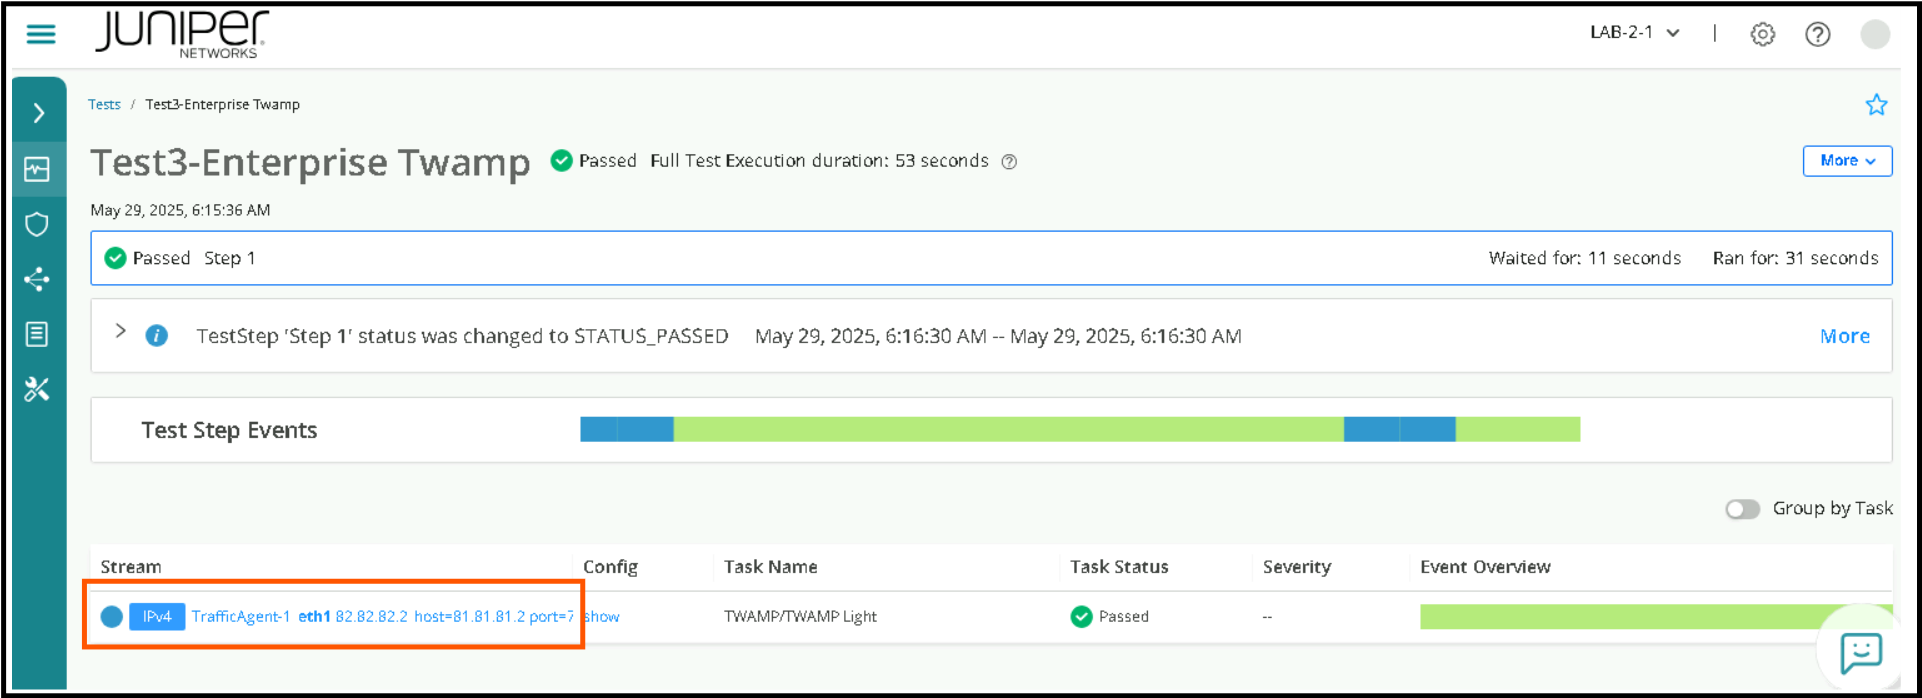
Test 3 - Performance Monitoring TWAMP
Two-Way Active Measurement Protocol
Periodic Synthetic traffic to assure network or service is at optimal level without impact to revenue traffic by observing the KPI’s
Navigate to Inventory > Test Templates
Click on Test 3 – Enterprise TWAMP
Click on Run to execute the test.
Go to Tests page to check the status.
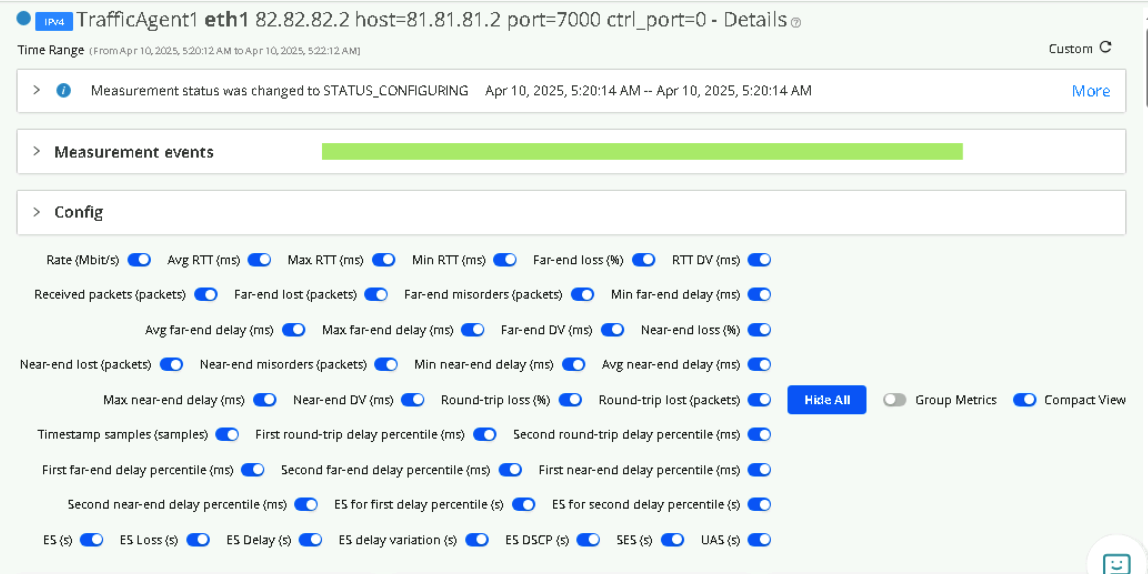
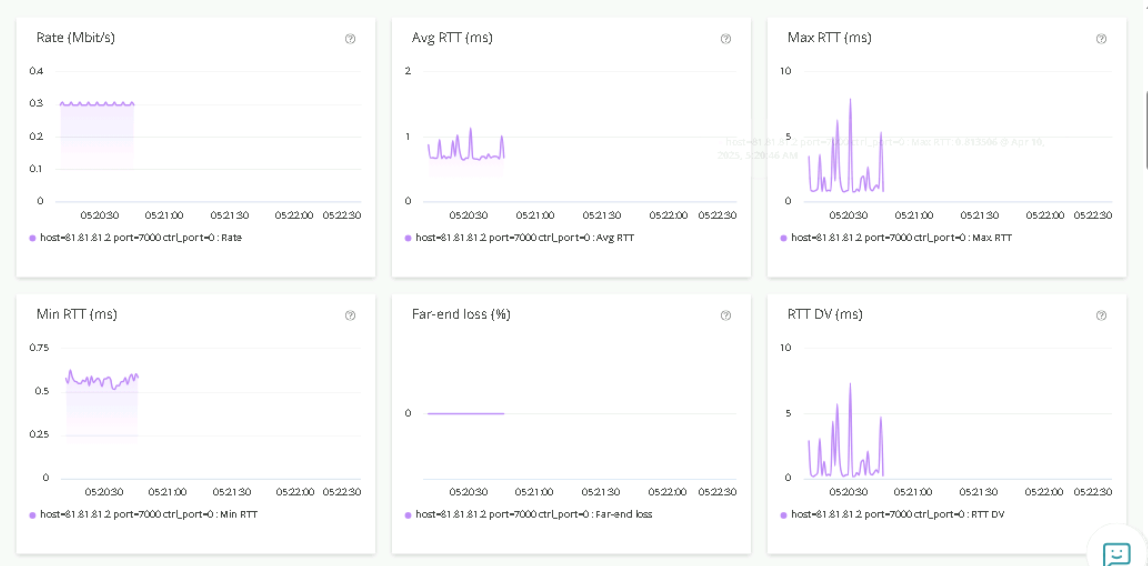
Click on the relevant Stream to get detailed KPI Visualization
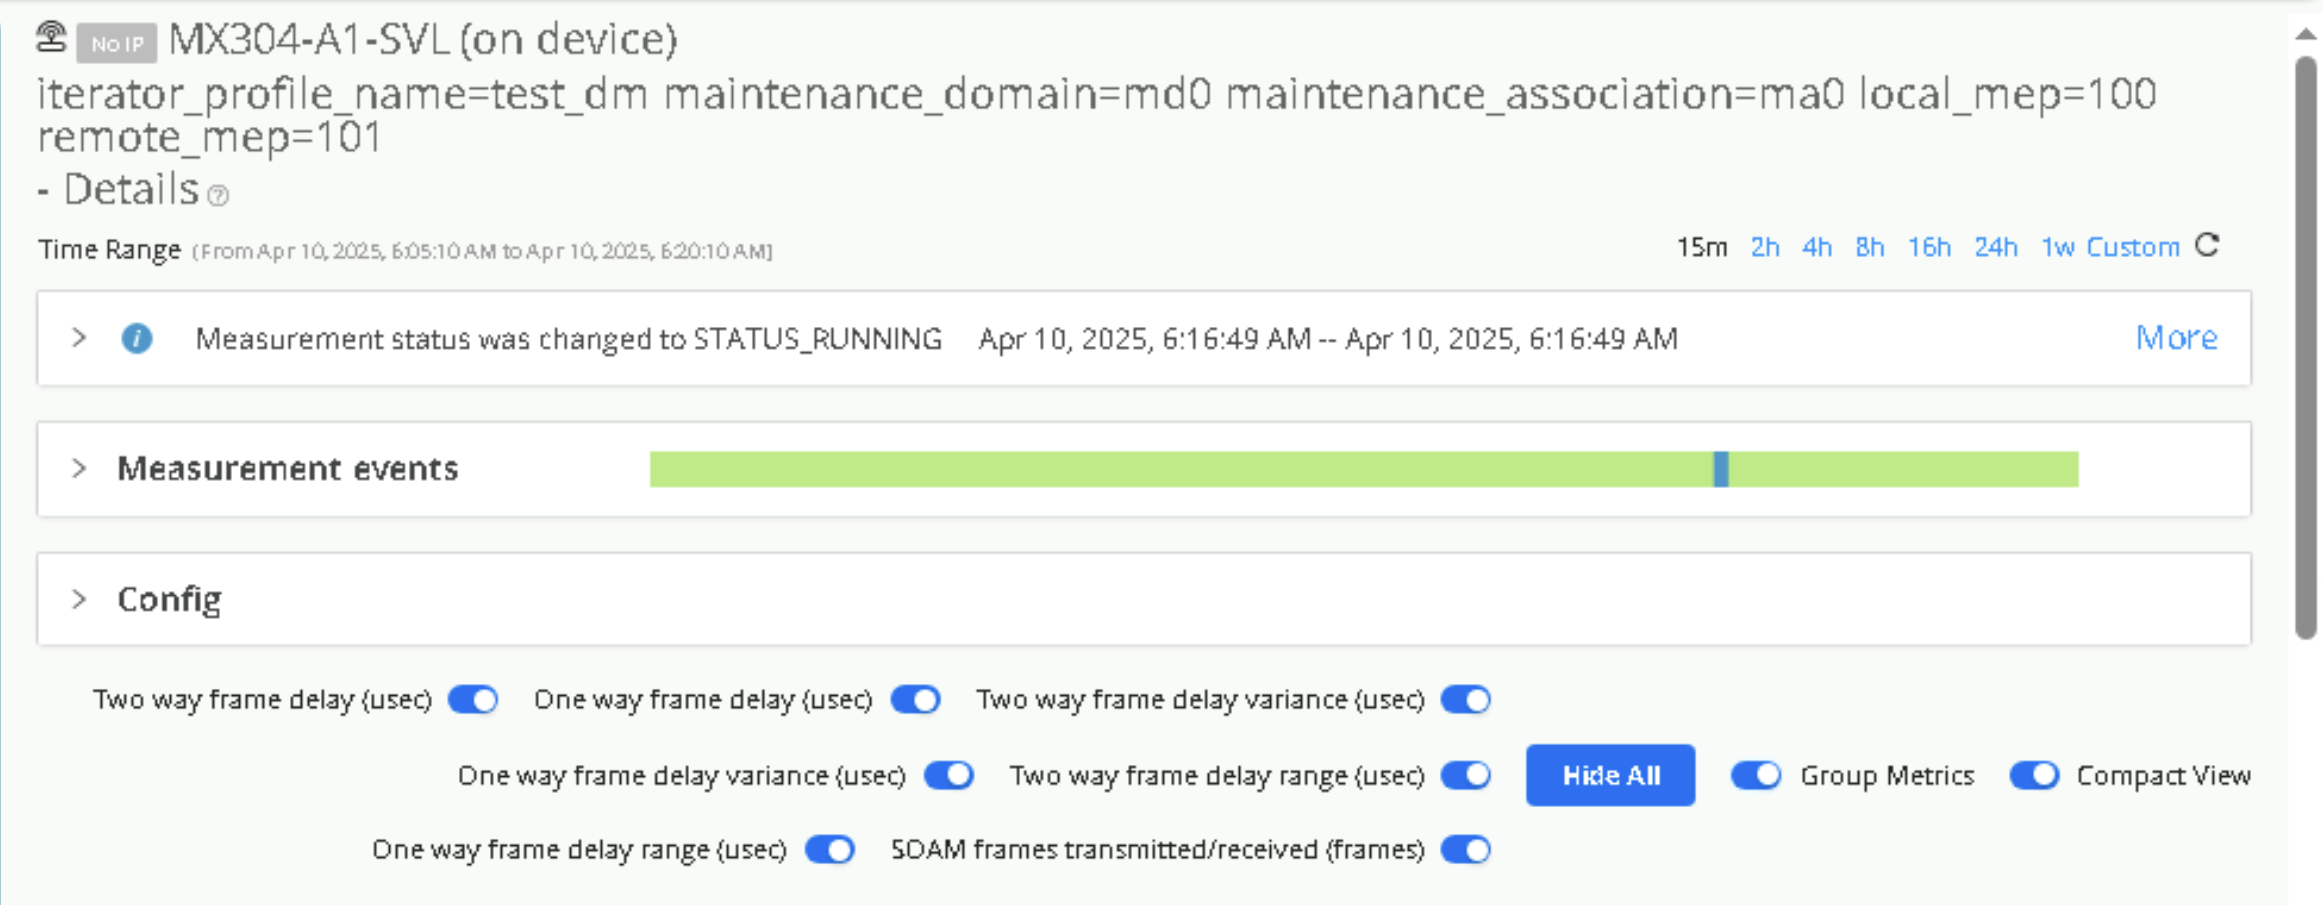
Test 4 - Y1731 Monitor
Periodic Synthetic traffic to assure network or service is at optimal level without impact to revenue traffic by observing the KPI’s
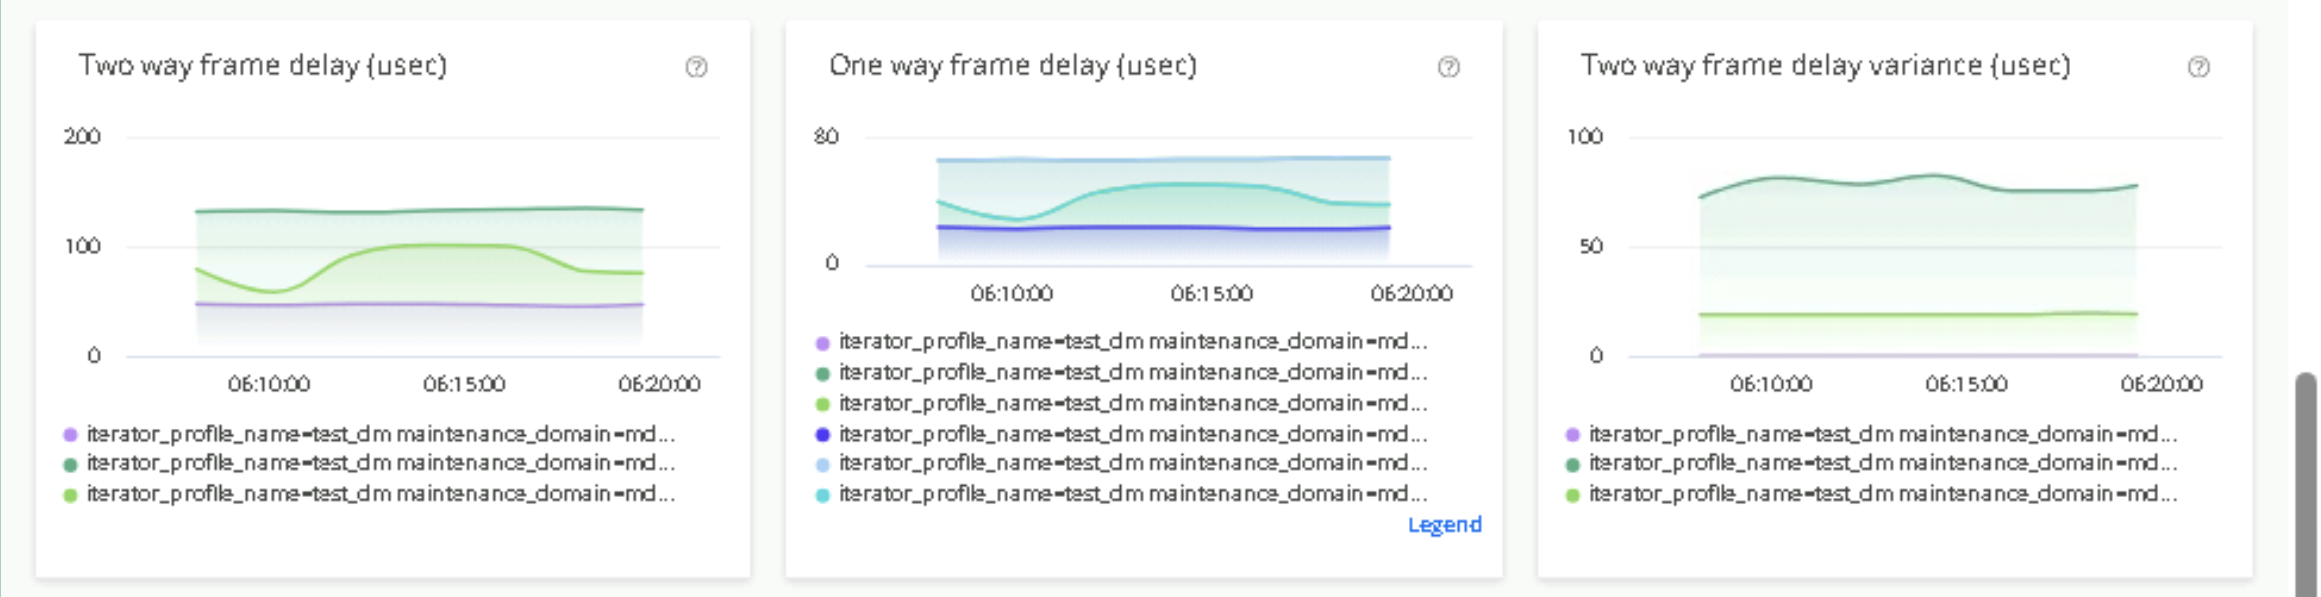
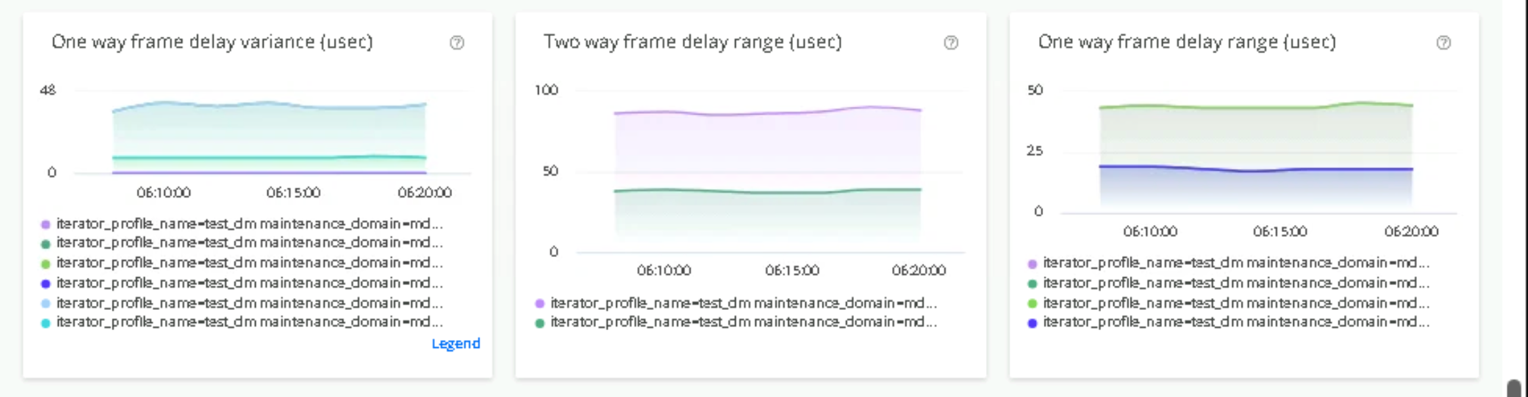
Y1731 Monitoring measures loss, delay, and delay variation (jitter) for traffic from the Test Agent towards a Y.1731-capable device. This is targeted towards L2 domains.
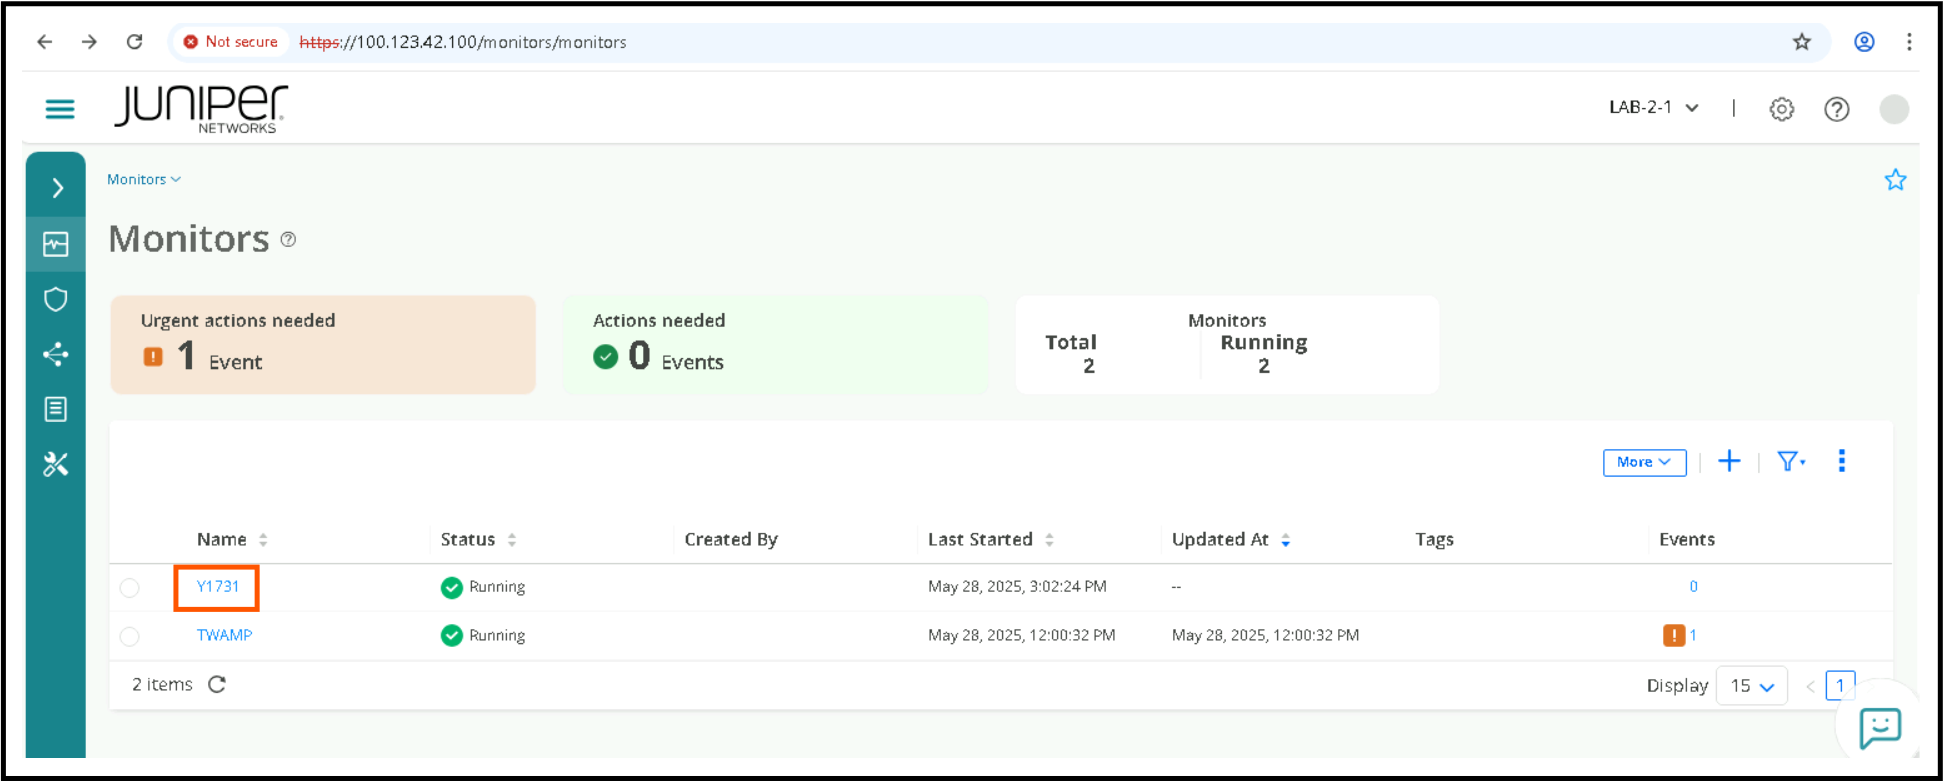
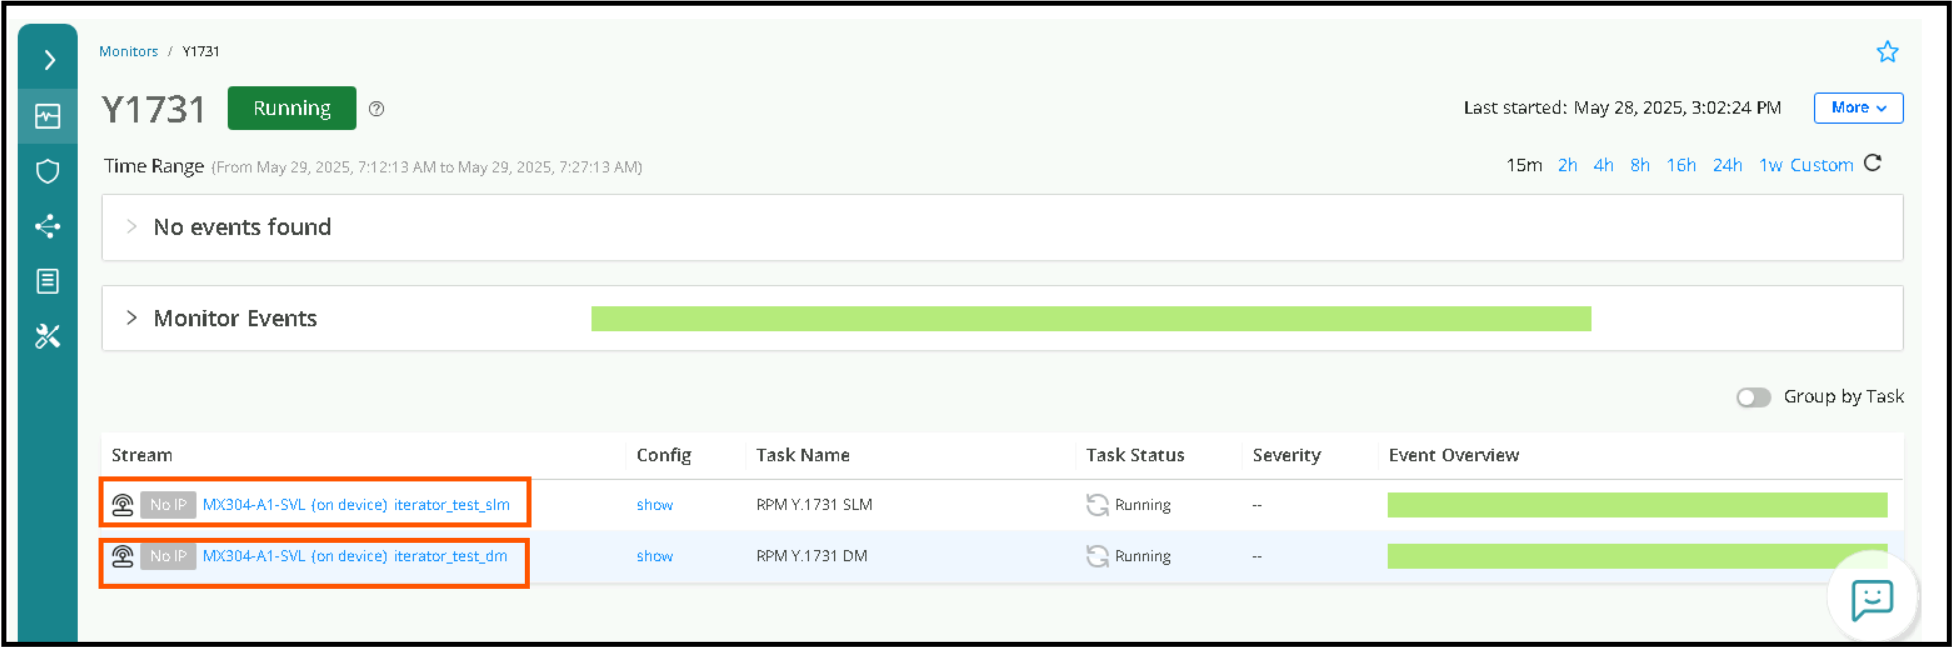
Click on Observability > Monitors
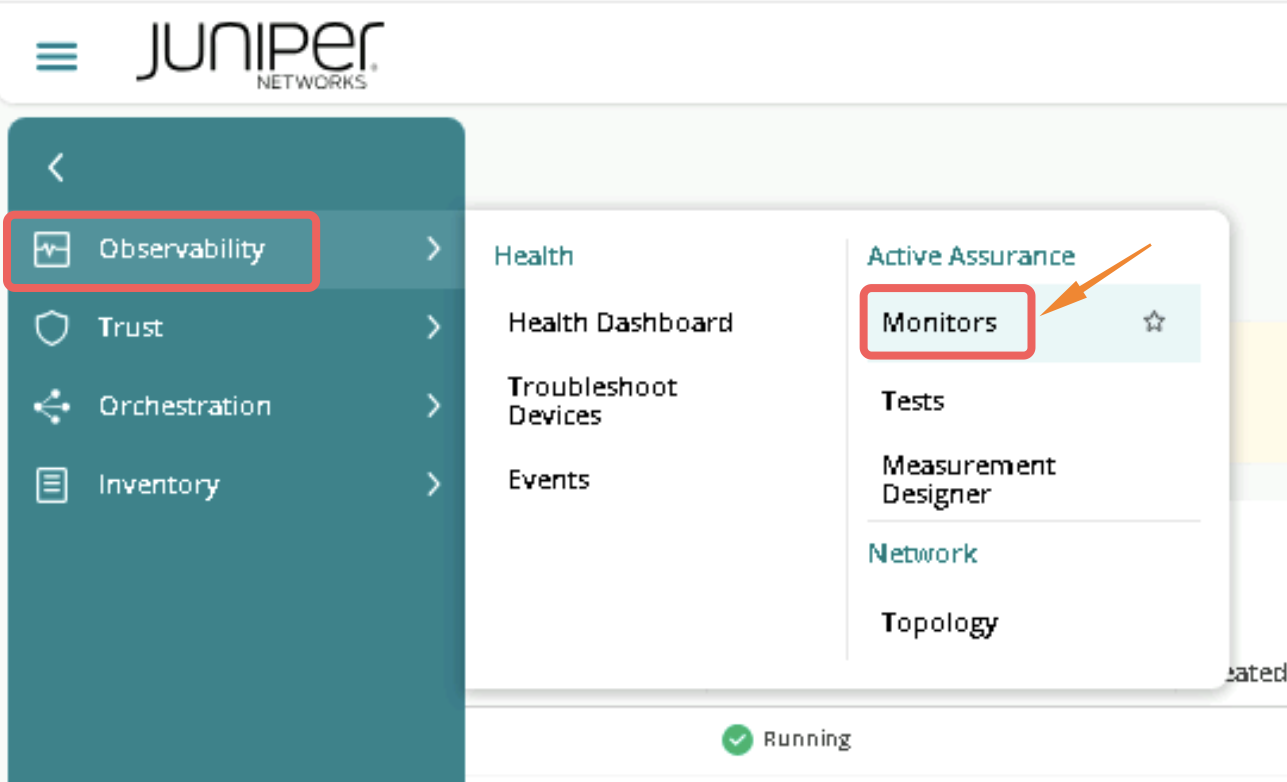
Click on Y1731 , there will be 2 streams, iterator_test_dm for delay measurement, iterator_test_slm for synthetic loss measurement. click each individually to view KPI’s
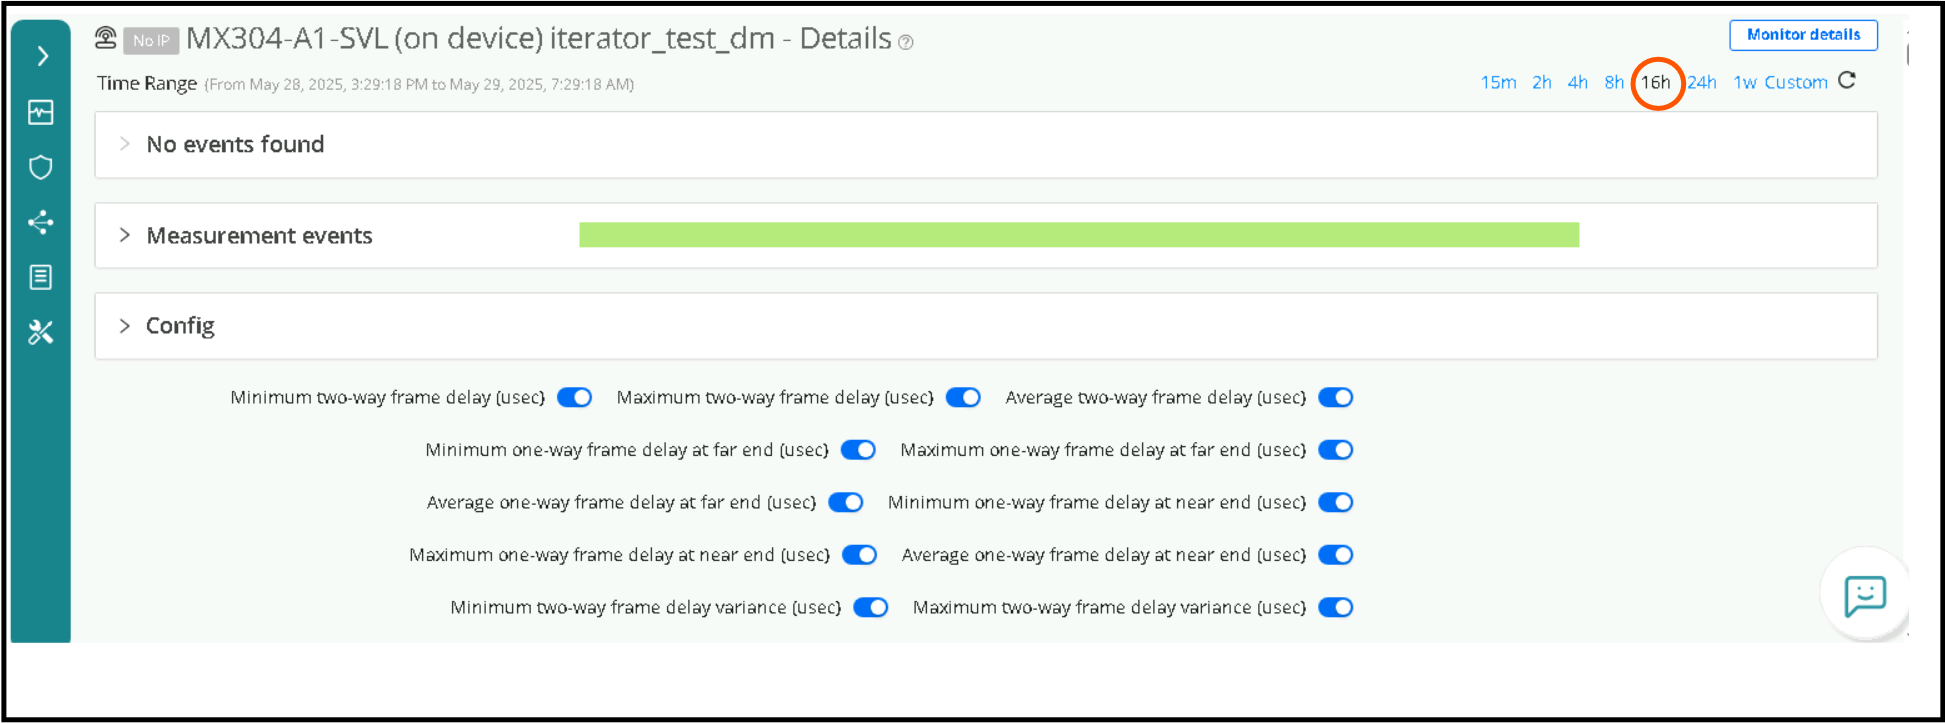
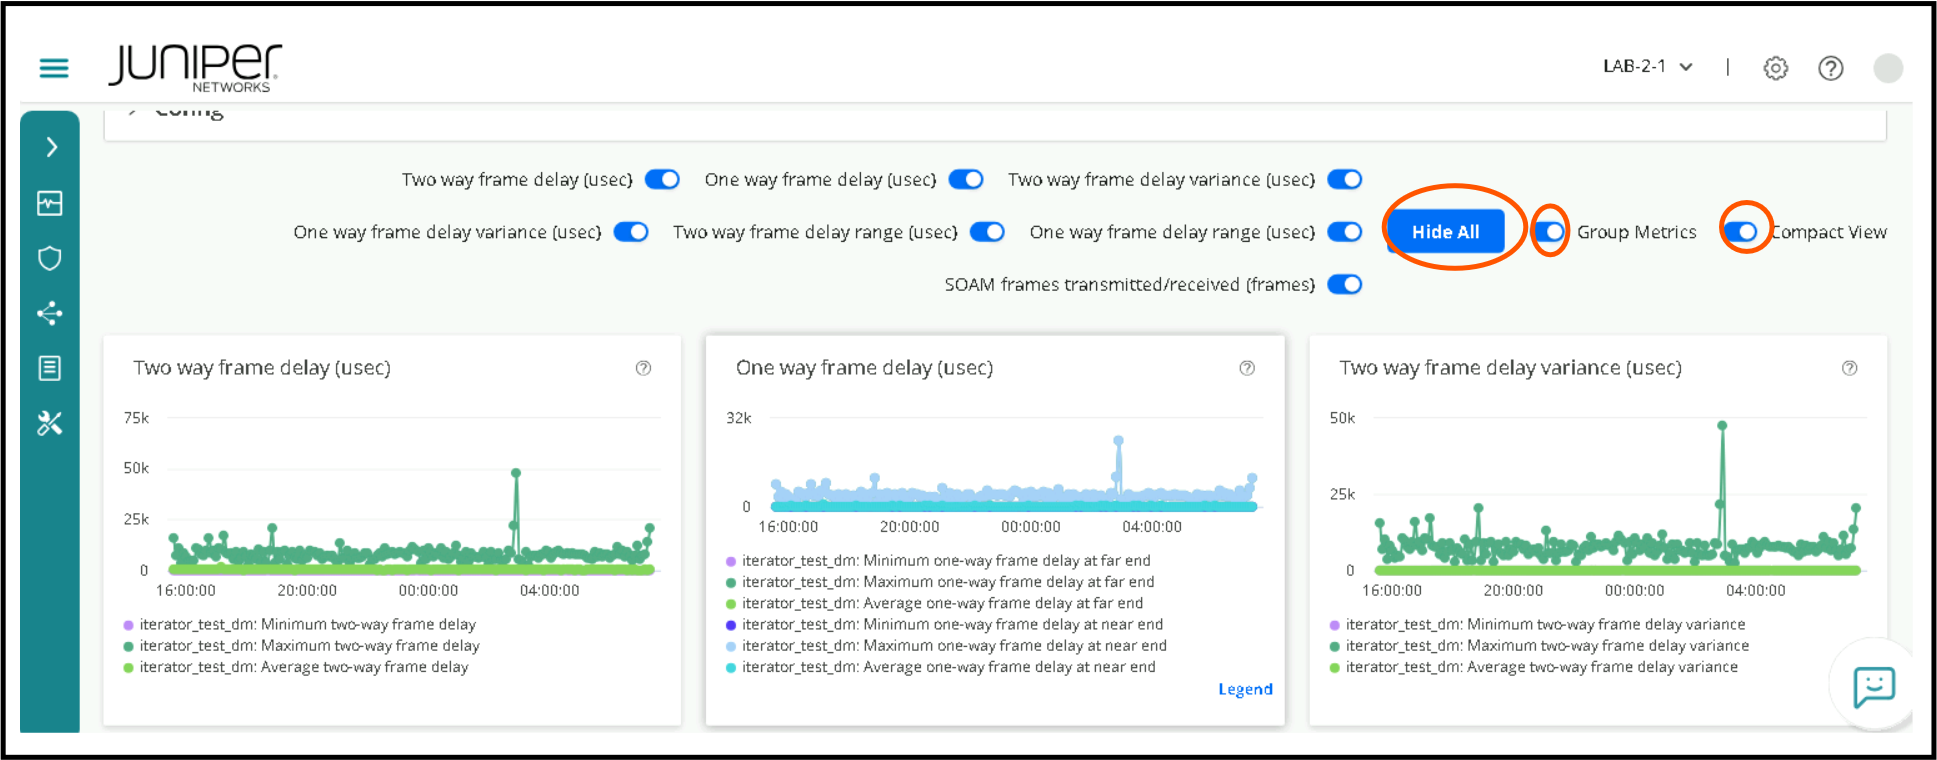
Click on the Stream say which says iterator_test_dm and change duration to say 16h which gives meaningful data. Enable Show All, Group Metrics, Compact View to get a overwhelming list of KPI’s.
Routing Director 2.4.0 API Lab
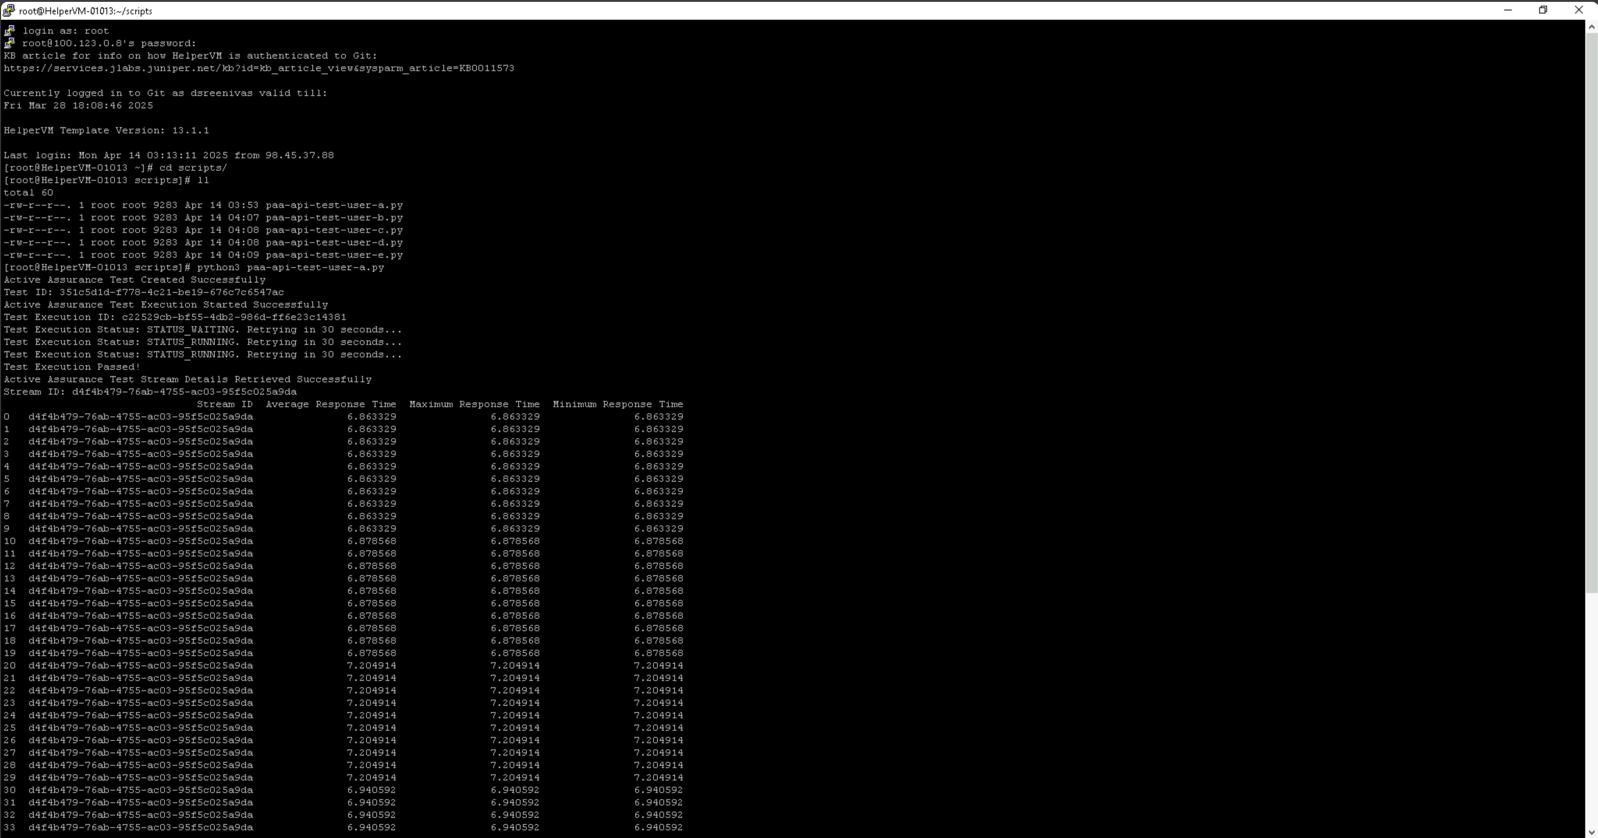
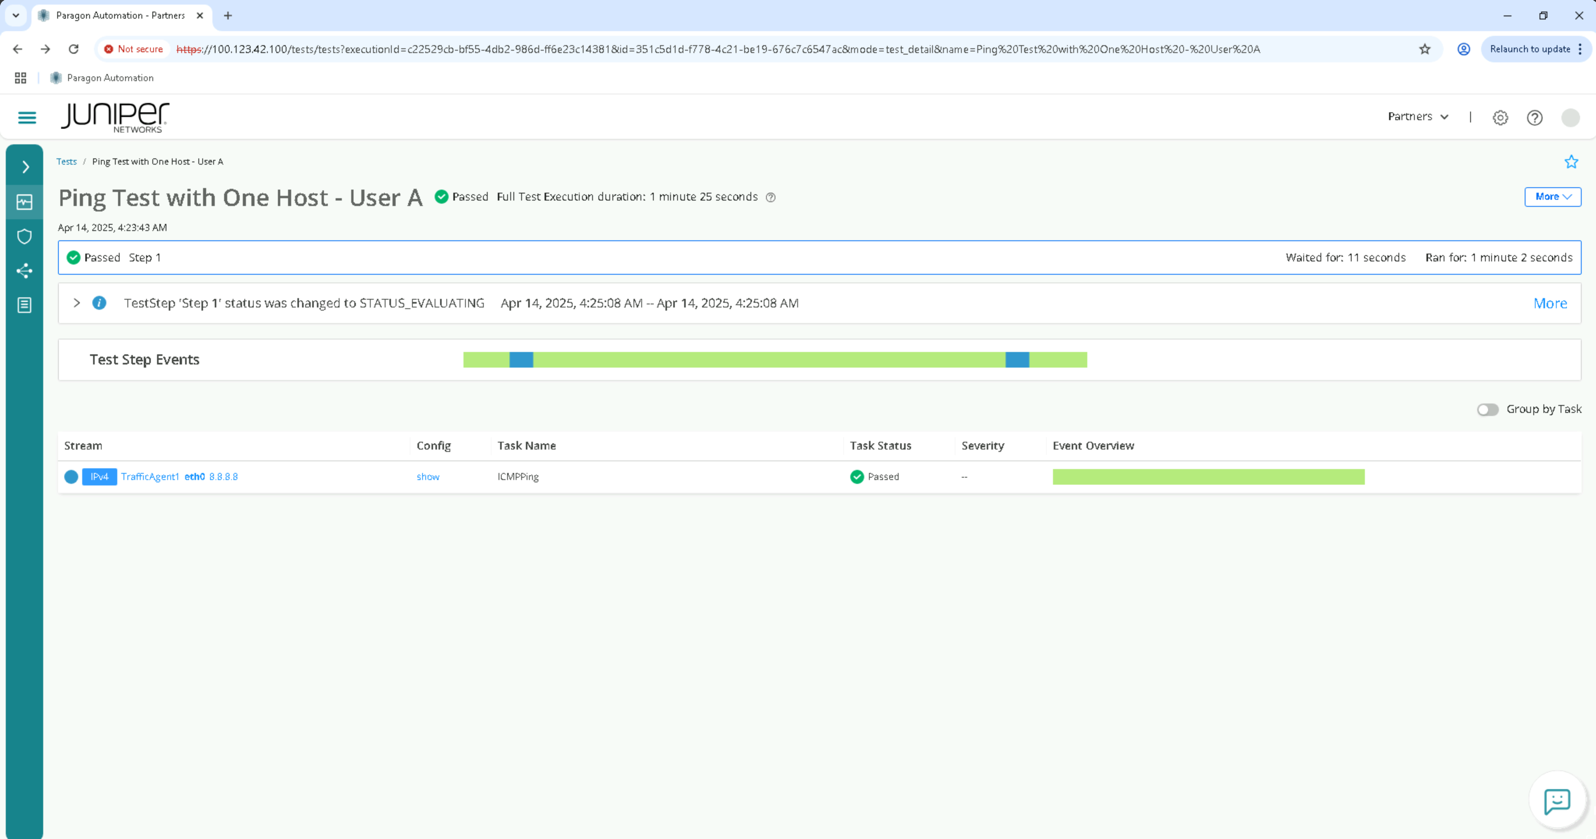
The objective of this test is to create a API based Test to ping from TestAgent1 towards internet 8.8.8.8 IP and dump the test results via API . Test can be verified from GUI as well once the test run is complete.
In order to demonstrate API we make use of a python script.
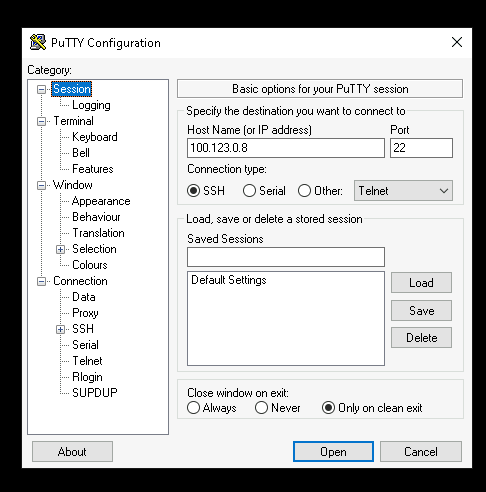
Execution of REST API based Tests from Helper VM
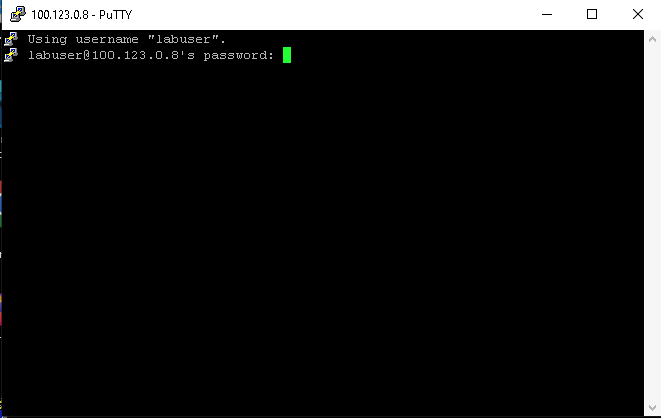
Access Helper VM via SSH from Windows Host using PuTTY.
Use the IP 100.123.0.8
Click on Open.
Login to Helper VM with the following to login:
Username - labuser
Password - Juniper!1
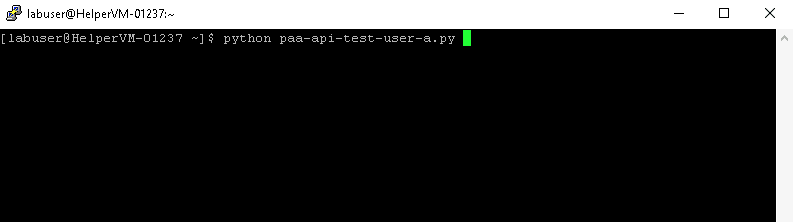
Execute script using the following command:
python3_paa-api-test-user- { }.py
For example, for a participant allocated {a}
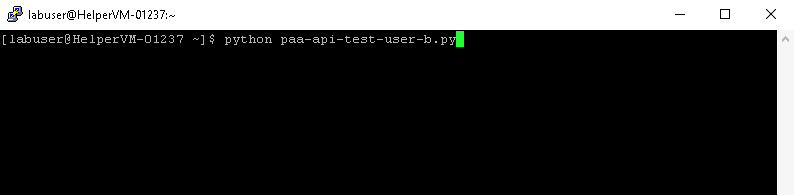
For example, for a participant allocated {b}
Check execution of tests from Routing Director GUI matching the roll {A to H}
You have successfully completed this Hands-On Lab!
Lab Survey
Please take 2 minutes and complet the Routing Active Testing and Routing Director API Hands-On Lab Survey