Device Life cycle management Lab
Overview
Juniper Routing Director helps with device lifecycle management by providing a comprehensive, automated, and intent-based approach to managing network devices from onboarding through ongoing operations to decommissioning.
Structured Lifecycle Stages
Divides device lifecycle management into phases (Day -2, Day -1, Day0, Day 1, Day 2) to plan, onboard, configure, manage, and offboard devices in a structured manner using Network Intent Plan.
Automated Onboarding and Configuration
Automates device onboarding using intent-based profiles that define device roles and configurations, enabling provisioning with farfewer steps and consistent deployment across many devices.
Customized Configuration Templates
Continuous Management and Monitoring
Enables ongoing device management tasks such as inventory tracking, license application, configuration backup/restore, software upgrades, and device reboots through automation.
Uses AI-driven monitoring and problem troubleshooting to detect anomalies, compliance issues, and performance degradations in real time, reducing mean time to know (MTTK) and mean time to repair (MTTR)
Intent-Based Automation and Orchestration
Leverages an intent model to specify device configurations and operational intents, ensuring that network devices operate according to designed policies and roles.
Orchestrates complex configurations and software updates across multiple devices by updating a central network implementation plan, which is then automatically applied to devices.
Enhanced Operational Efficiency and Security
Minimizes manual interventions and human errors, accelerating service deployment and reducing operational costs.
Provides continuous compliance and trust monitoring to maintain device security throughout its lifecycle. Quantifies Trust.
Unified Visibility and Troubleshooting
Offers an integrated GUI with detailed device views, health status, compliance advisories, and root-cause analysis to help network operators quickly identify and resolve issues.
Starting Lab
This lab allows 4 people per sandbox. Each Sandbox has 4 sets of devices. We will be using 1 set per user (one of SETA, SETB, SETC, SETD). Please reverify that you are using the allocated SET
If you would like to do this lab raise your hand to get Lab User information.
Lab Blueprint Topology
The blueprint consists of sets of 2 vMX devices and Routing Director 2.4.0, A single set (one of SETA, SETB, SETC, SETD) is allocated to the user. Please make sure to identify the correct allocation set so as not to get into another users way.
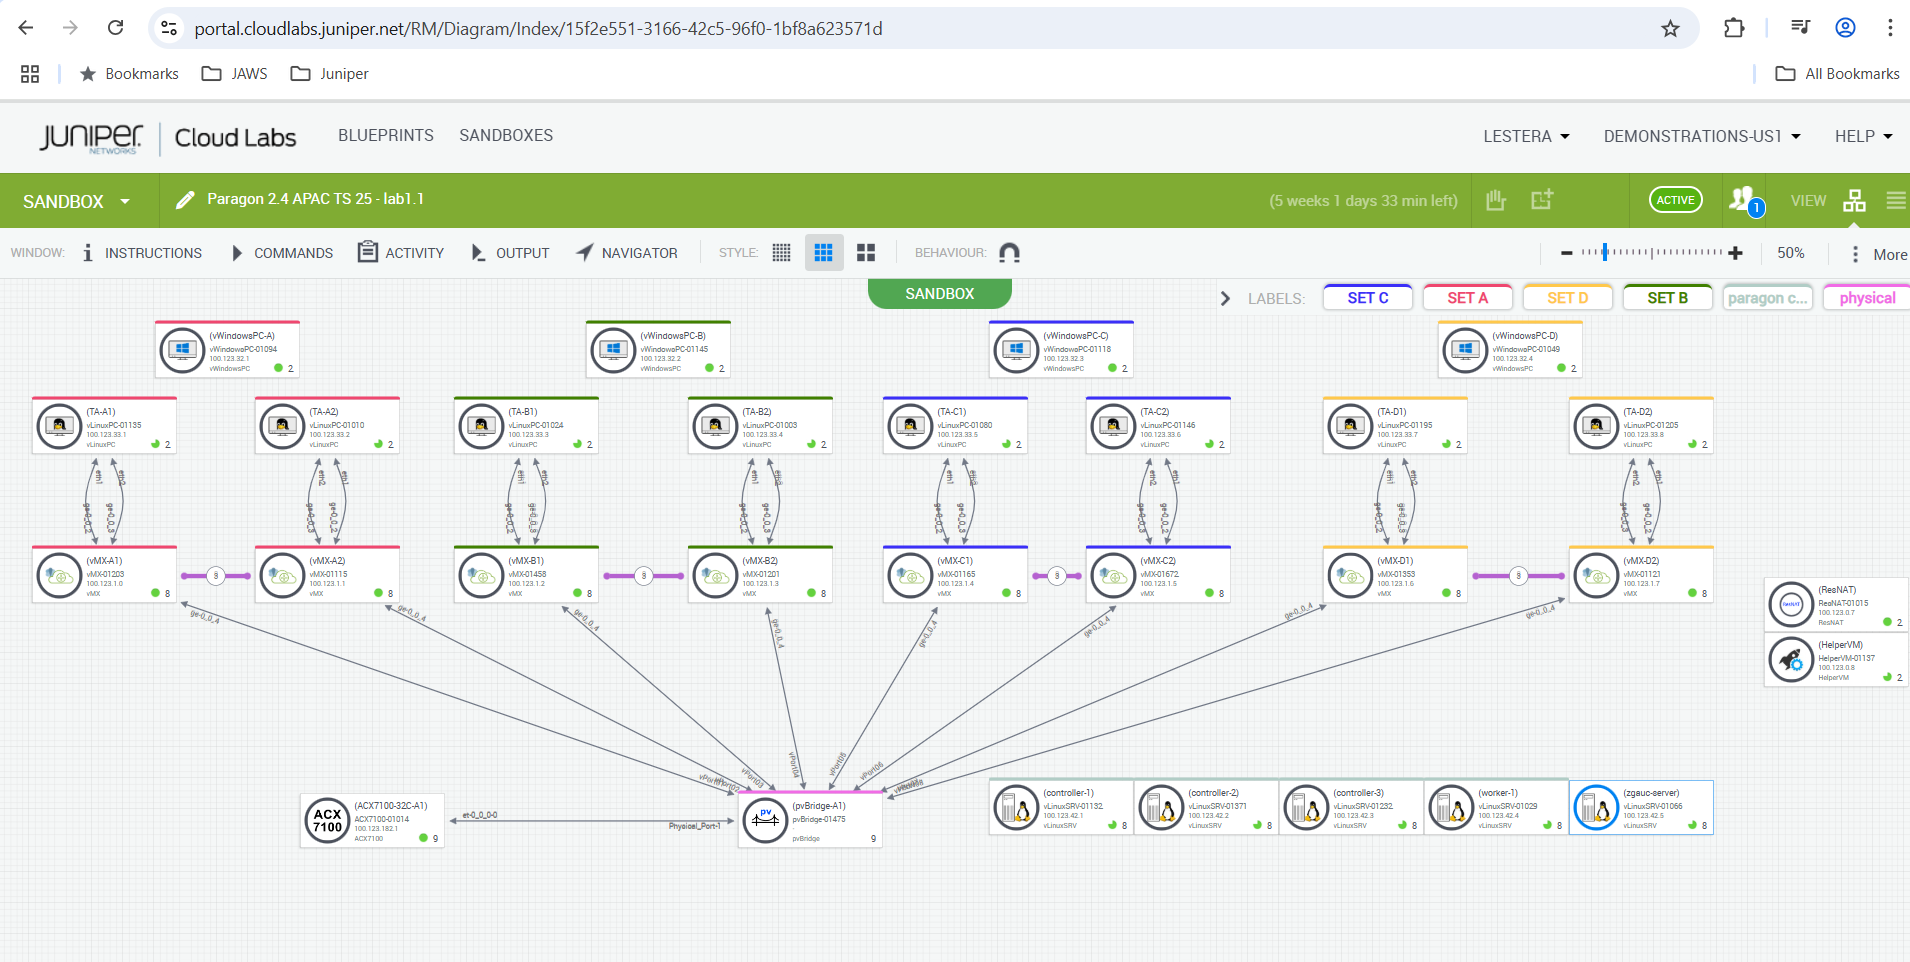
Allocations of SET, Devices and NIP , Please make sure to use only as per allocation .
SET |
Devices |
Network Implementation Plan |
|---|---|---|
SETA |
vMX-A1, vMX-A2 |
NIP-A |
SETB |
vMX-B1, vMX-B2 |
NIP-B |
SETC |
vMX-C1, vMX-C2 |
NIP-C |
SETD |
vMX-D1, vMX-D2 |
NIP-D |
Device Lifecycle Management
The objective is to demonstrate Device lifecycle management, Observability and Trust use cases.
Network Intent Planning
Managing Configuration and backups
Deploy a Custom configuration template
Review Audit Logs
Could a configuration have caused issues, track changes by diff configuration against last backup.
Can we Trust a device, understand how Trust score is computed and what Parameters affect its computation.
Can we Track Interfaces health, flaps, statistics.
Track outstanding Alarms, Alerts and syslog’s
Login to Routing Director via Jumpbox
Using RDP Client, connect to your Labuser assigned IP address/Port
Login using your Lab User credentials
Open Chrome, and navigate to https://100.123.42.100, you should see the login page to Juniper Routing Director GUI
Login using your Lab User credentials
Username - jcluser@juniper.net
Password - Juniper!1
Network Planning
View the already constructed Network Implementation Plan (Please don’t make changes as it will impact the Lab)
The objective of this part is to view how we build a intent plan, add devices, Physical interfaces and Links to a Plan. We will not be committing any changes , but getting a fair idea of how to do Network Planning for Onboarding use case.
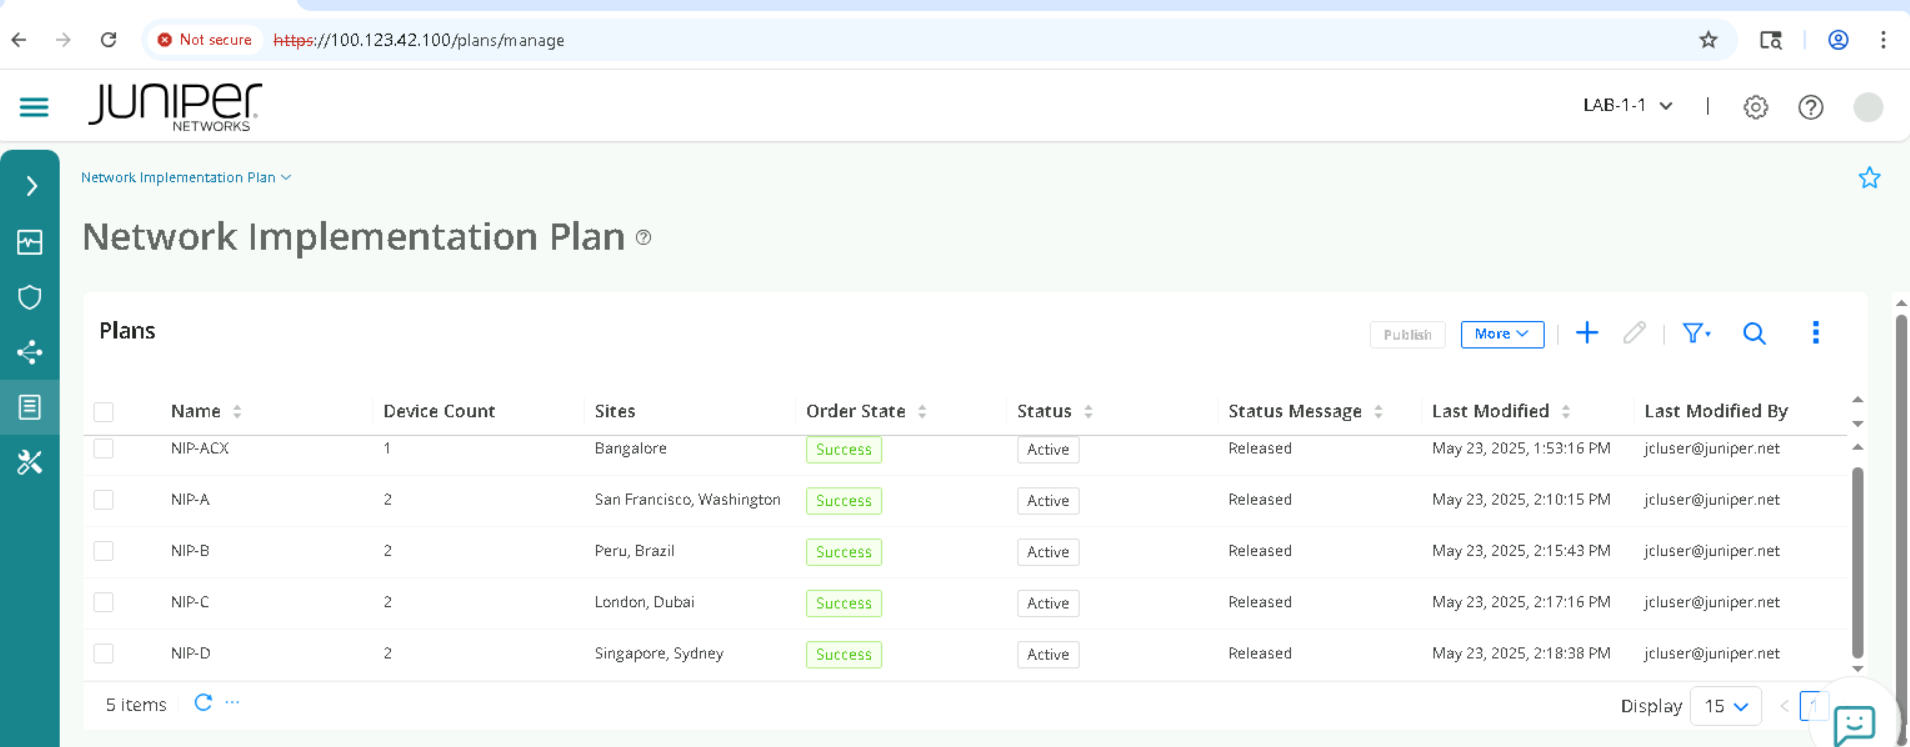
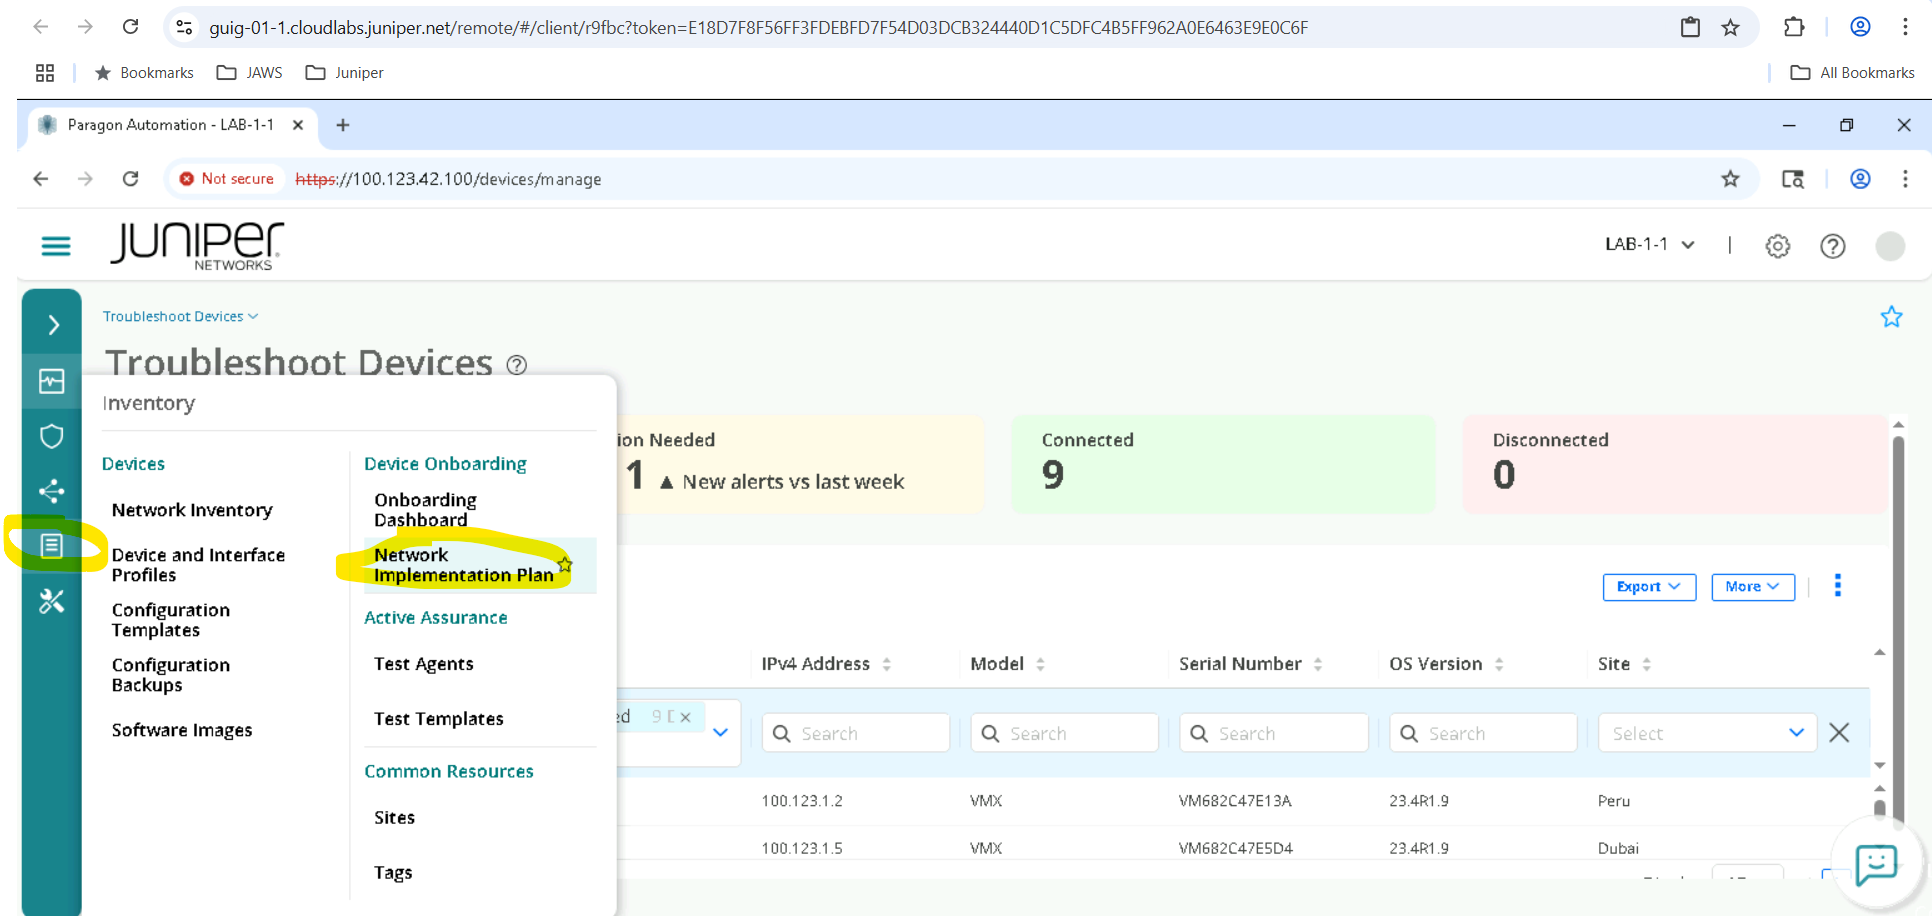
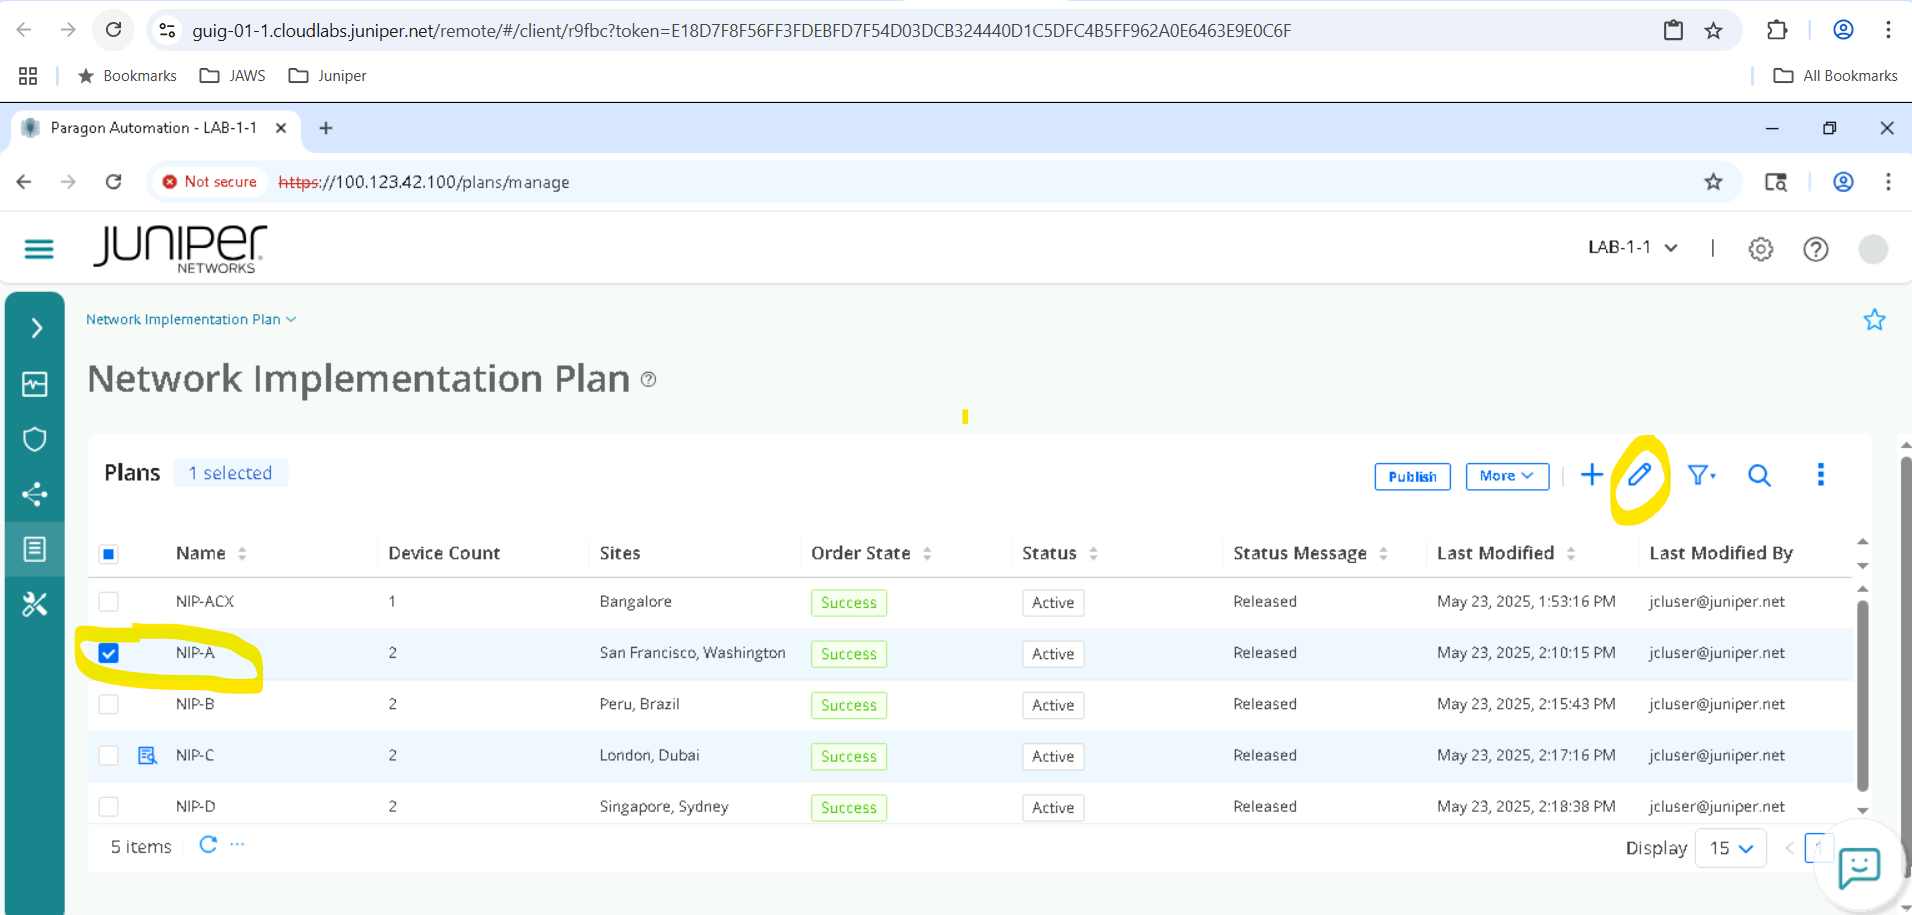
Navigate to Inventory > Network Implementation Plan
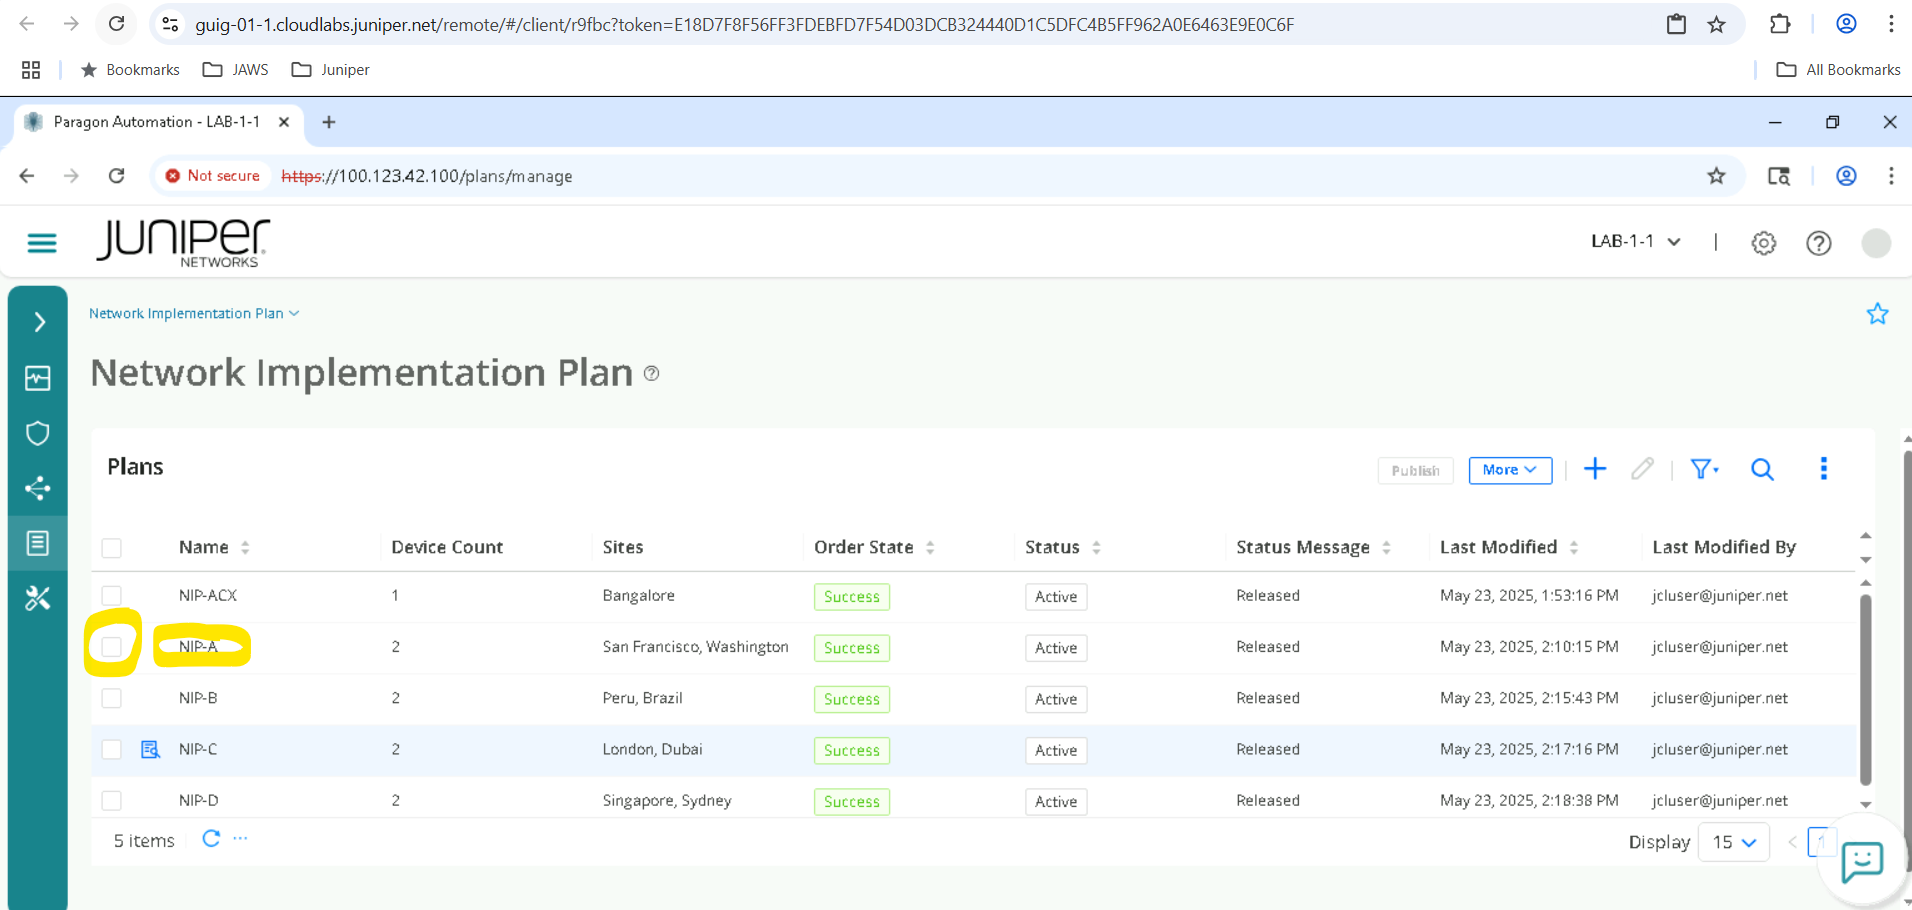
Select the appropriate Network Implementation Plan (NIP-A for SET-A devices, NIP-B for SET-B and so on) and click on Edit . Note that we will not commit any changes but only view the NIP .
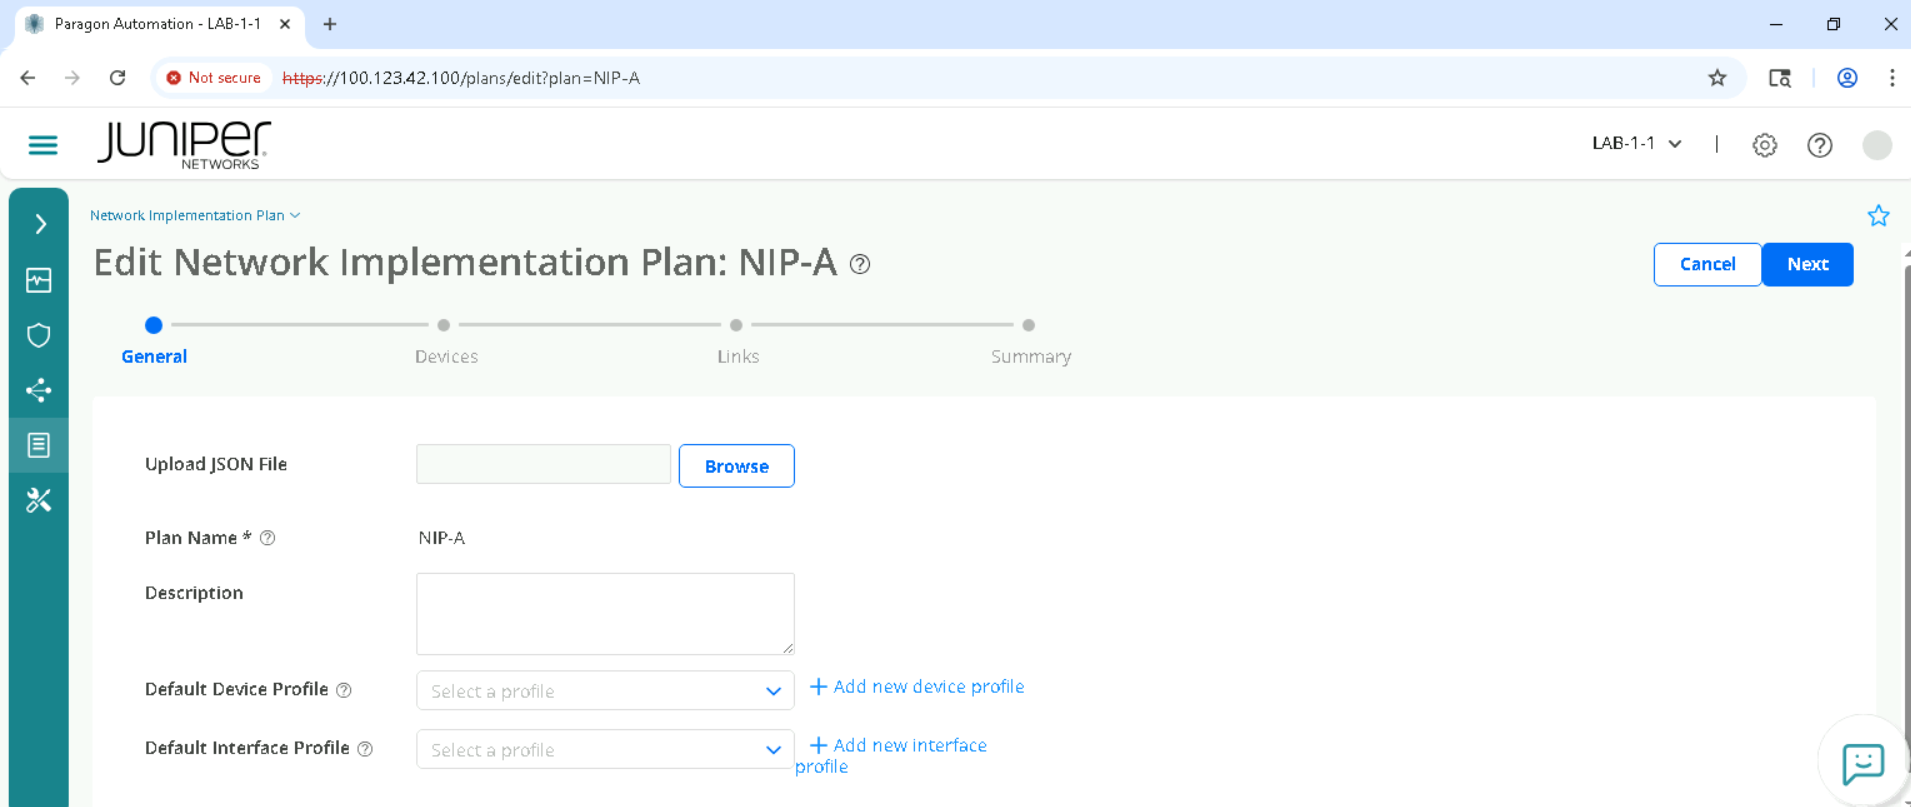
Click on Next
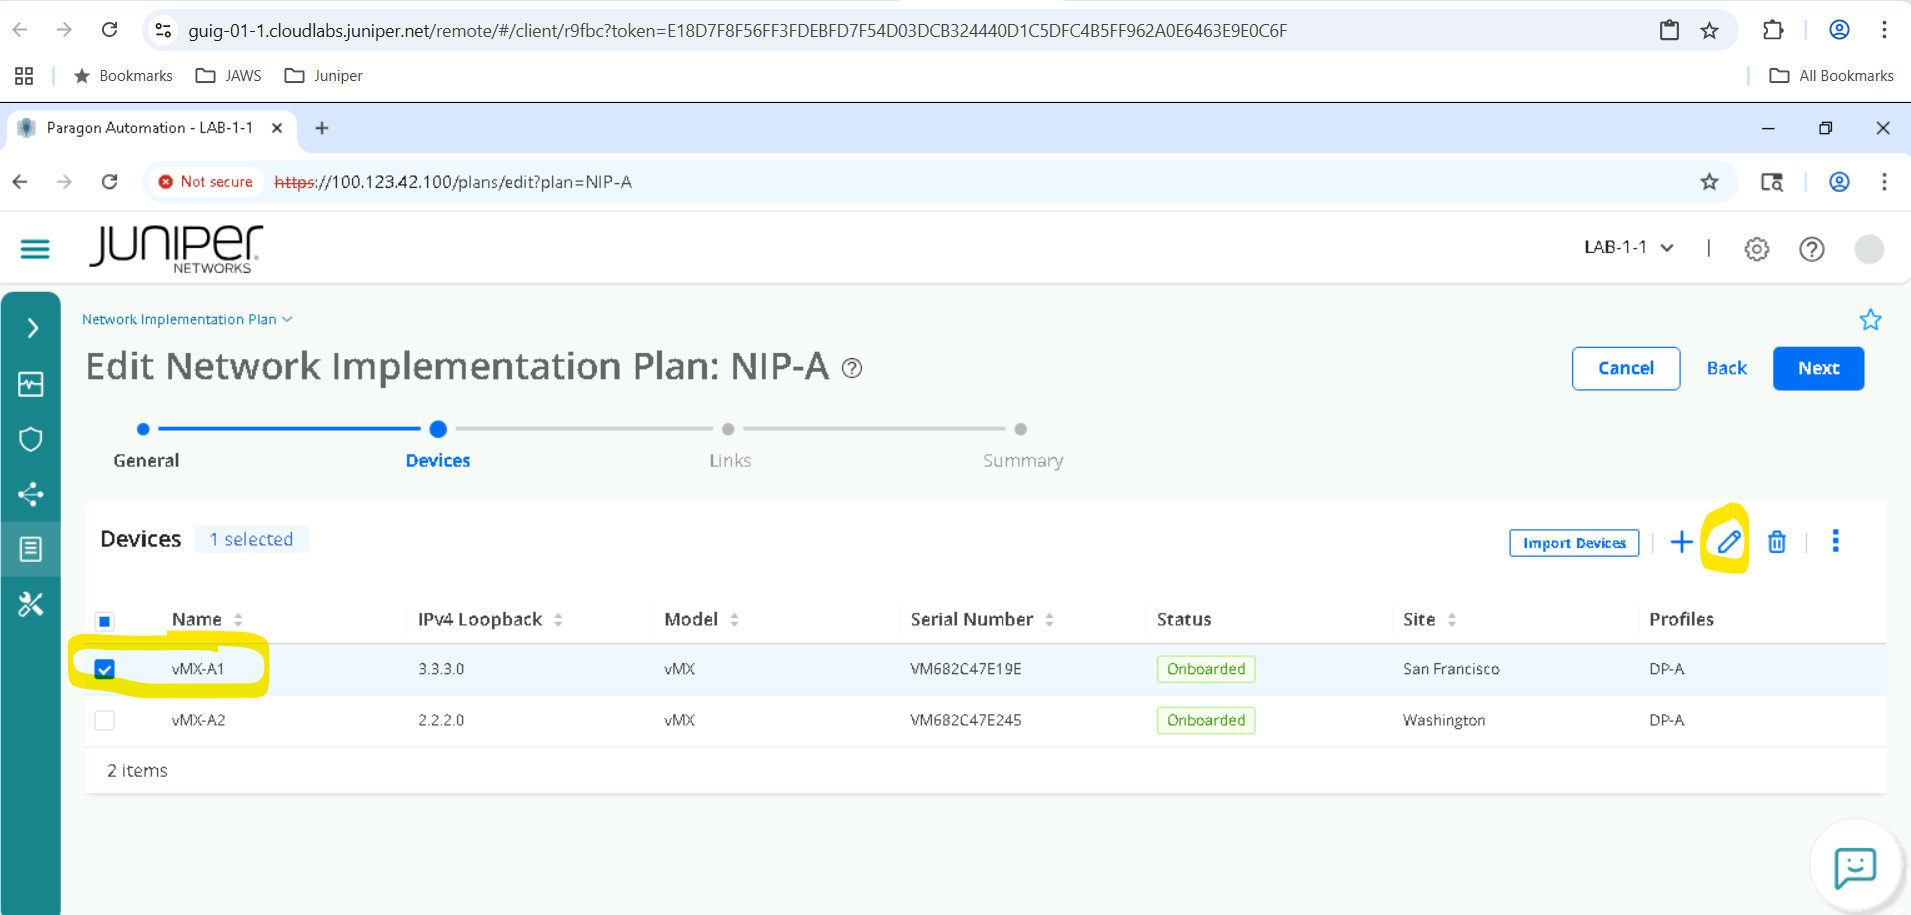
Select one of the devices and click on edit
Review the device details and click Next
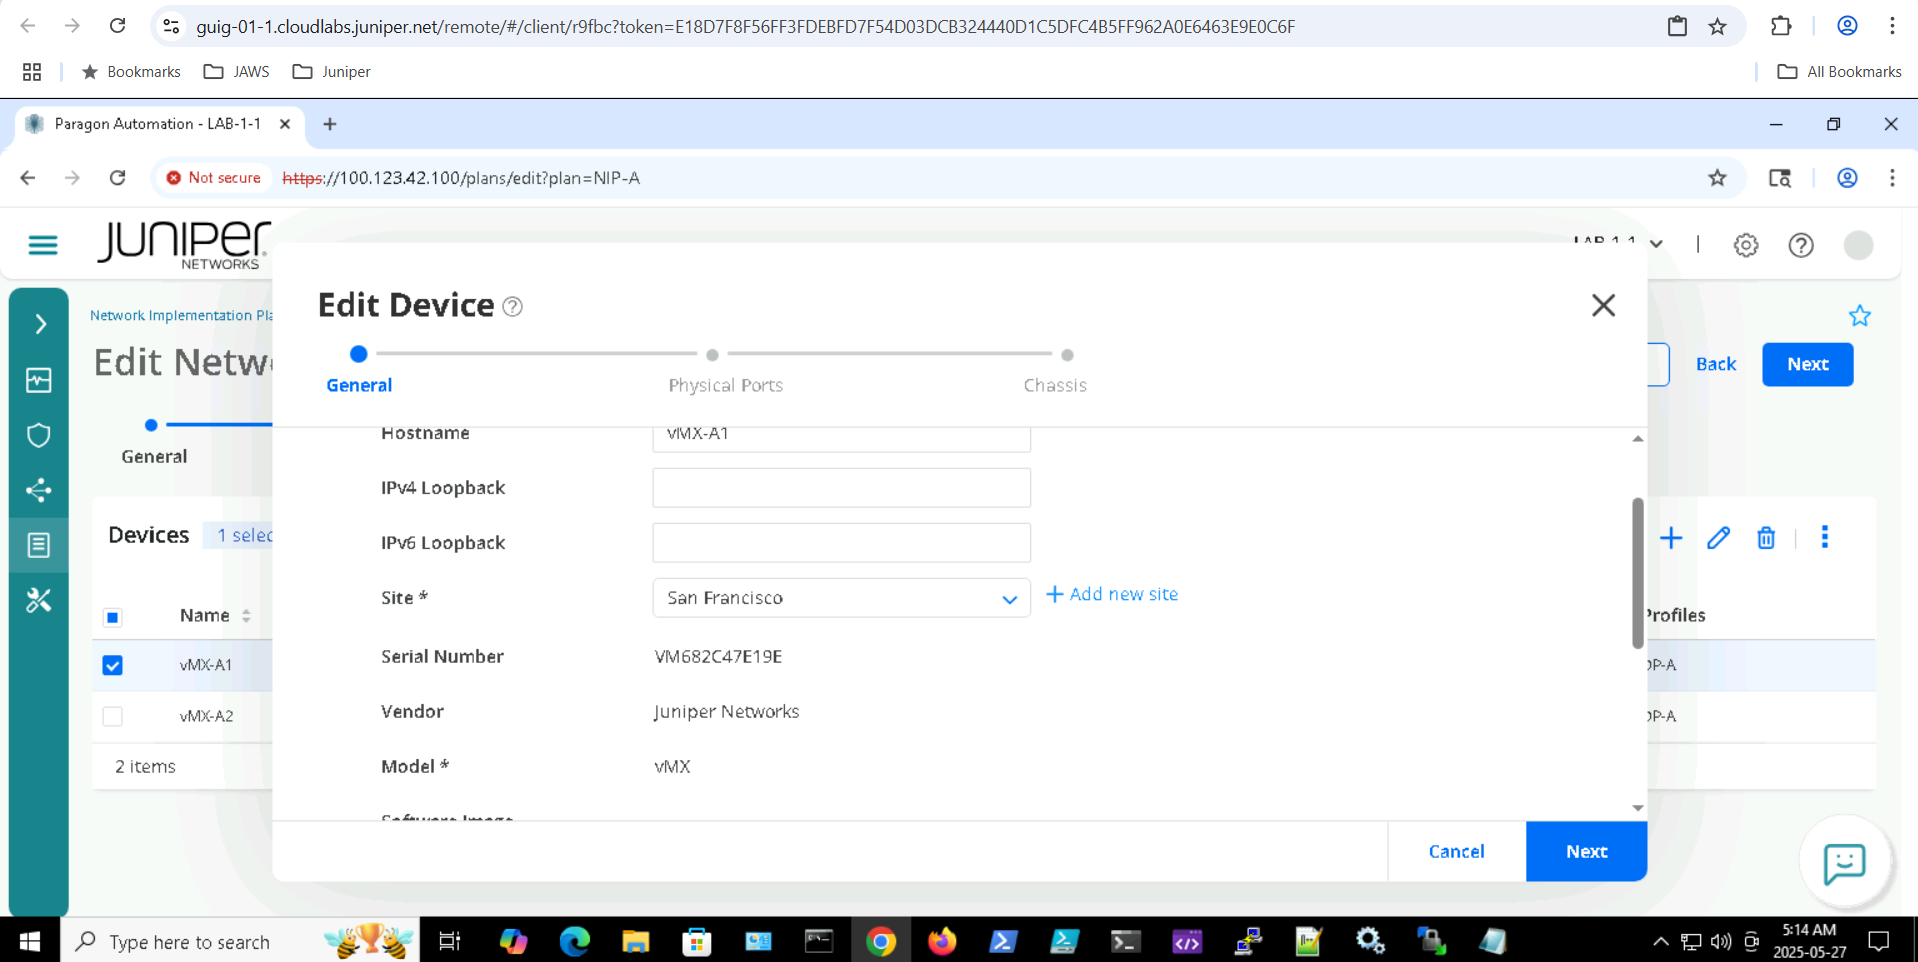
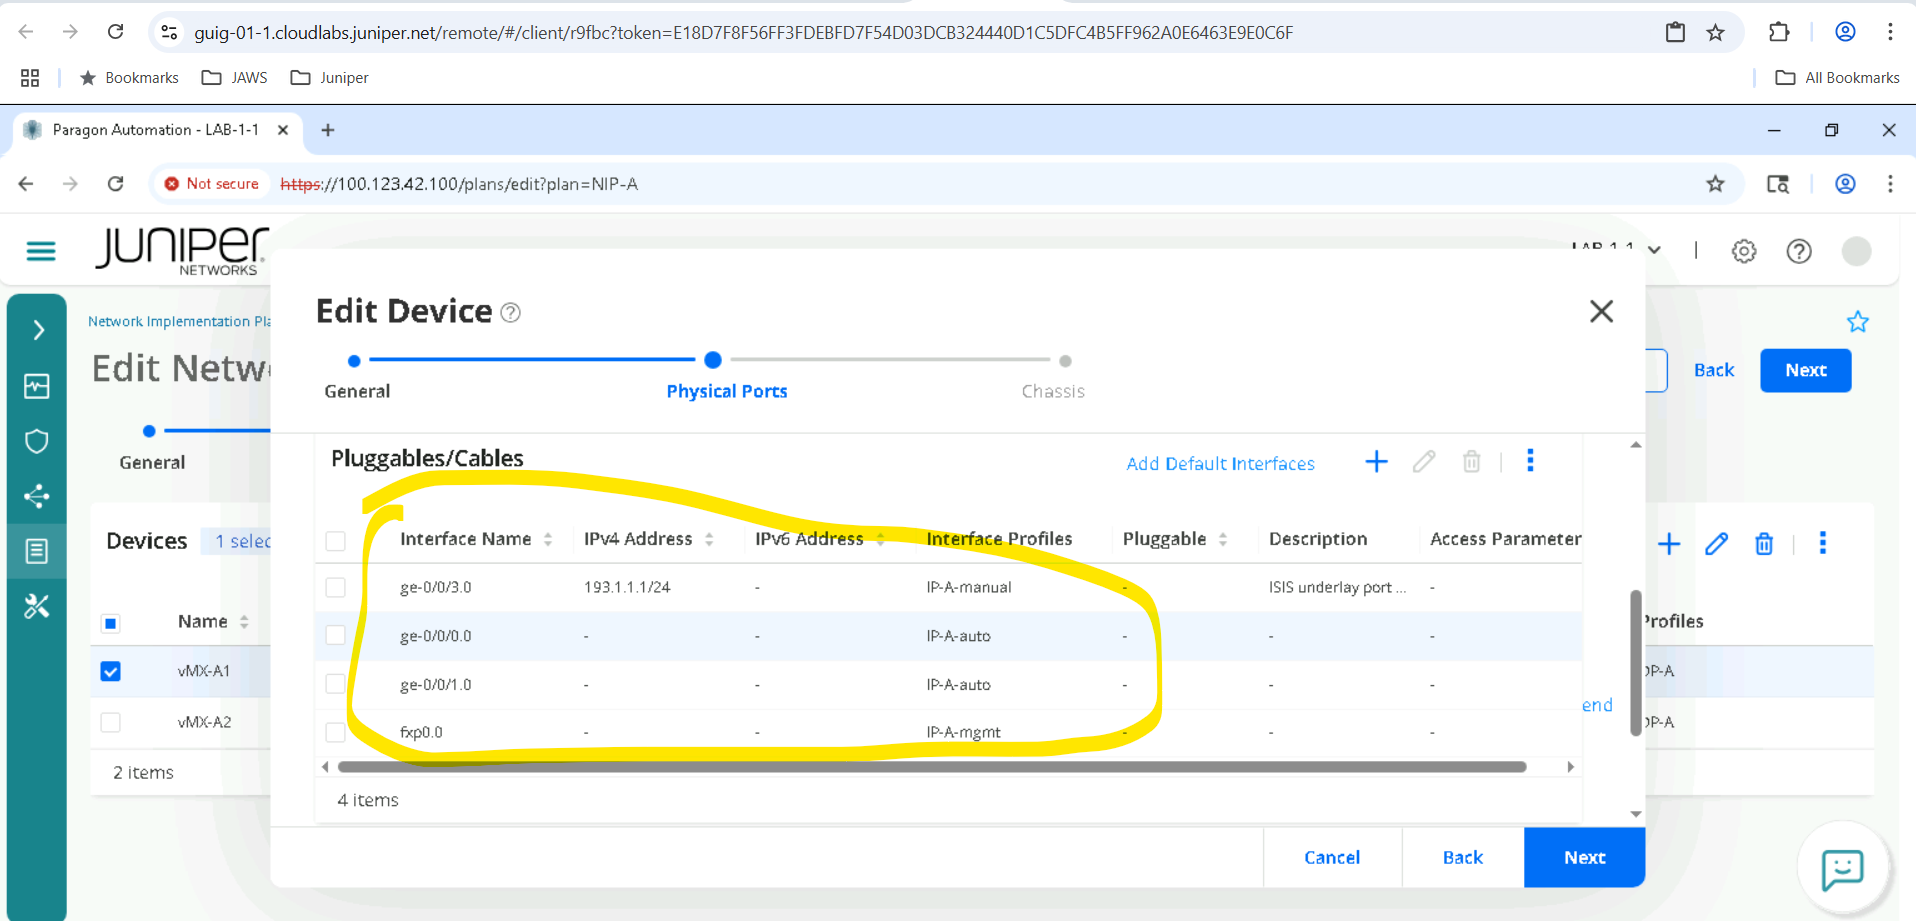
Review Physical Ports then click Next
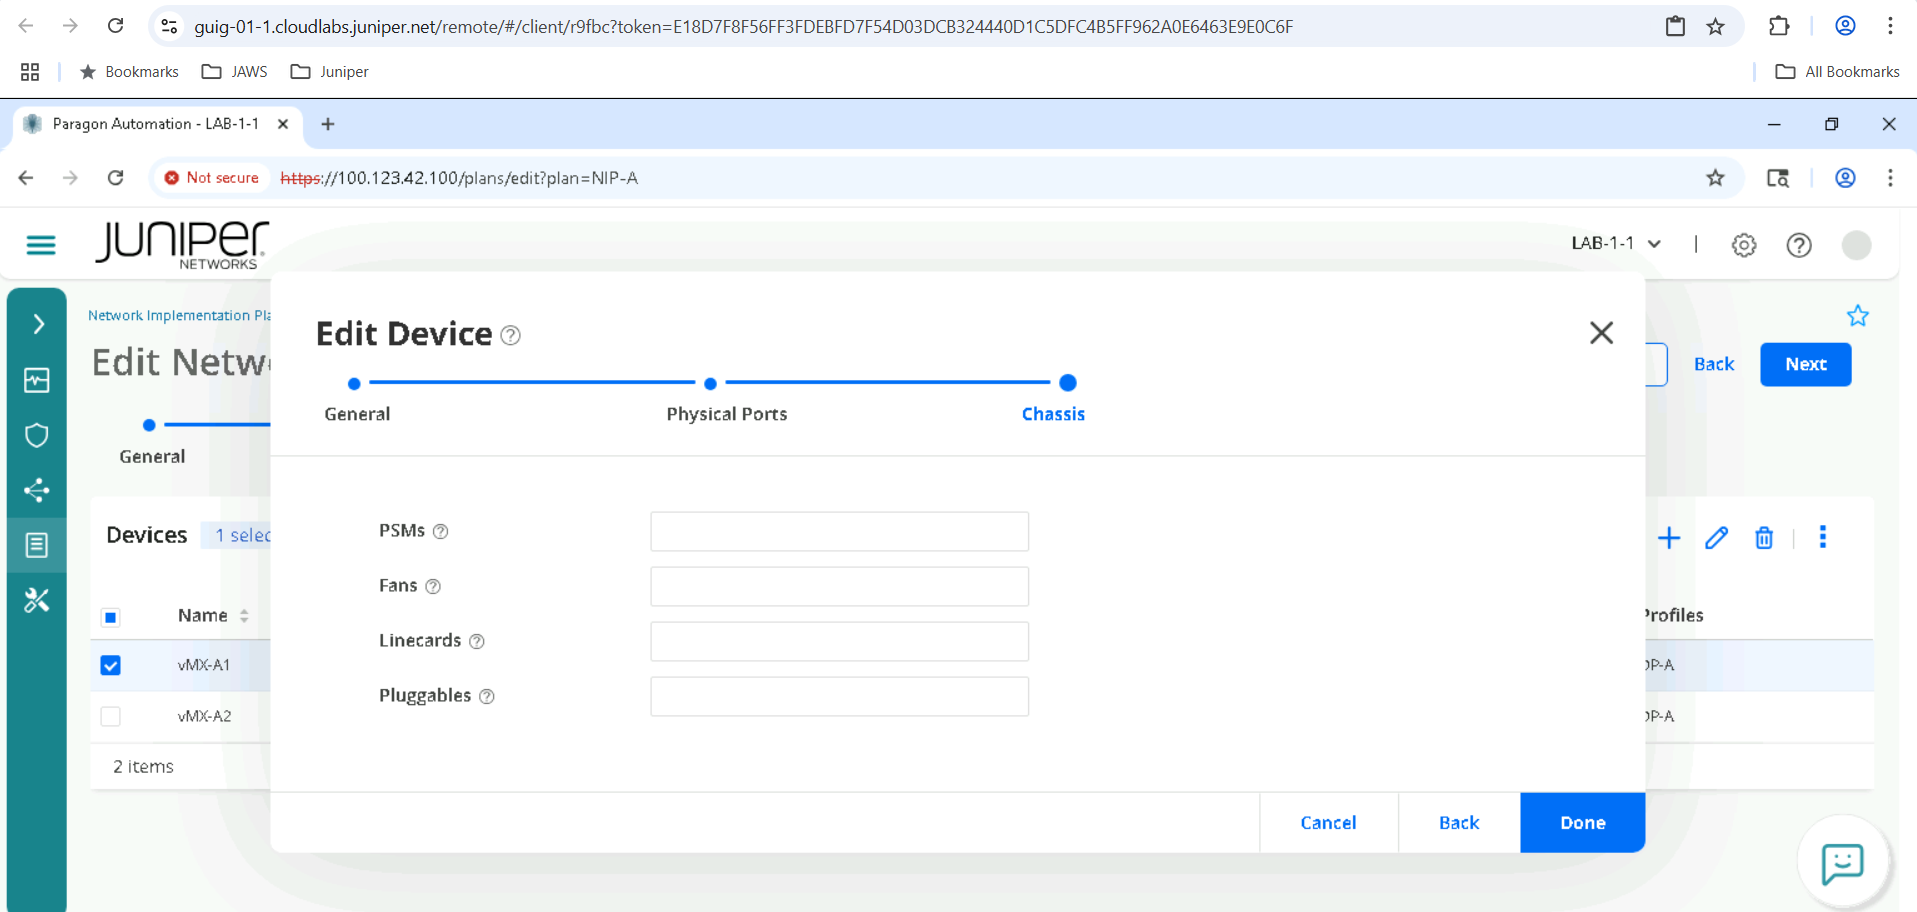
Review Chassis details , then click Done and Close
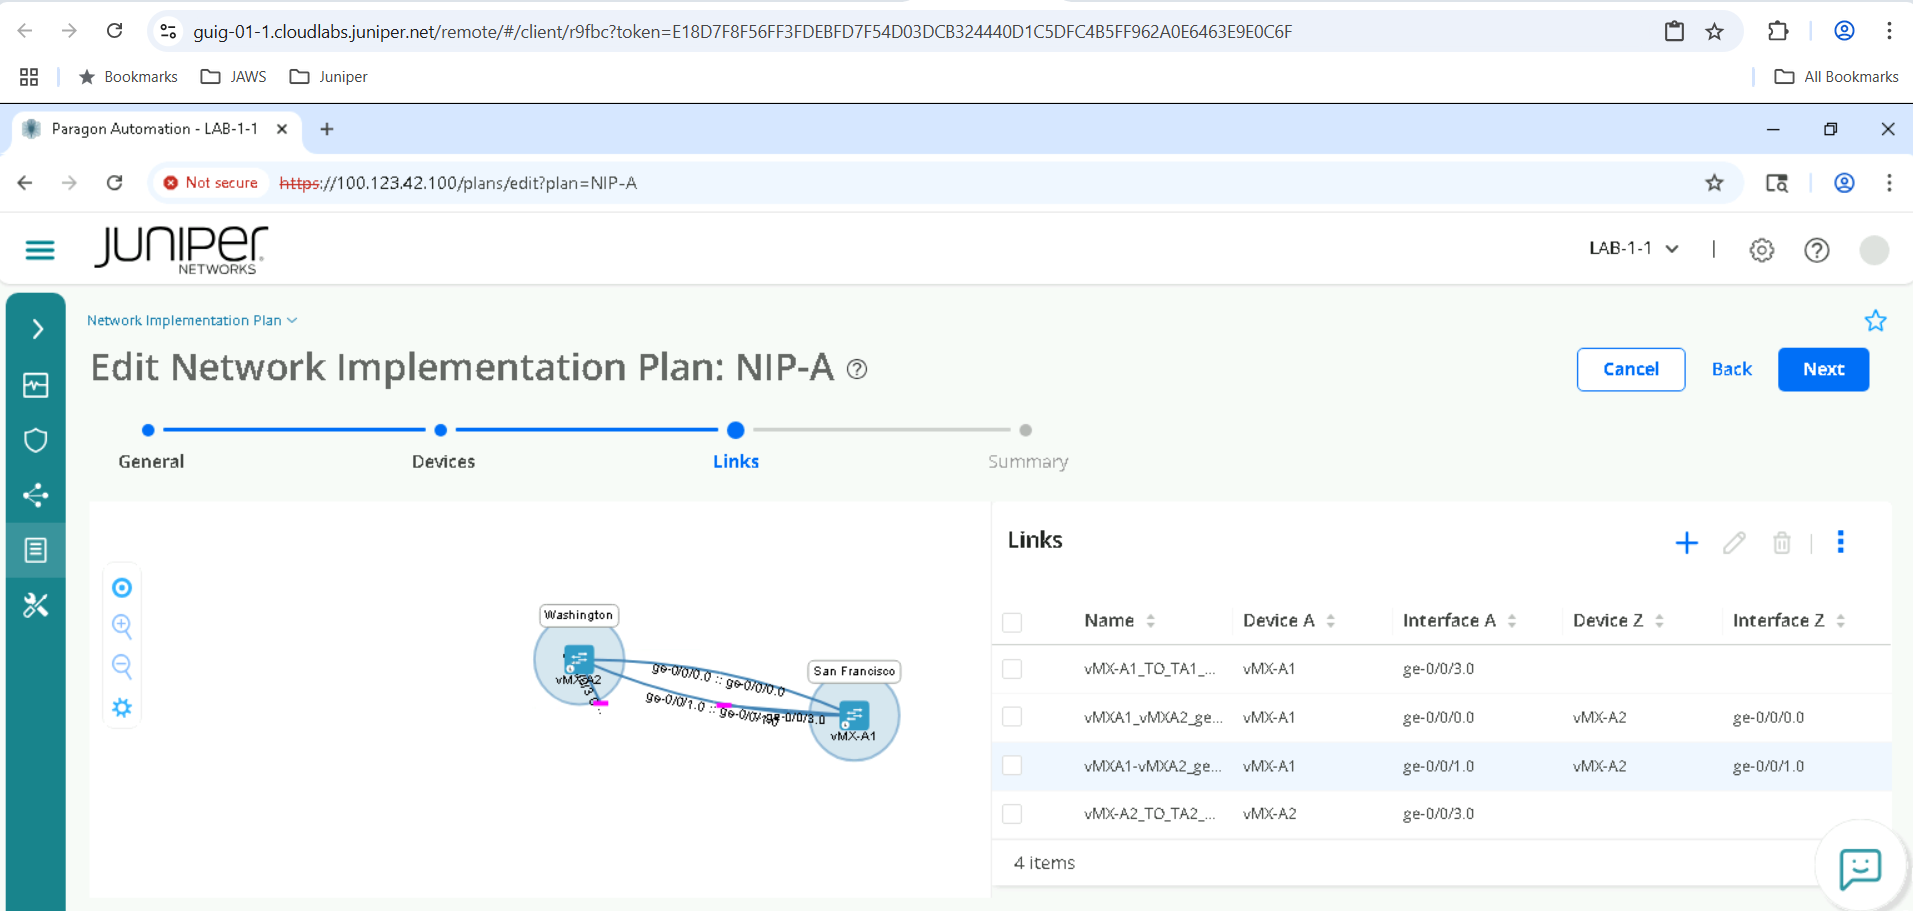
Move on to the Links page and click Next
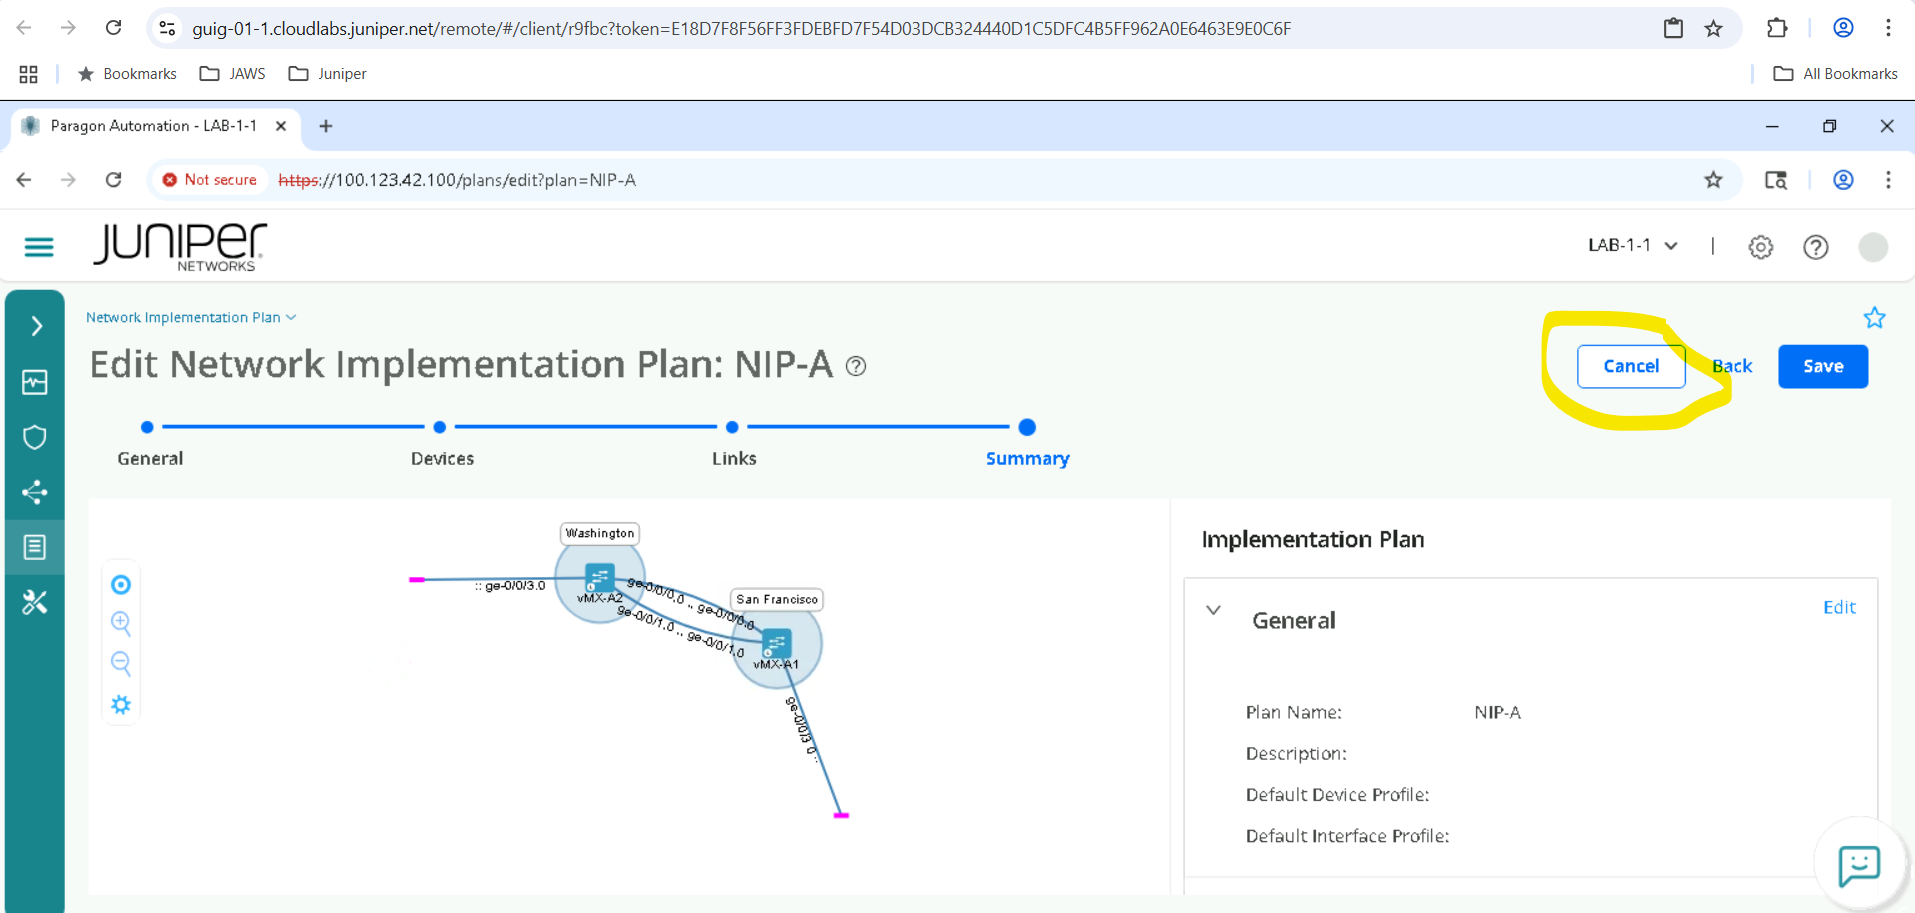
You will view the Summary Page , Please Cancel as we don’t want to make any changes so as not to impact the lab.
Managing Configuration in the Network Device
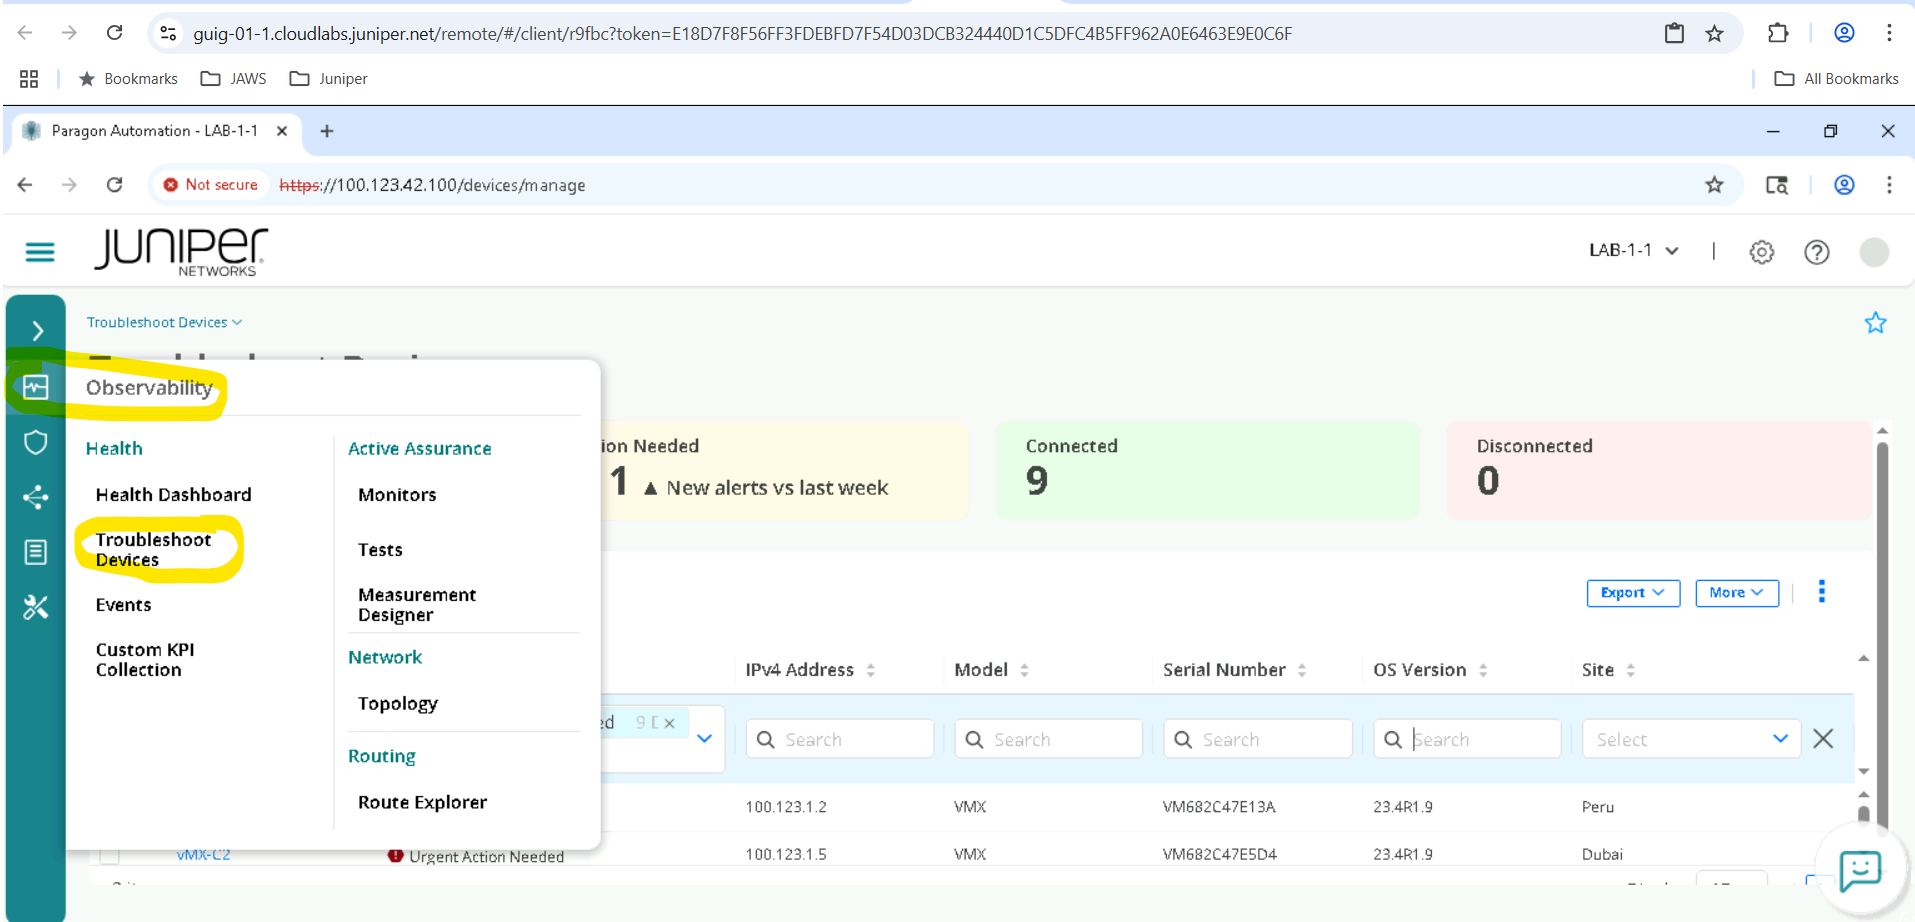
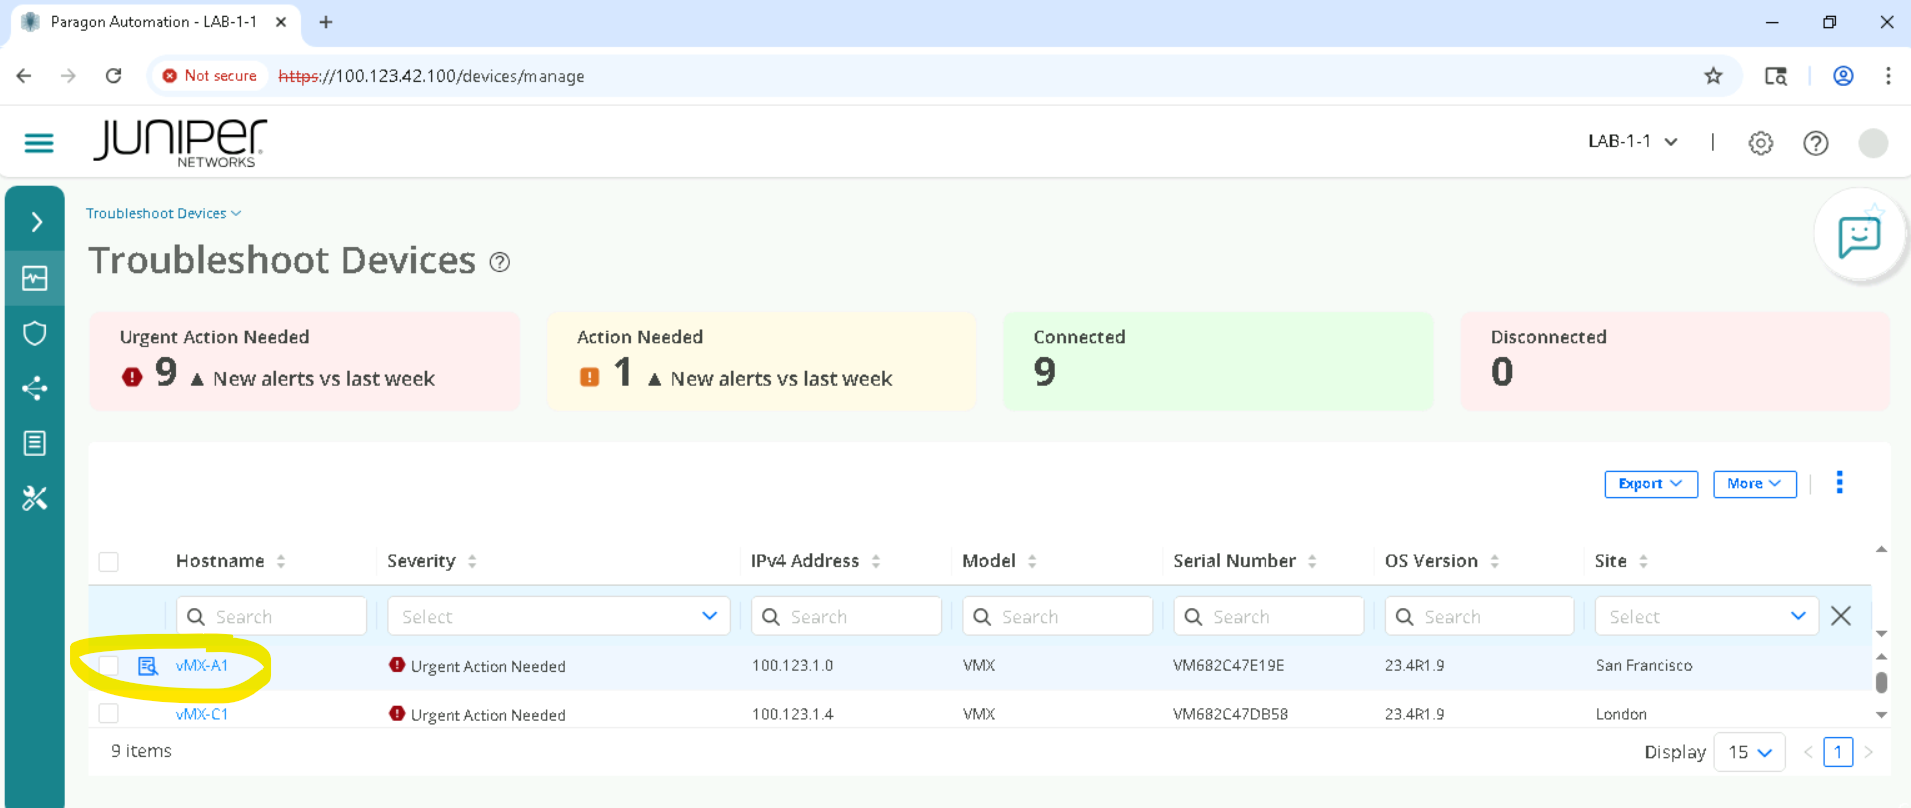
In the Routing Director GUI on the left side pane, go to Observability > Troubleshoot Devices.
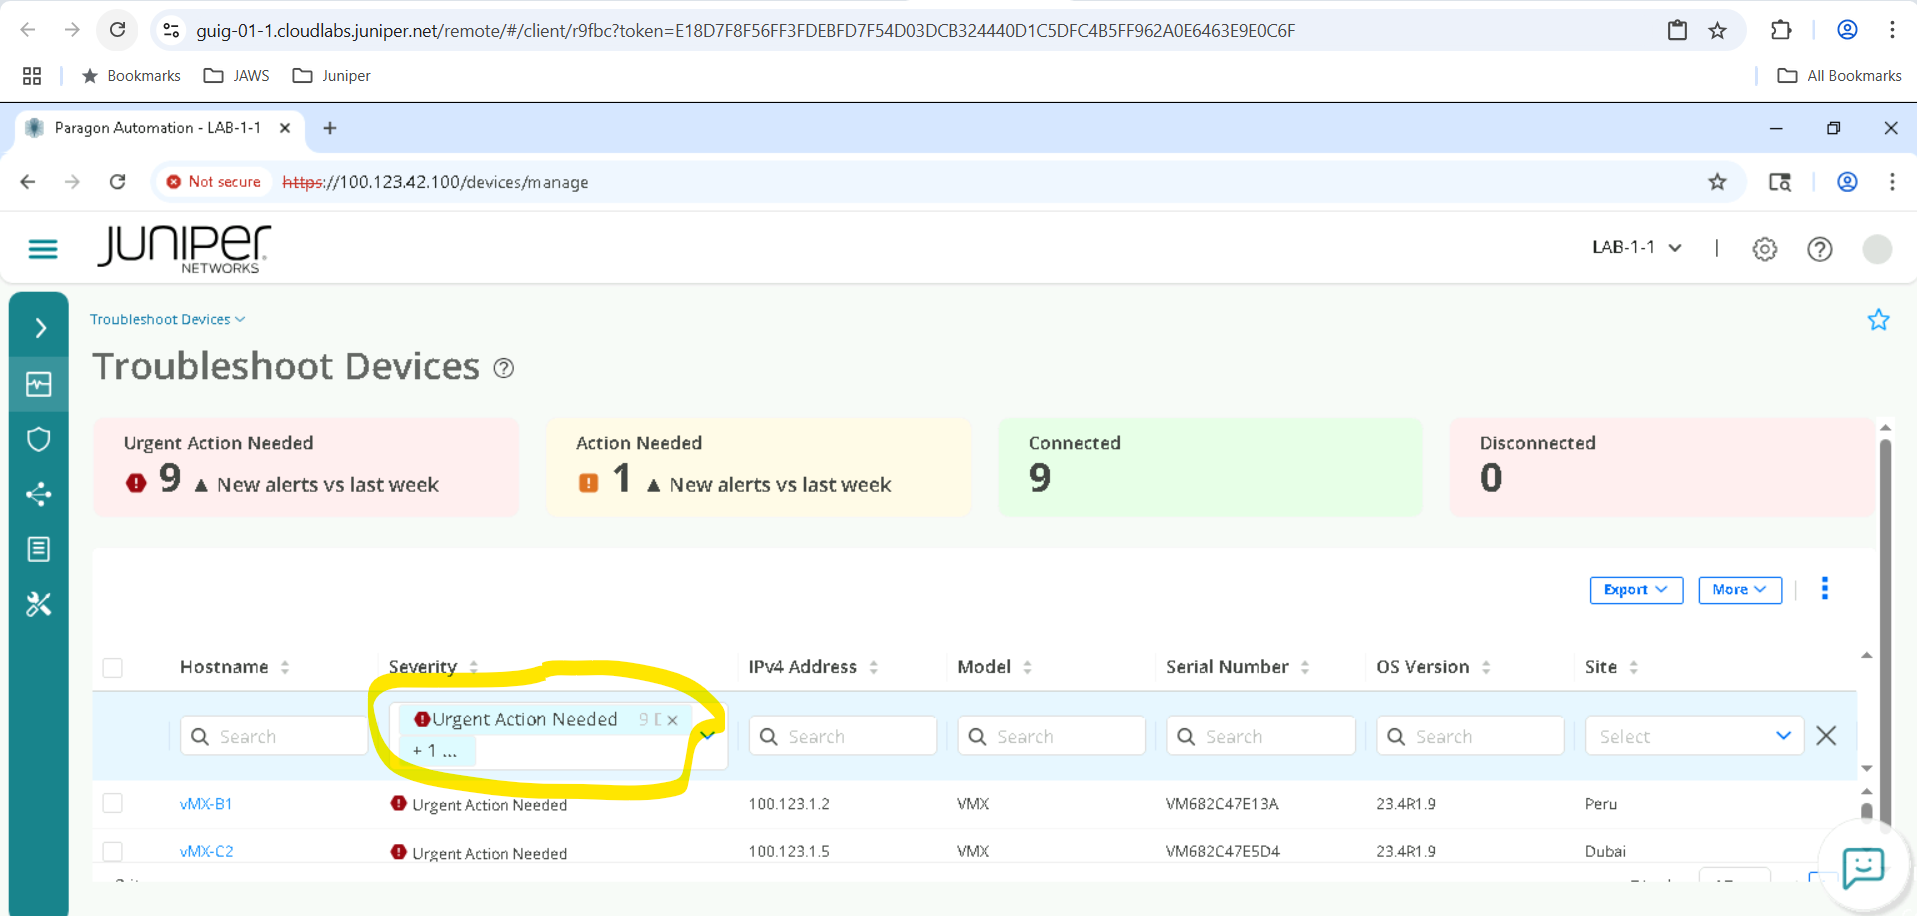
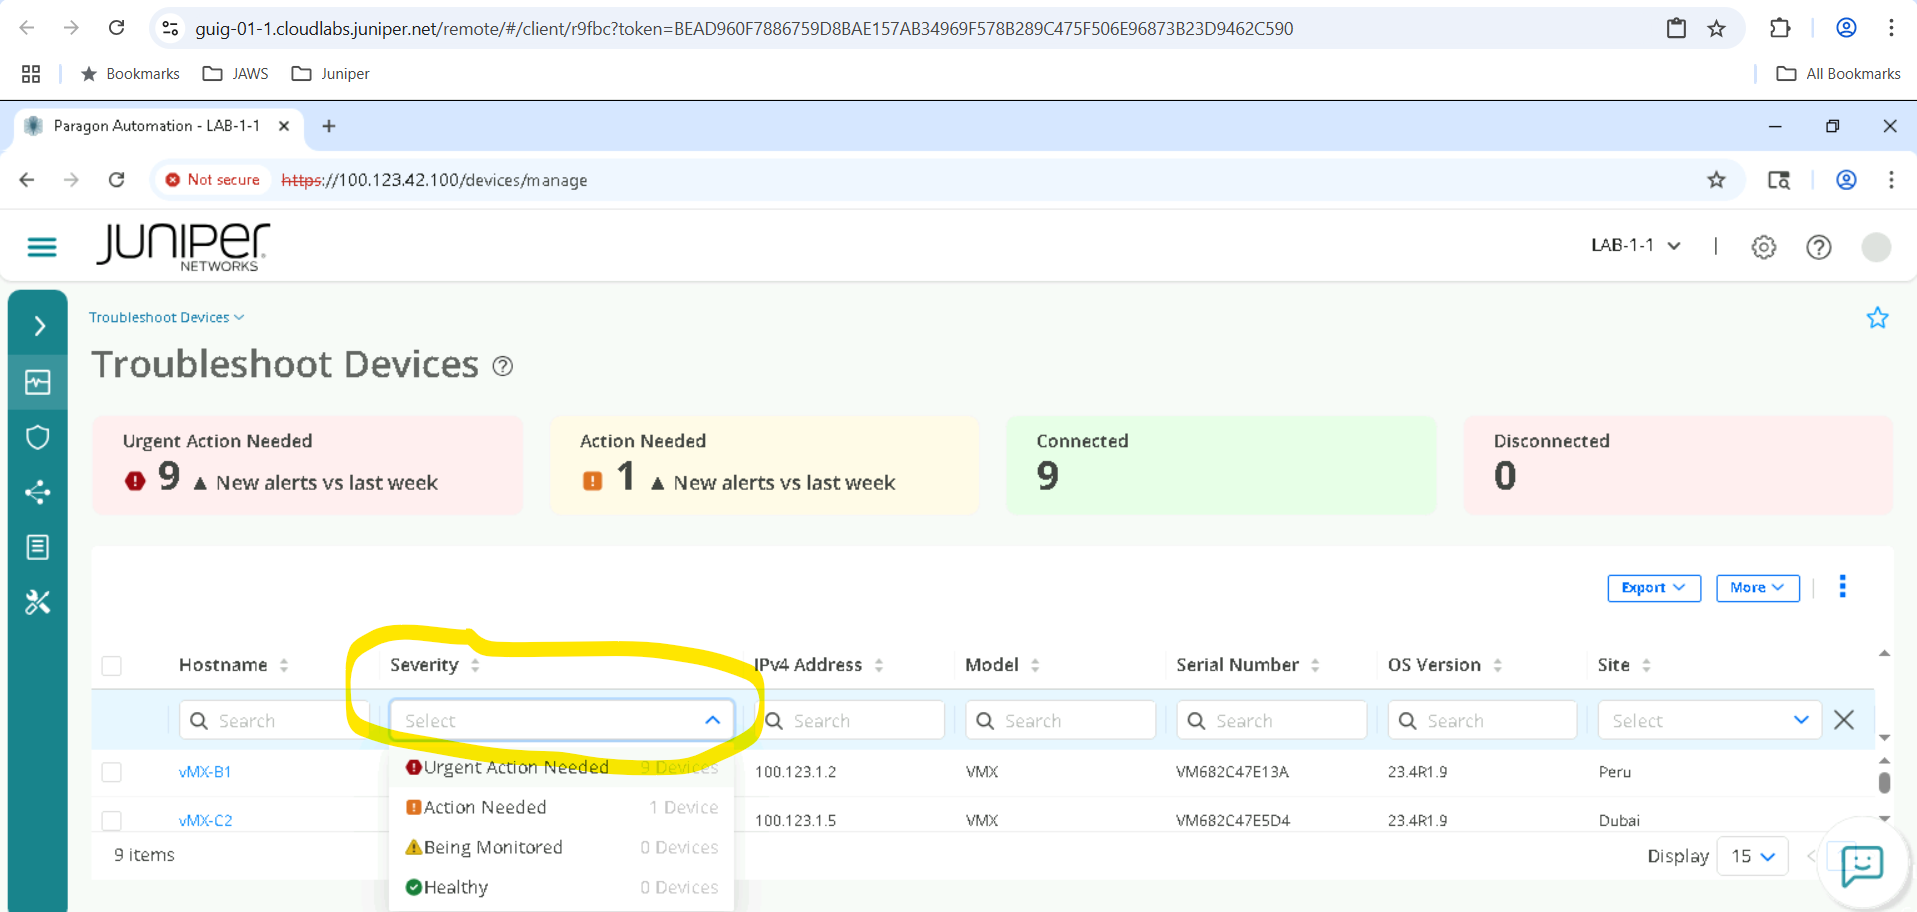
We need to clear the Severity Filter to view all the devices , go ahead and click on X inside the Severity column to remove Urgent Action Needed and other filters. We must make sure everything is unselected here , so all devices are visible.
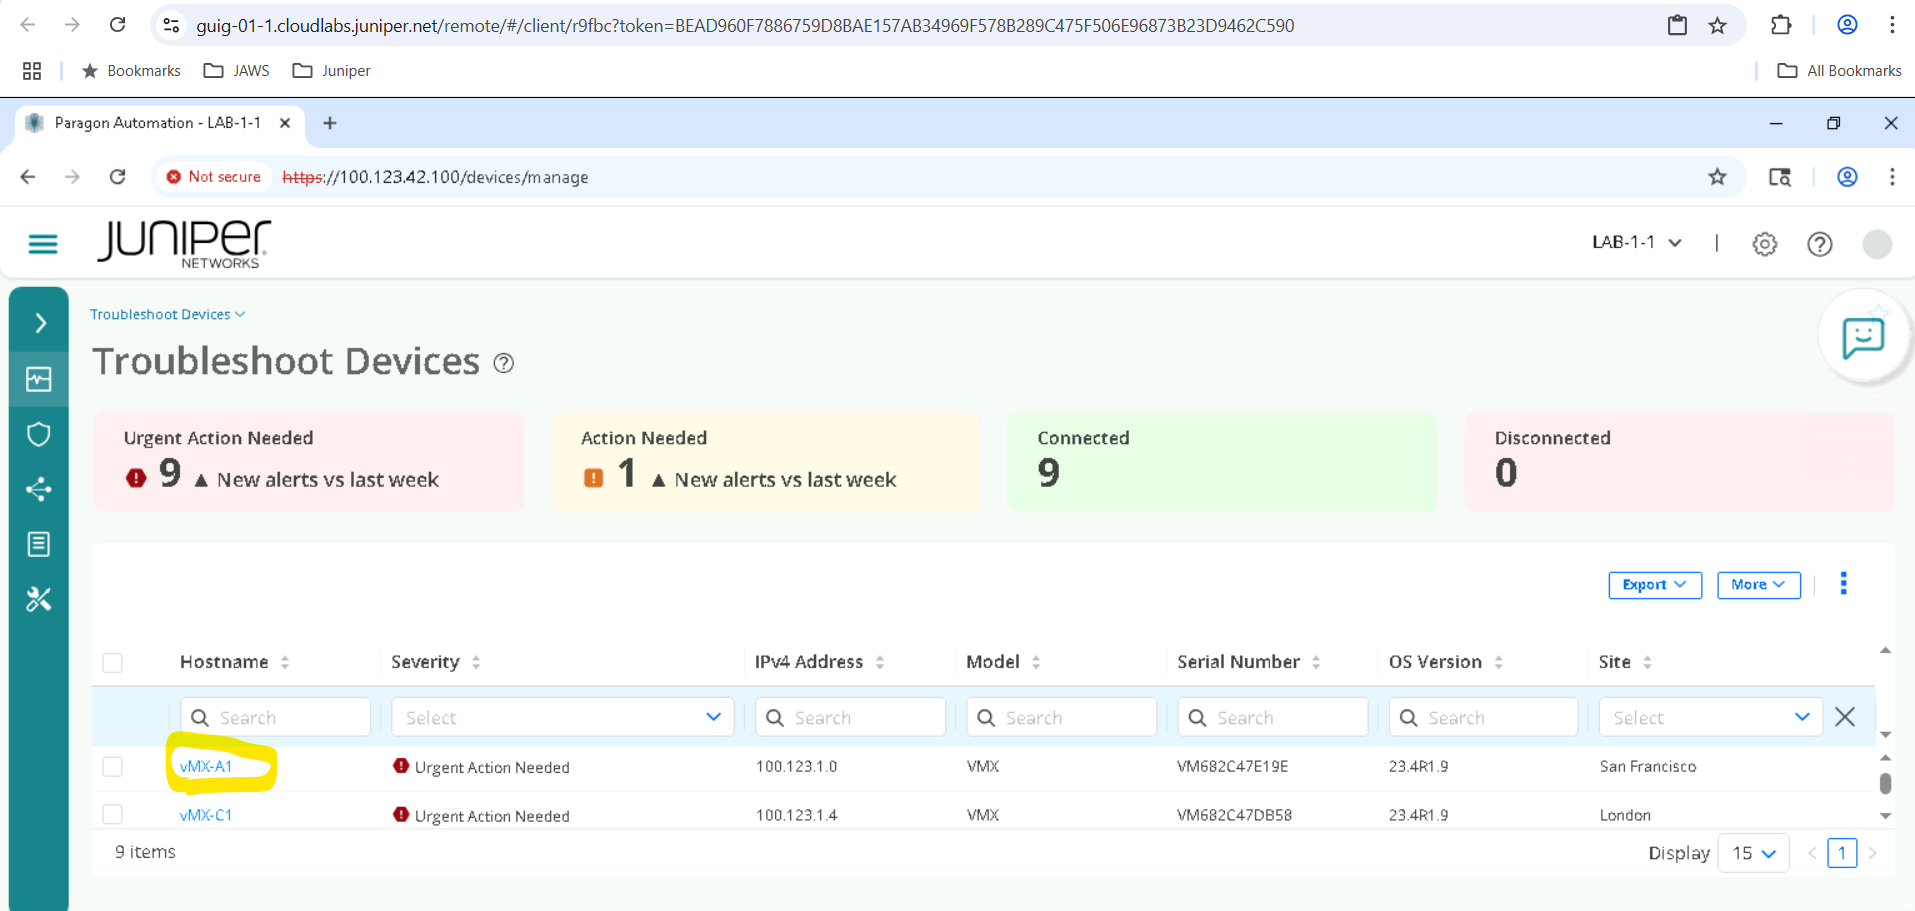
Click on the device depending on the SET allocated for example SETA will have vMX-A1, vMX-A2 .
Click on vMX-A1 for SETA, vMX-B1 for SETB and so on , based on SET allocated.
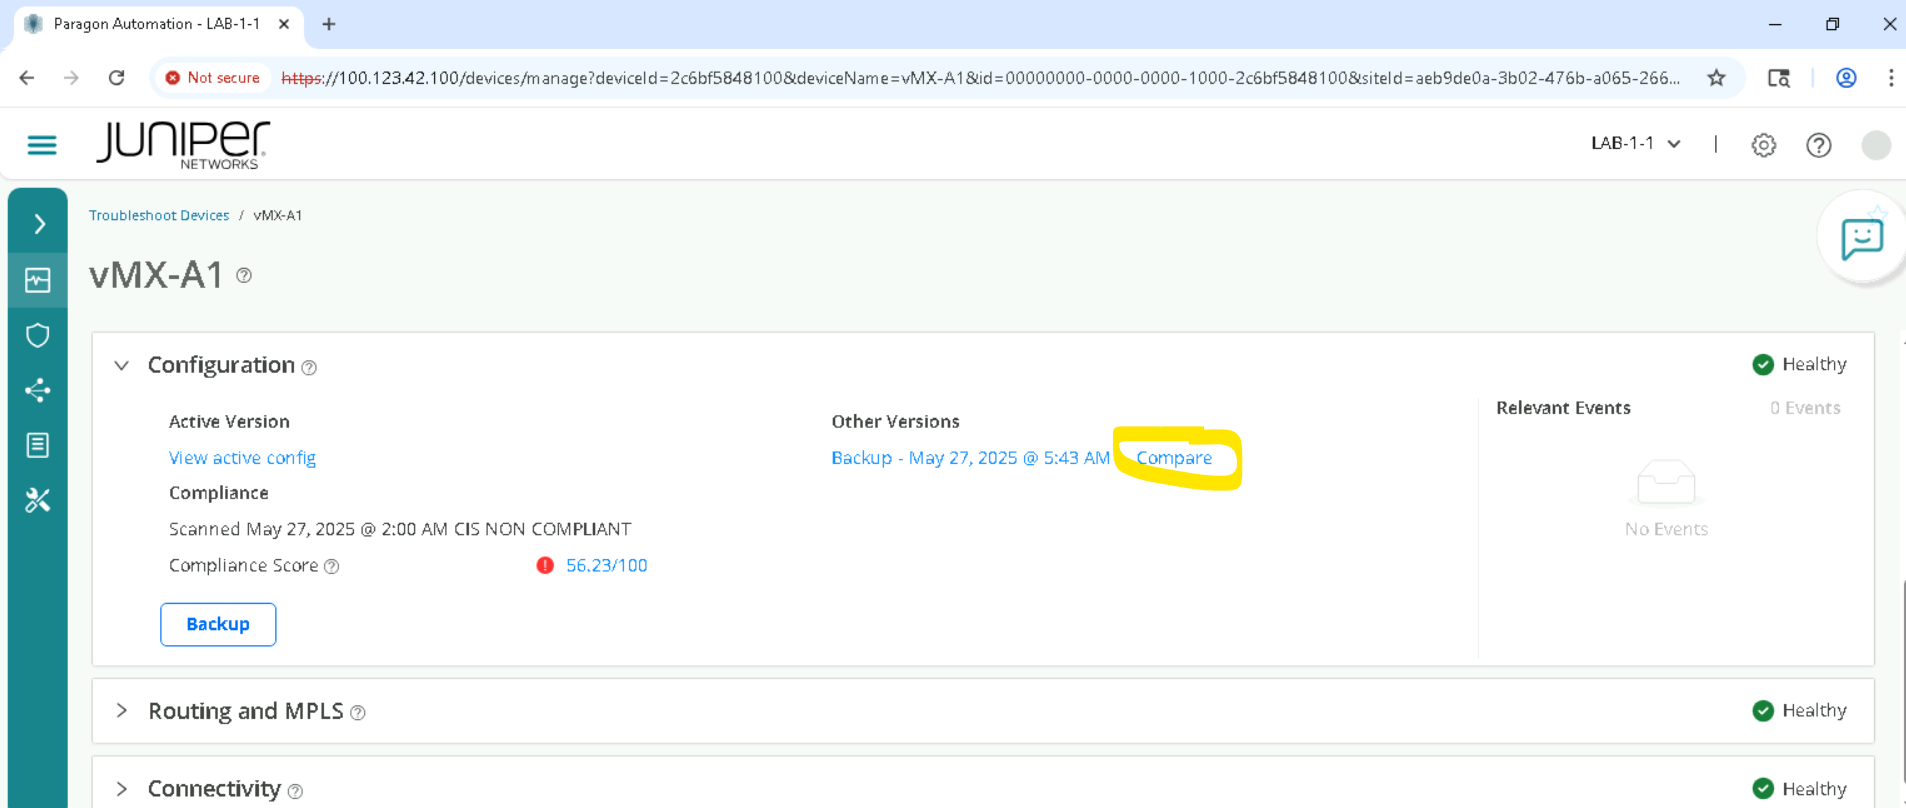
This takes us to Accordion view of the device and now we must click on Configuration
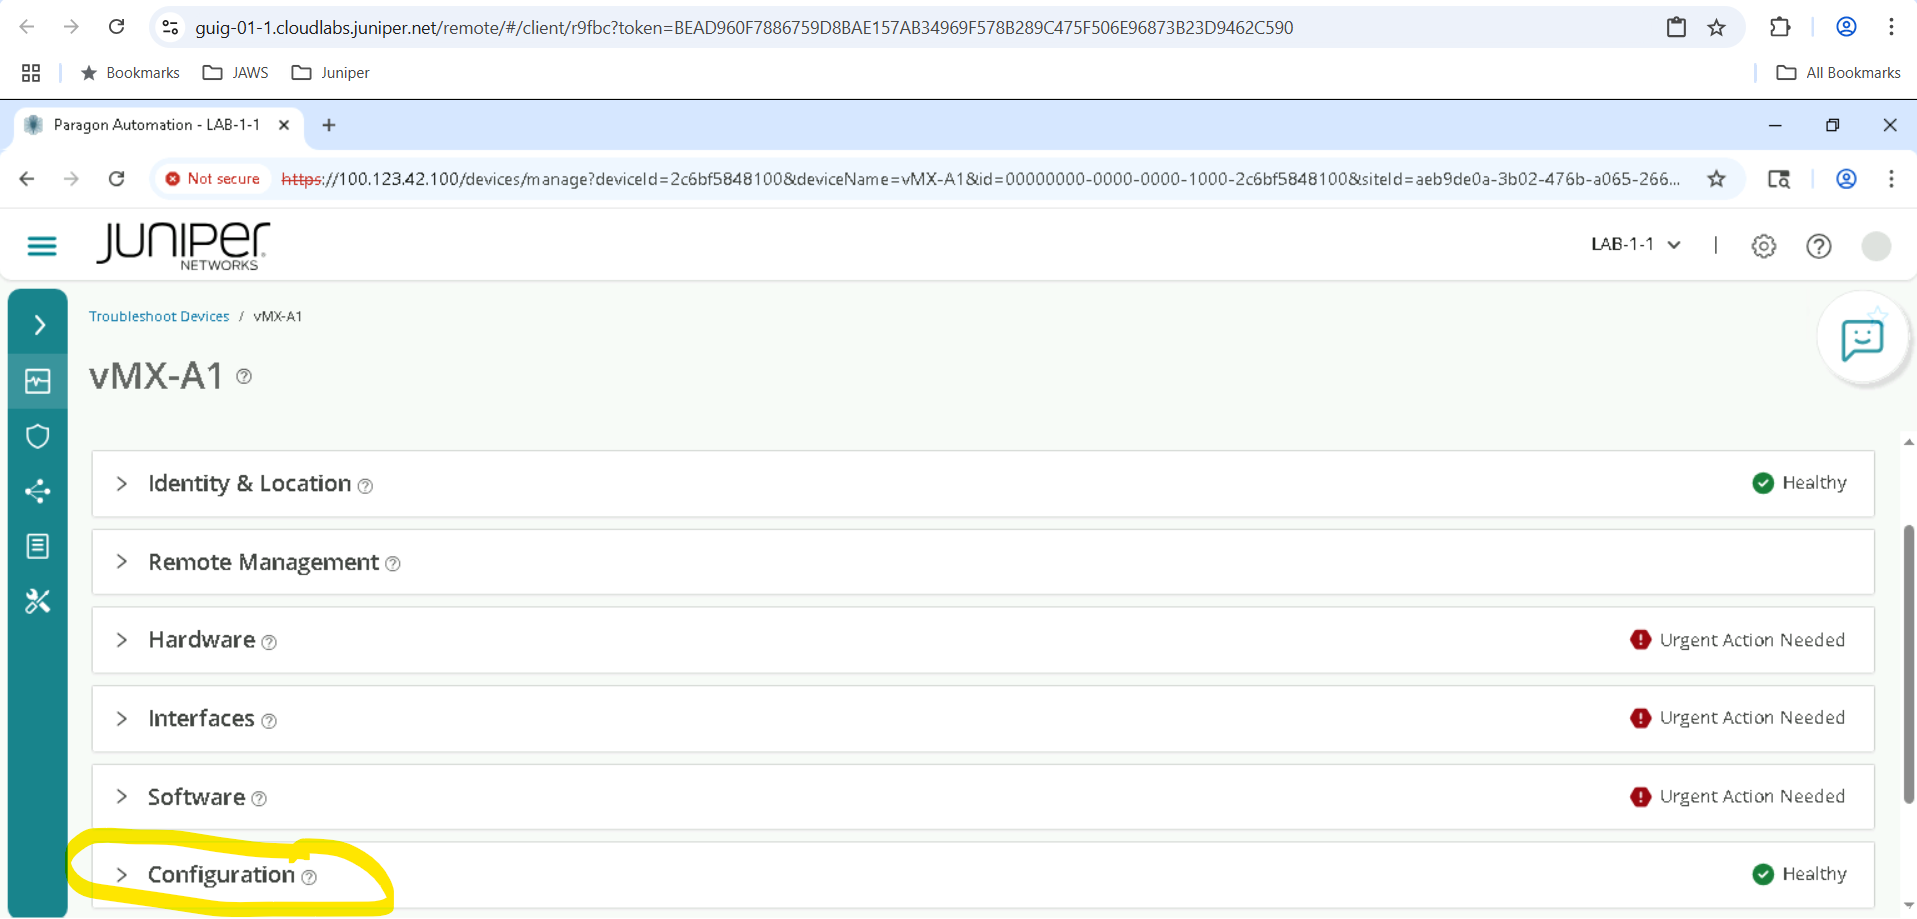
Click Configuration > Backup > OK
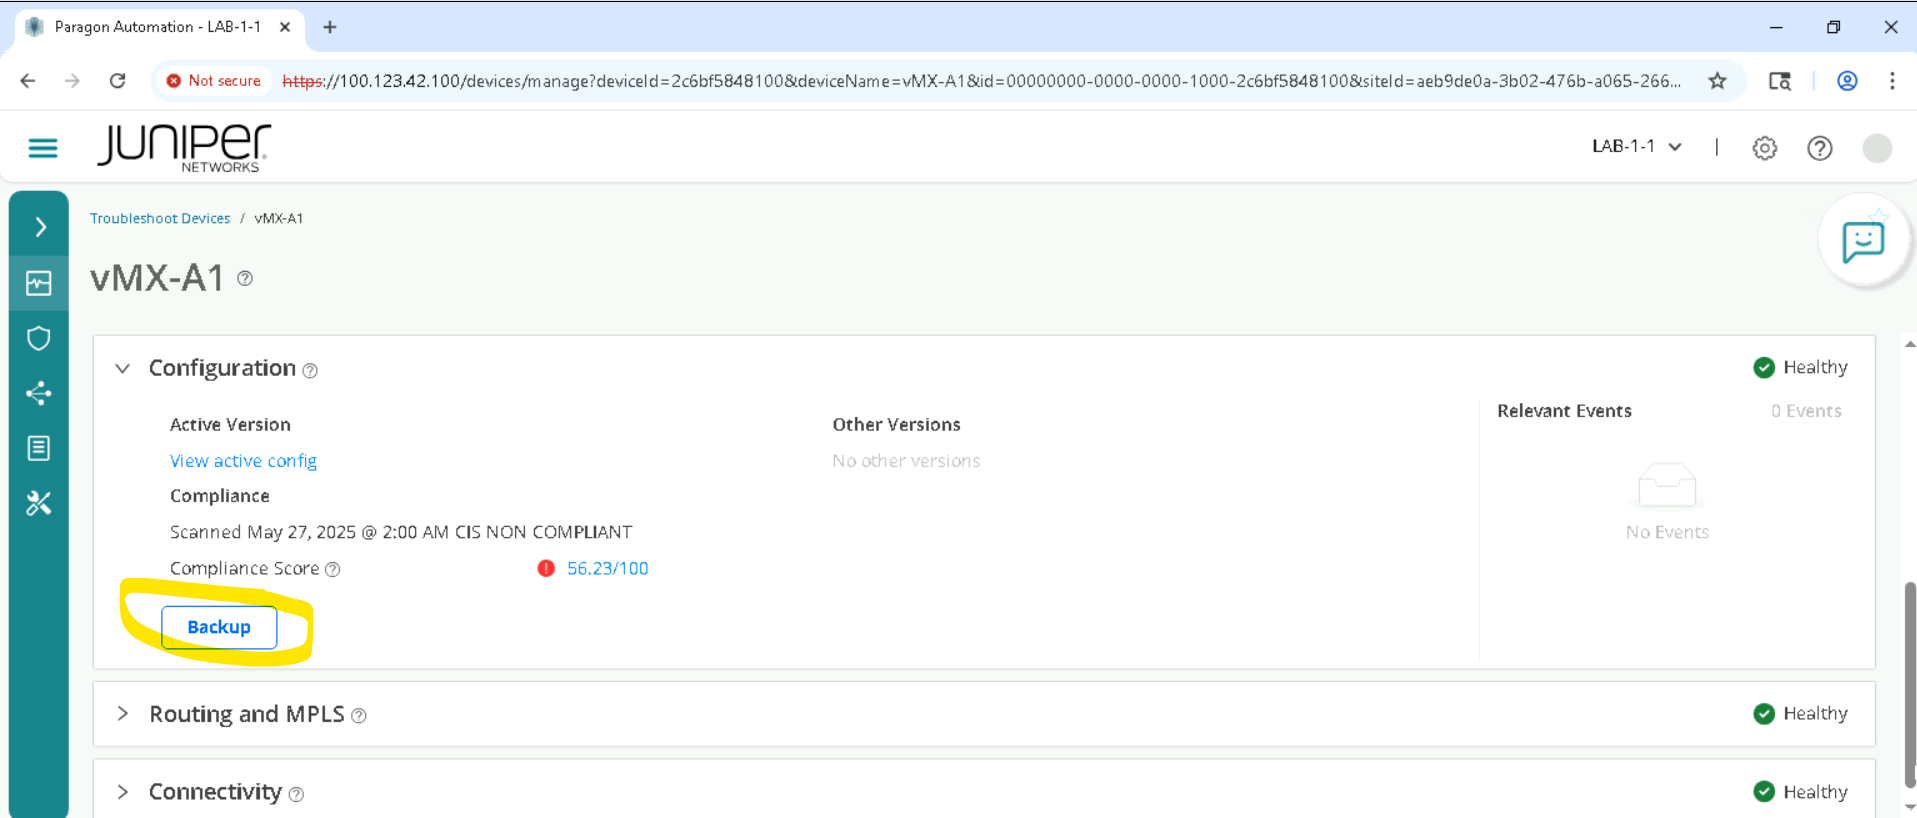
You should see the backup is completed successfully and the latest version of backup is shown with timestamp as below.
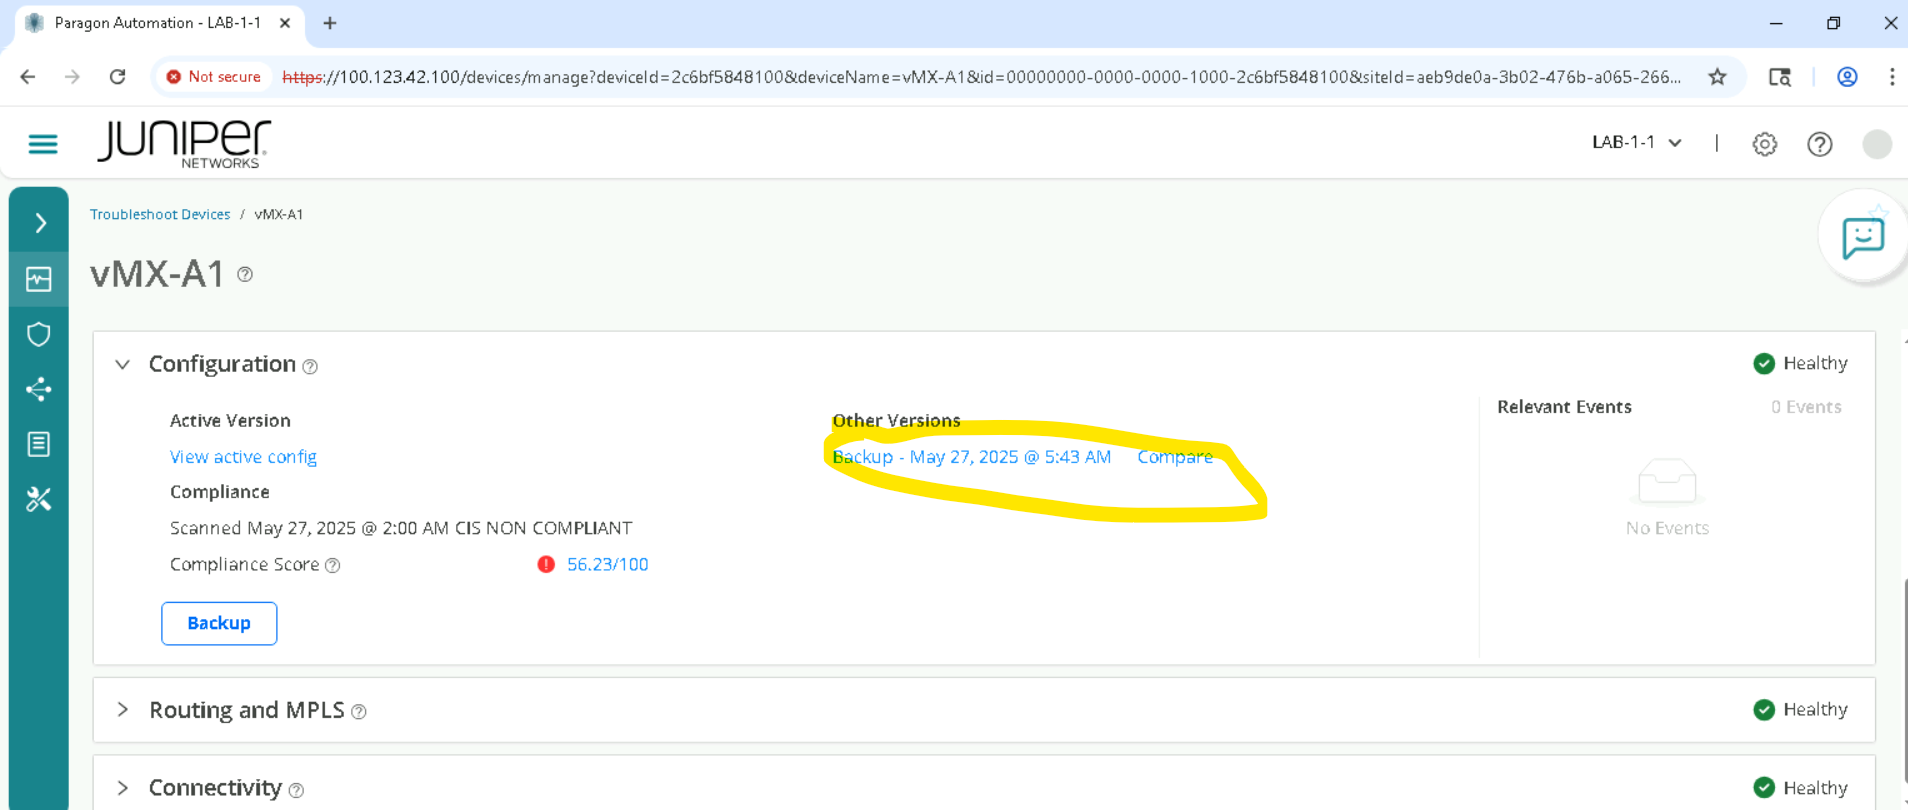
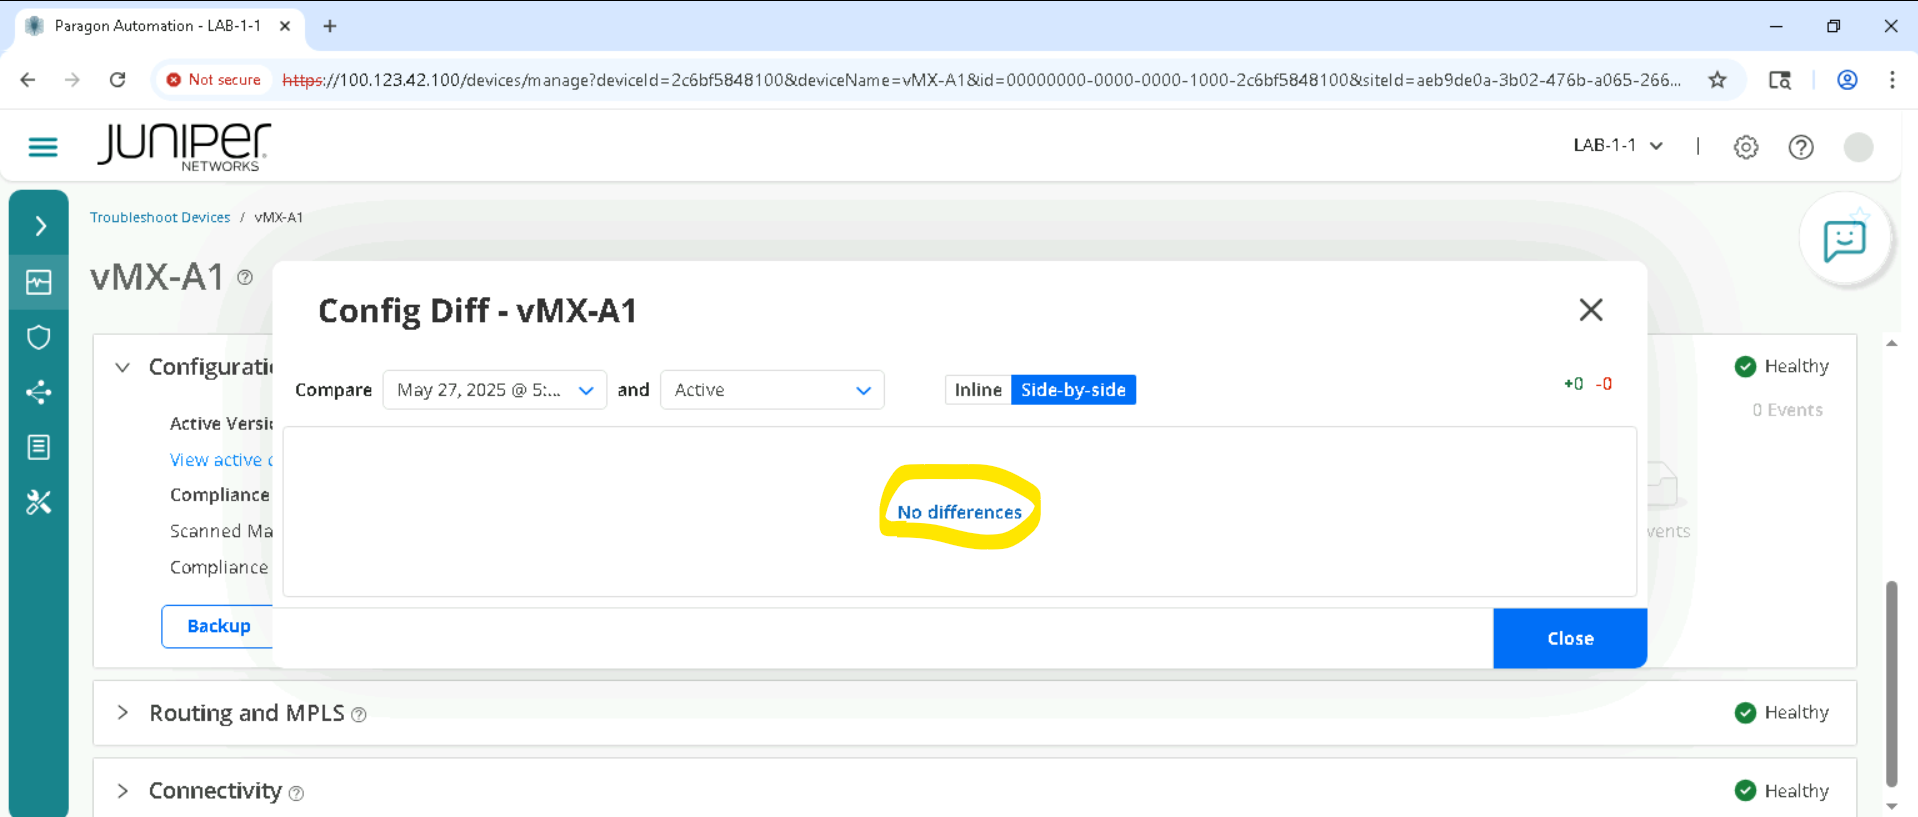
Click Compare, make sure you compare the latest version of backup and Active. you will see no difference as the Active and Backed up config are same.
Deploy A Custom Configuration Template and Track configuration changes
Please make sure we unconfigure the template config by following all the steps to the end.
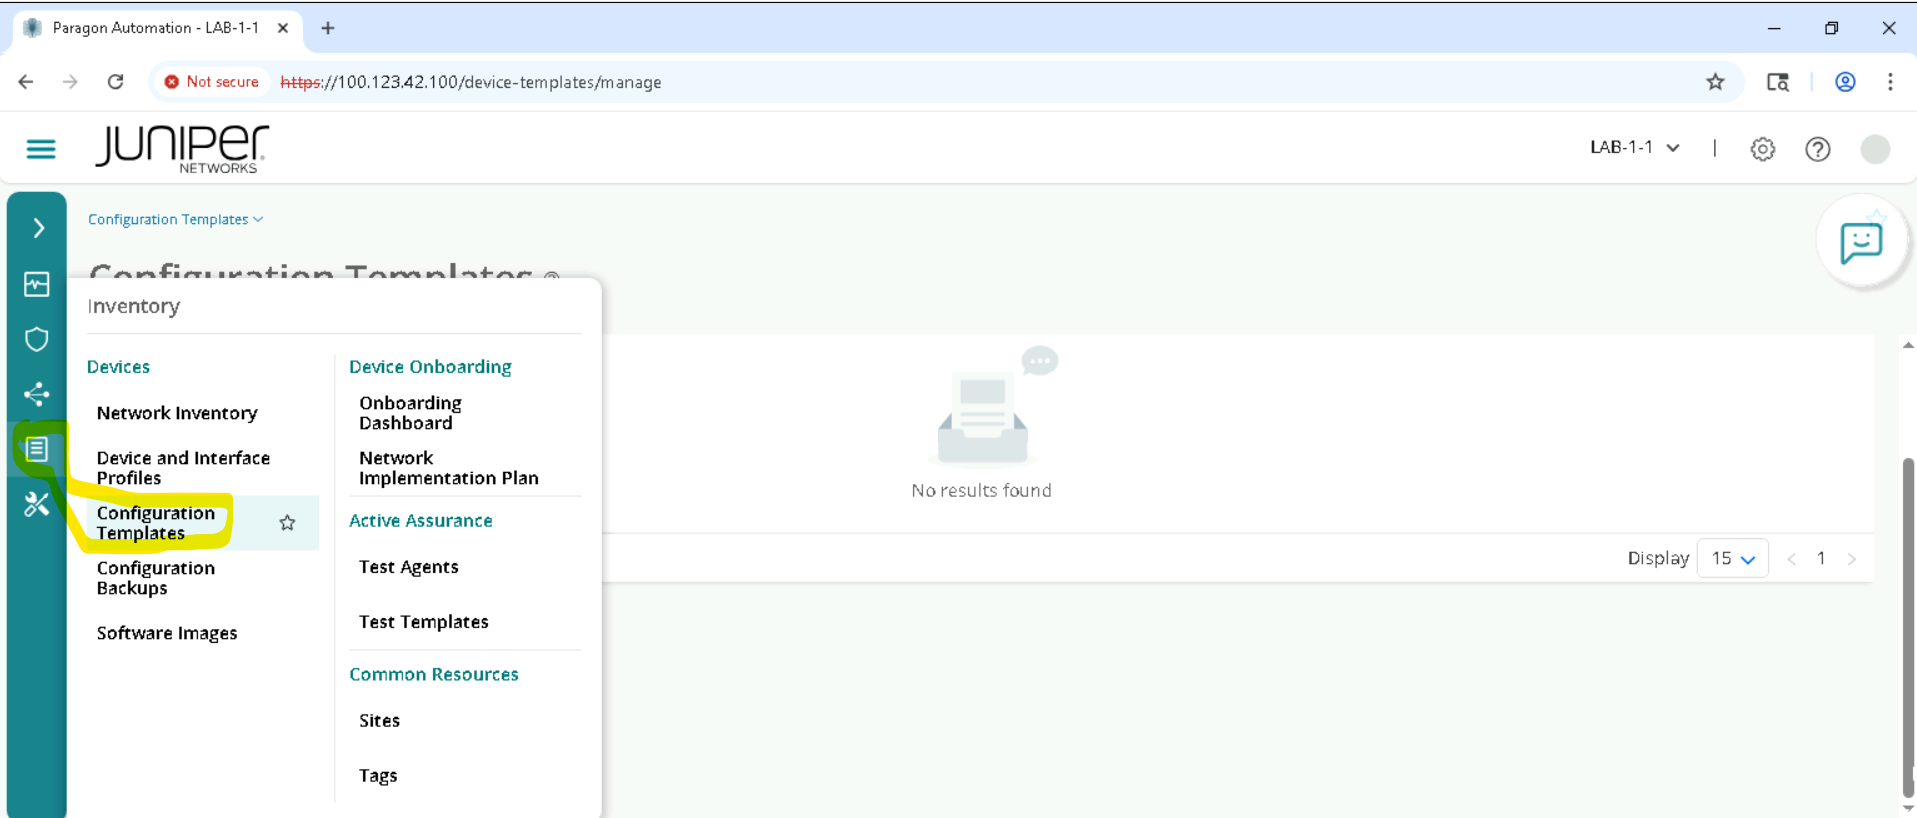
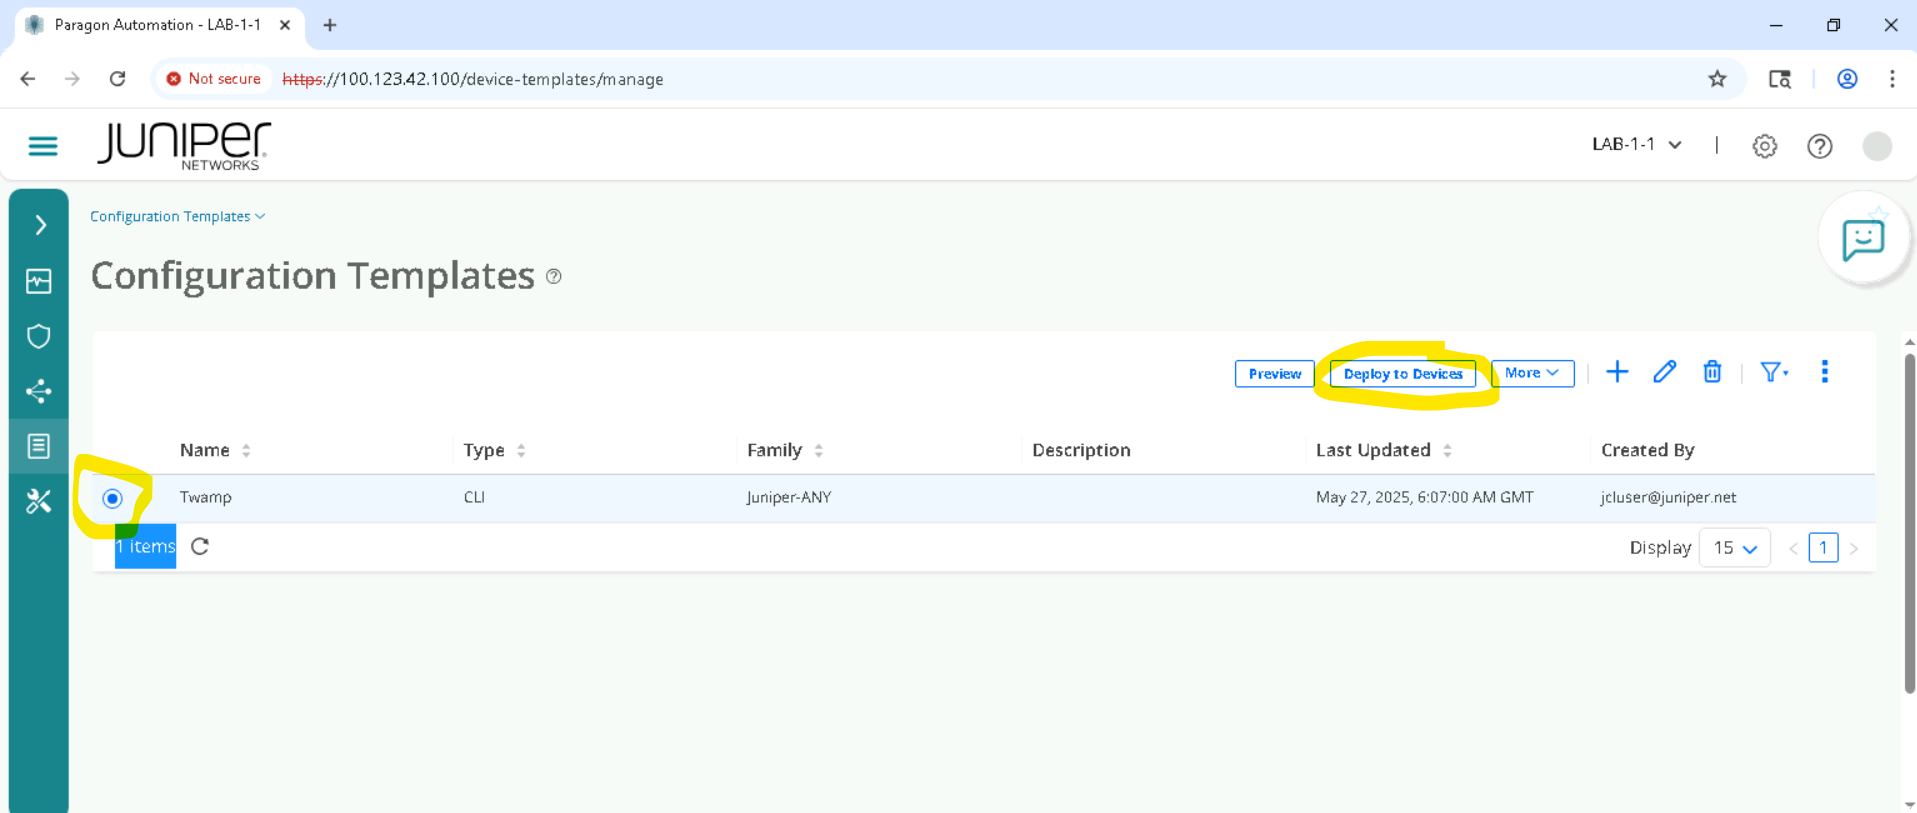
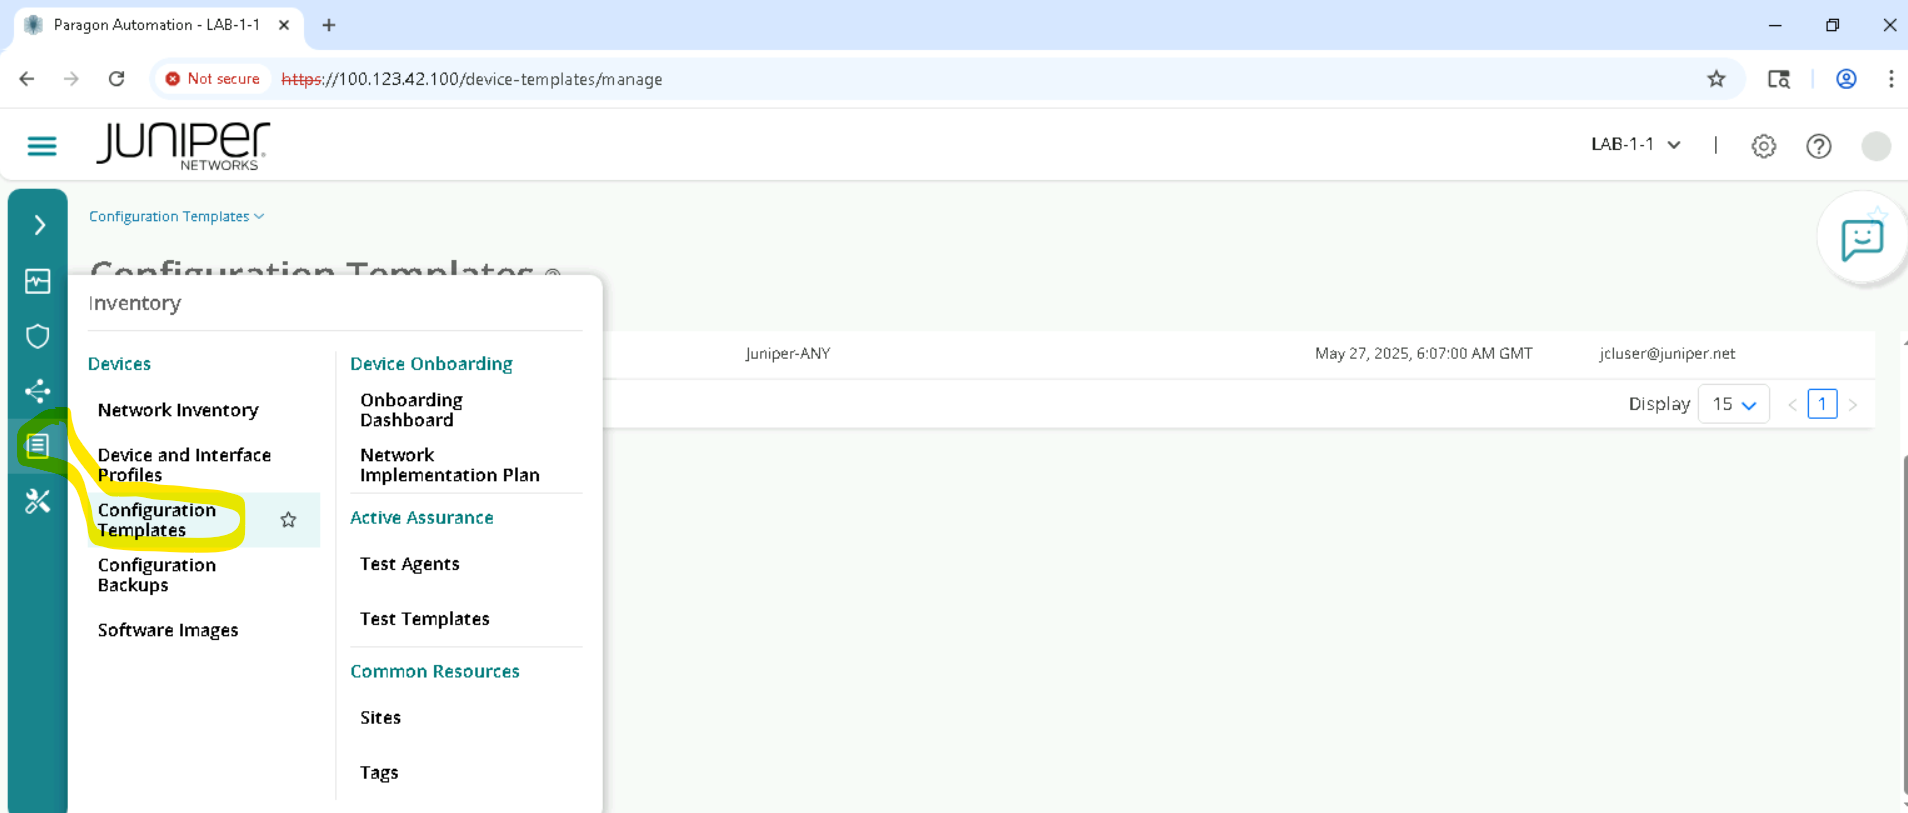
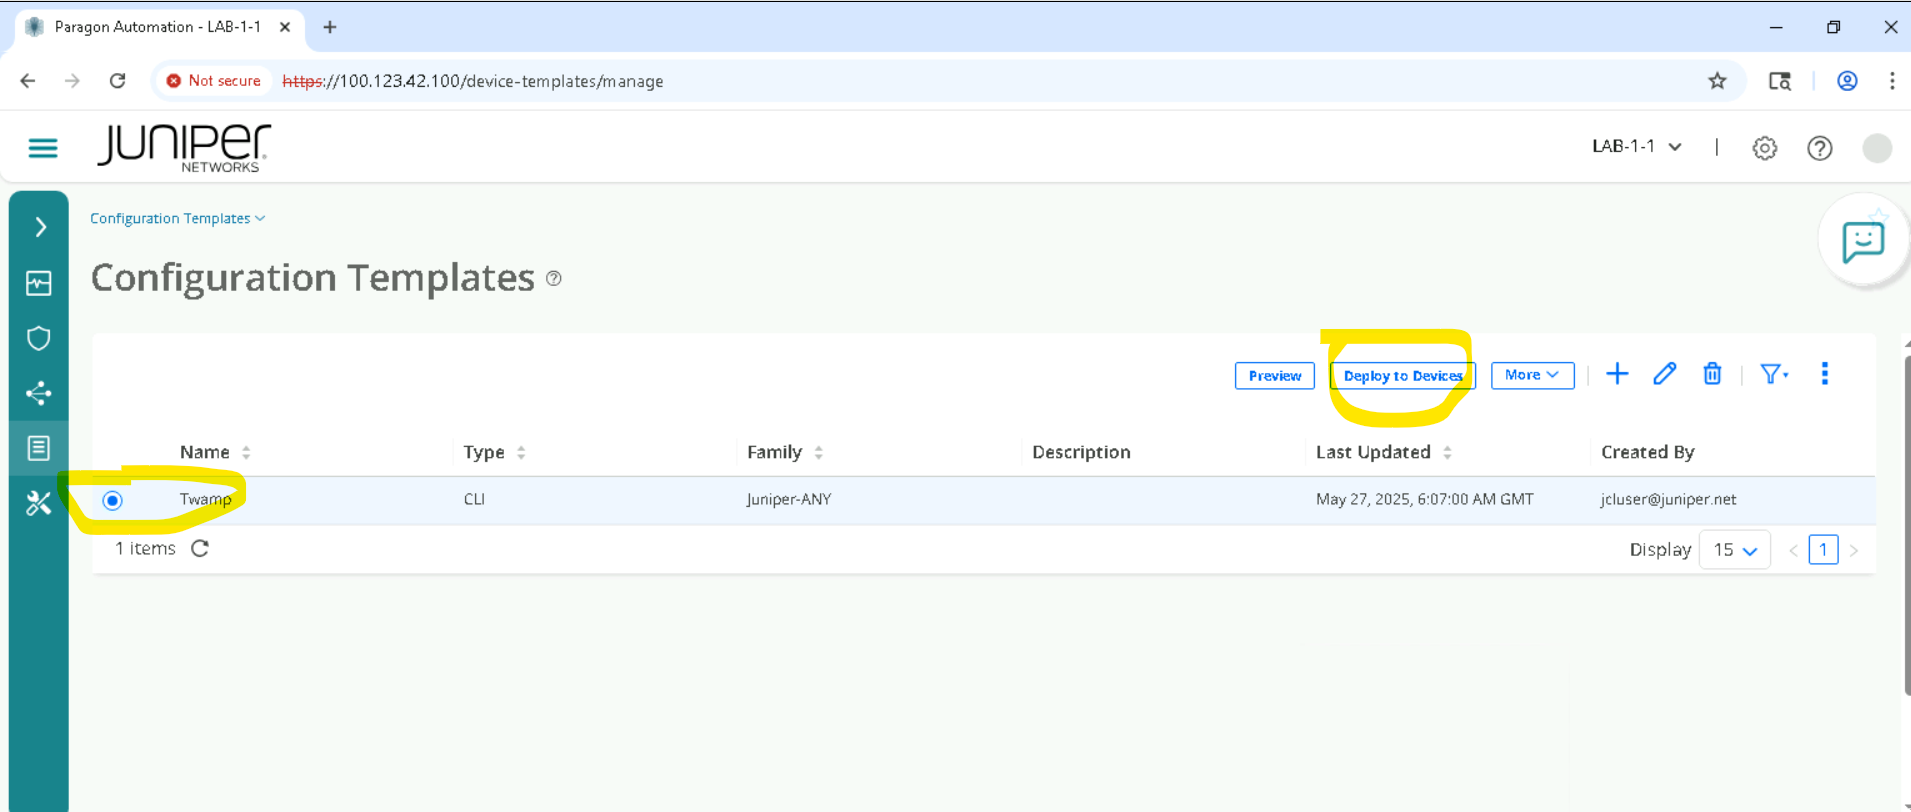
Click Inventory > Configuration Templates, and select the Template Twamp
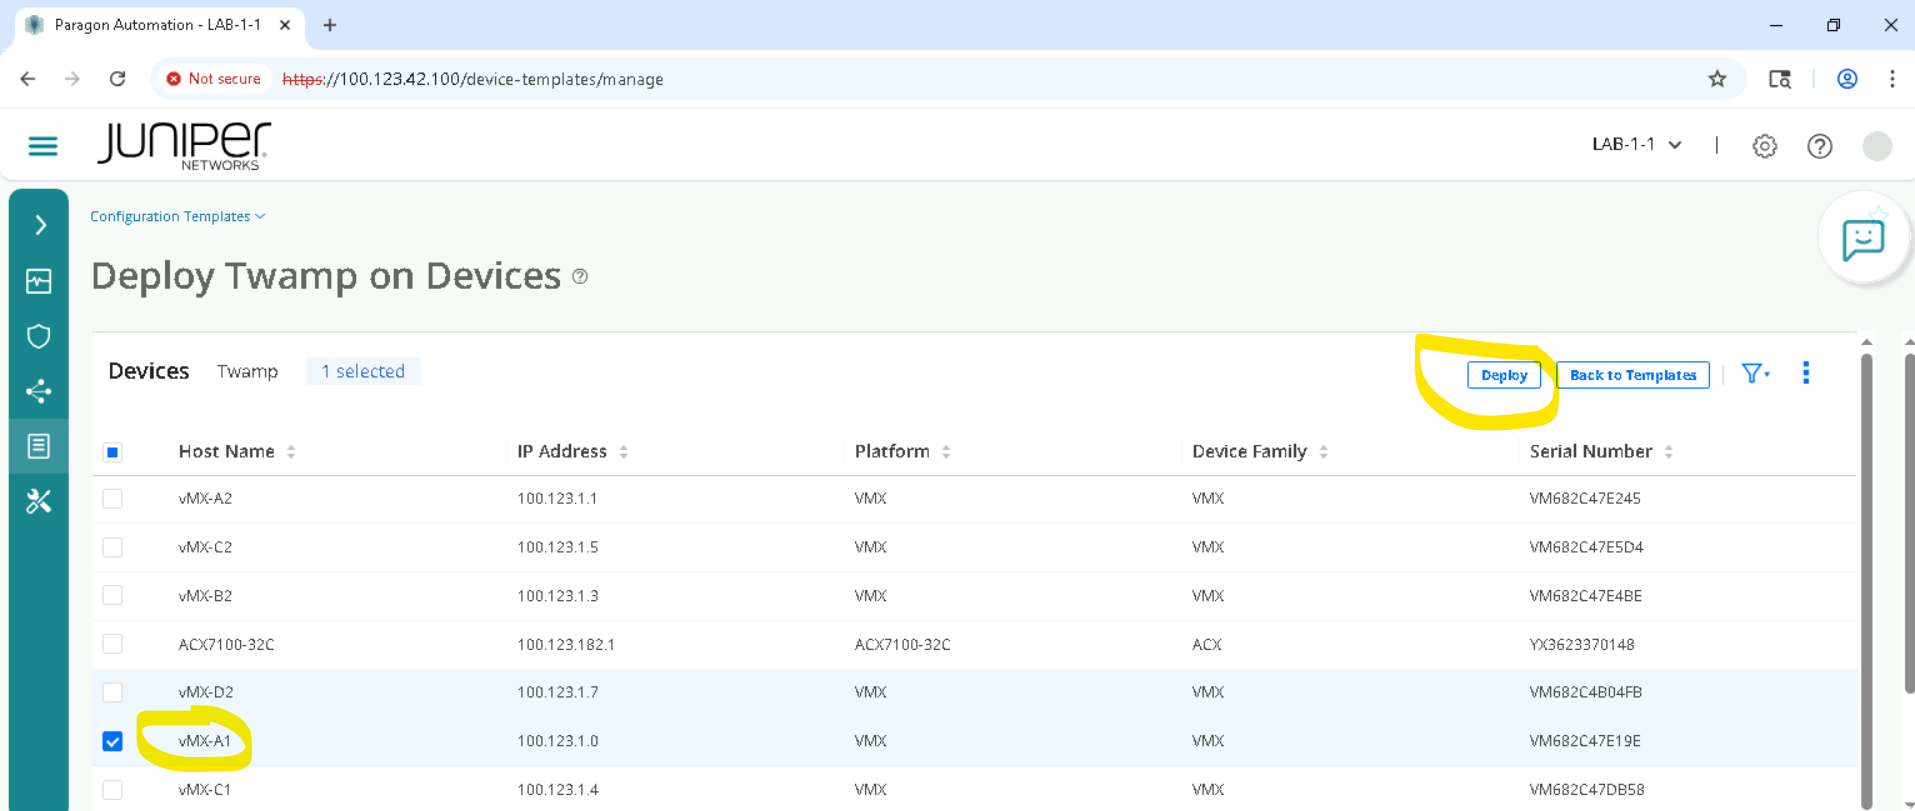
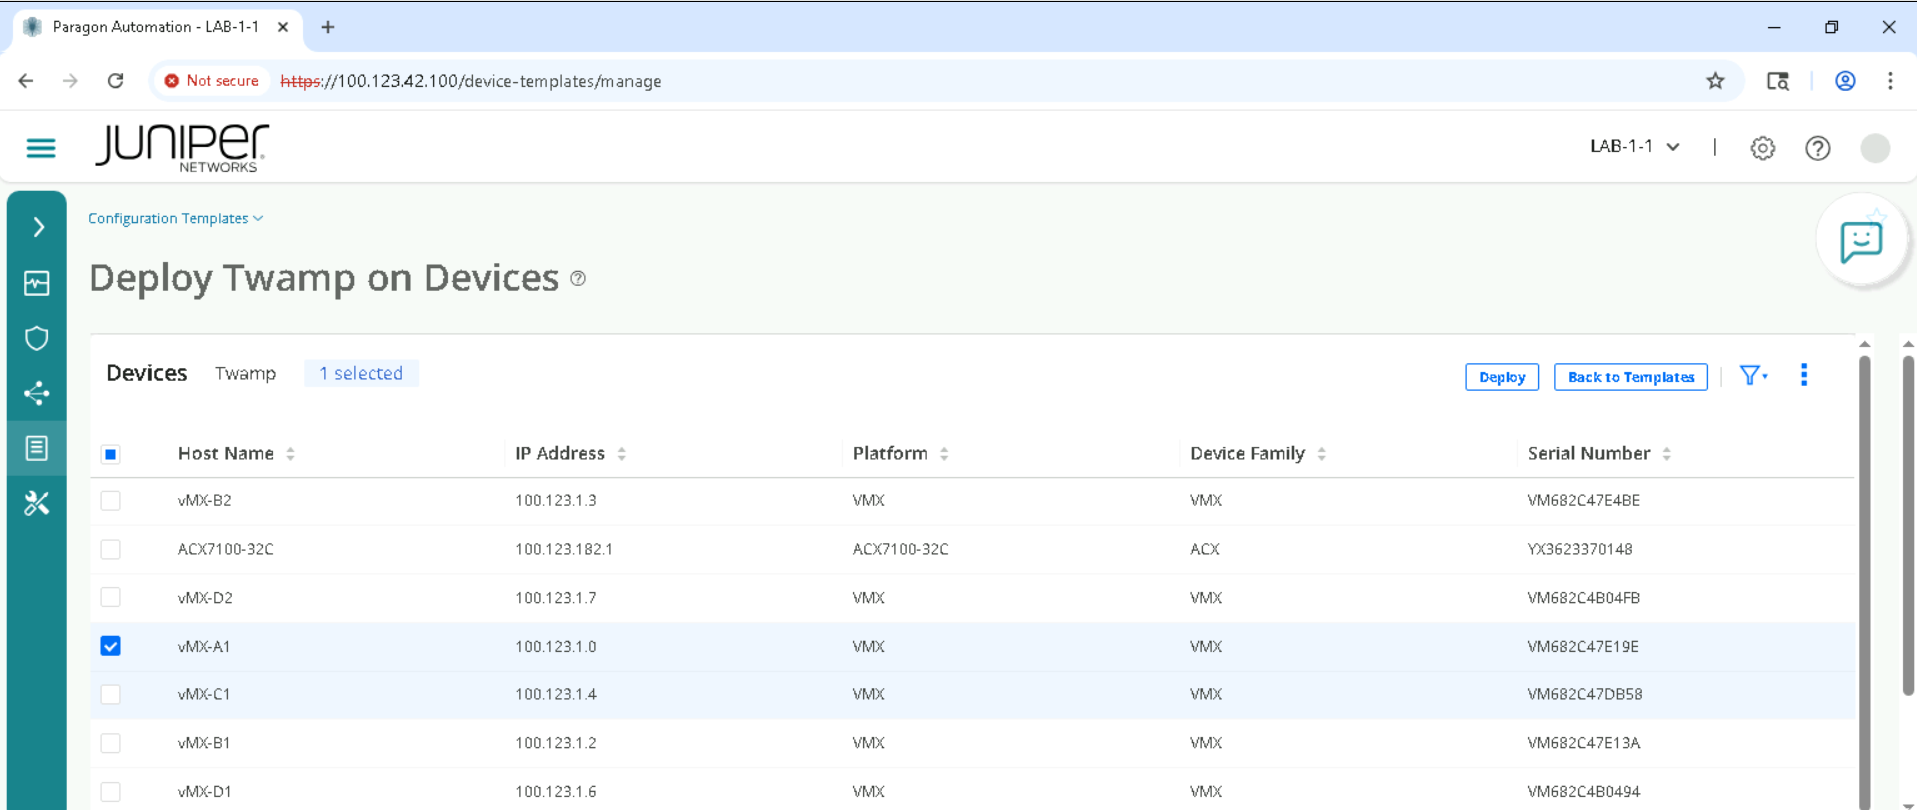
Make sure to select the correct device as per set allocated , for example for SETA , select device vMX-A1 , for SETB vMX-B1 and so on.
Expand the Device Parameters to be provided, by clicking on as below
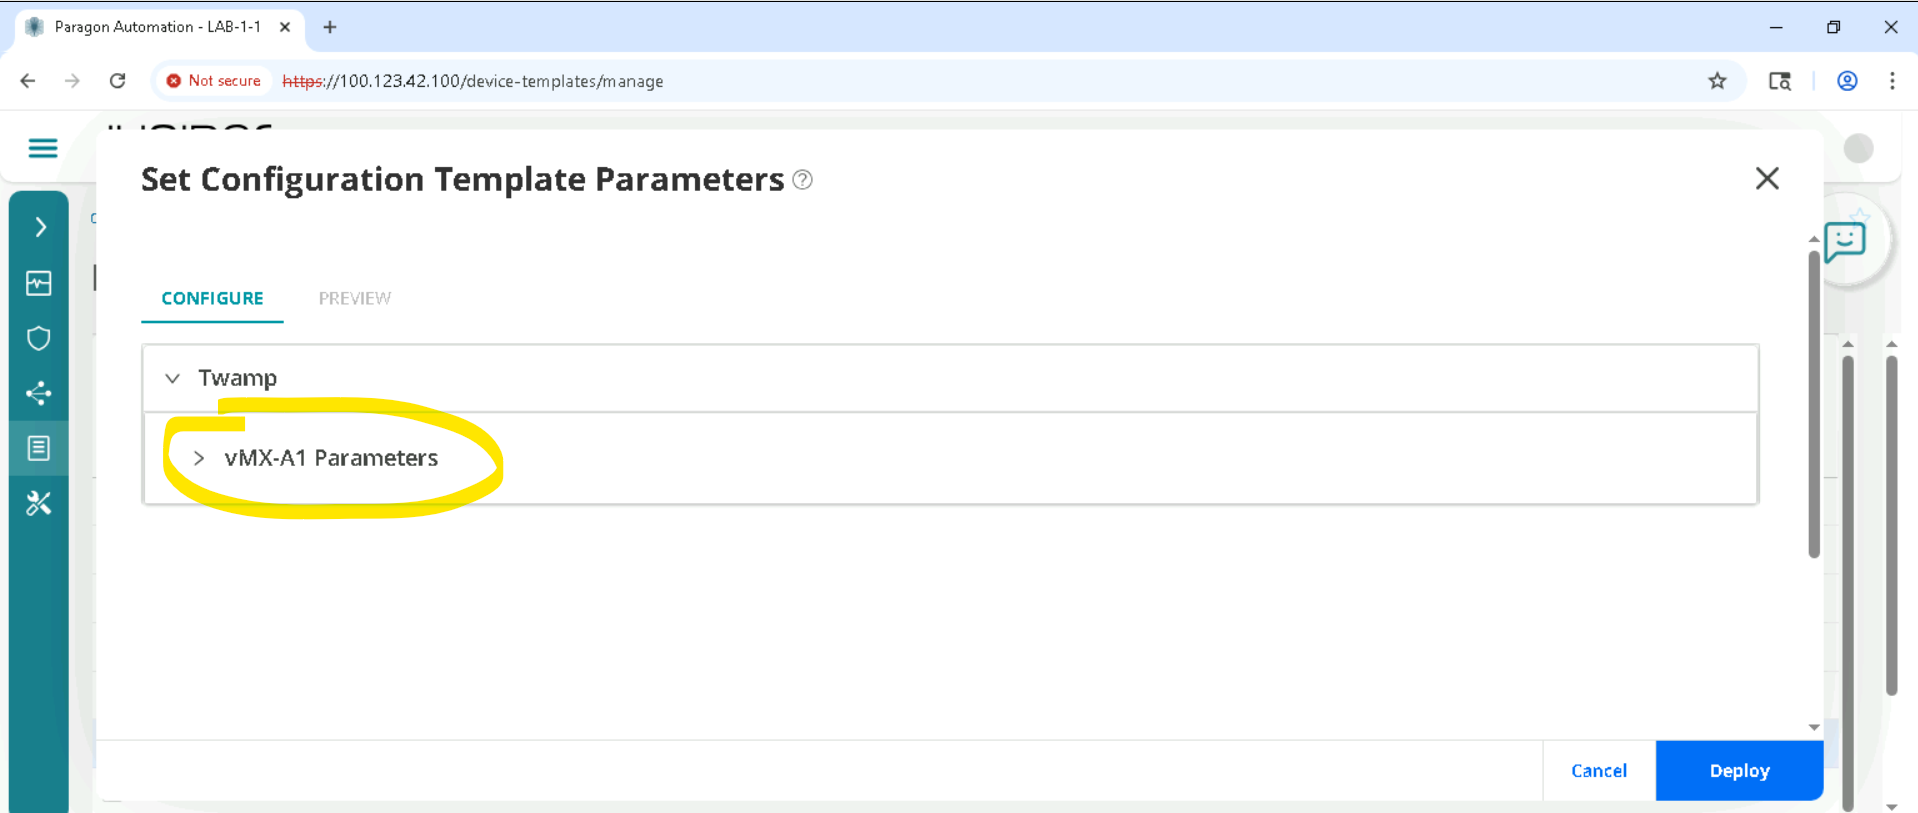
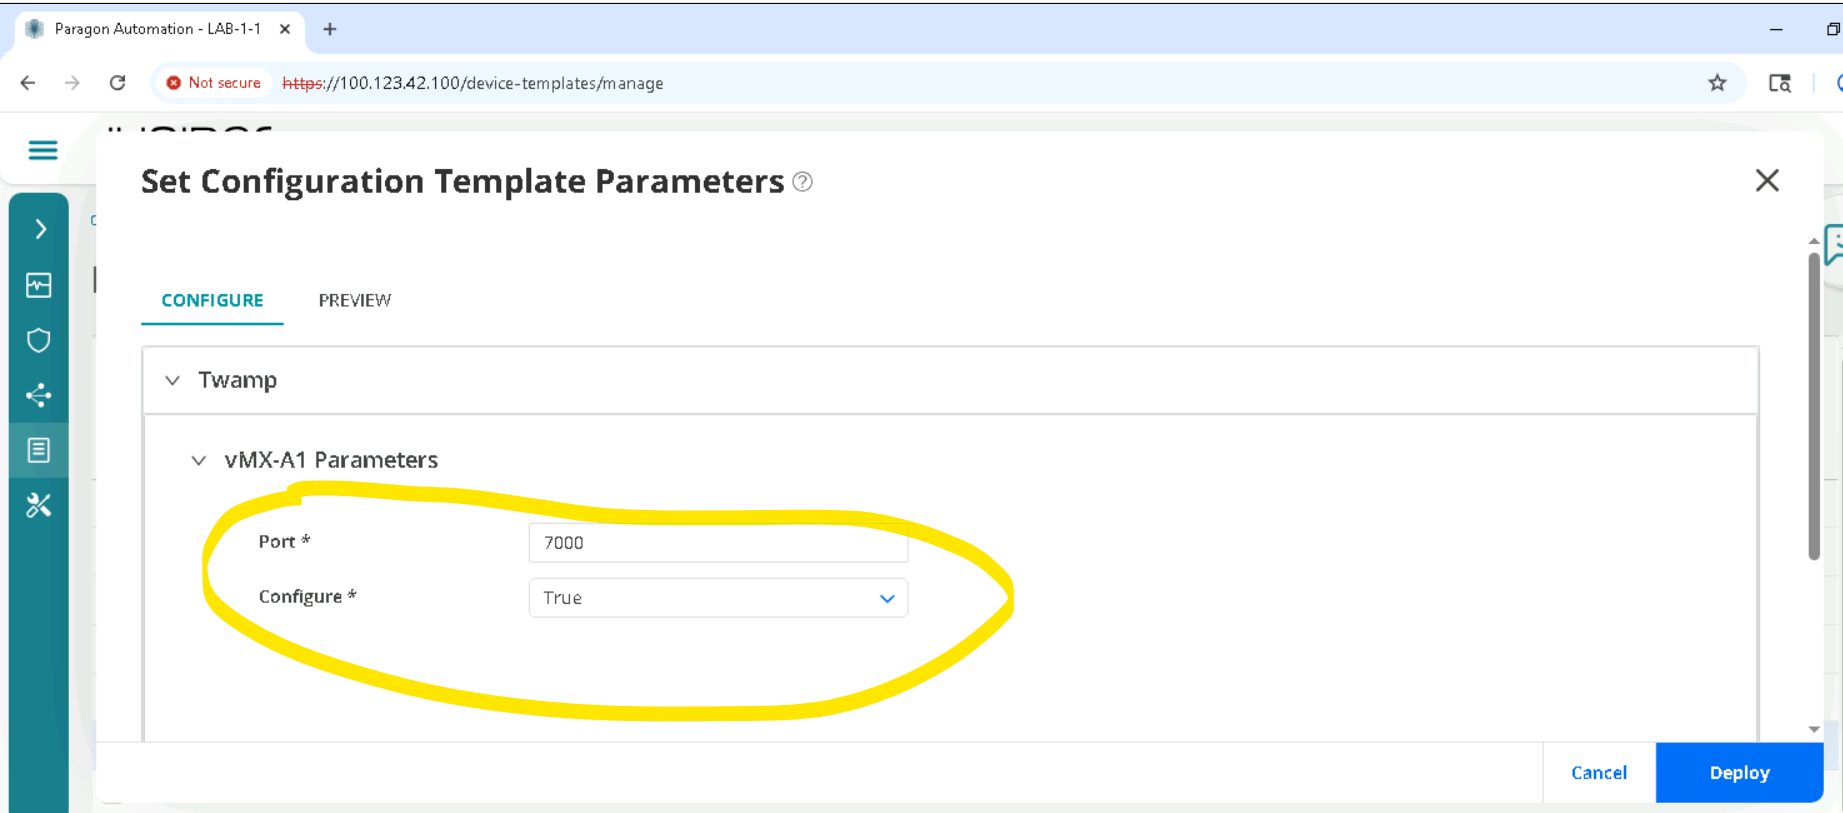
There is no need to change the default , Configure True will configure Twamp, if we set it to False , Twamp config will be removed. Now we want Twamp to be configured so we let it default. Click Deploy
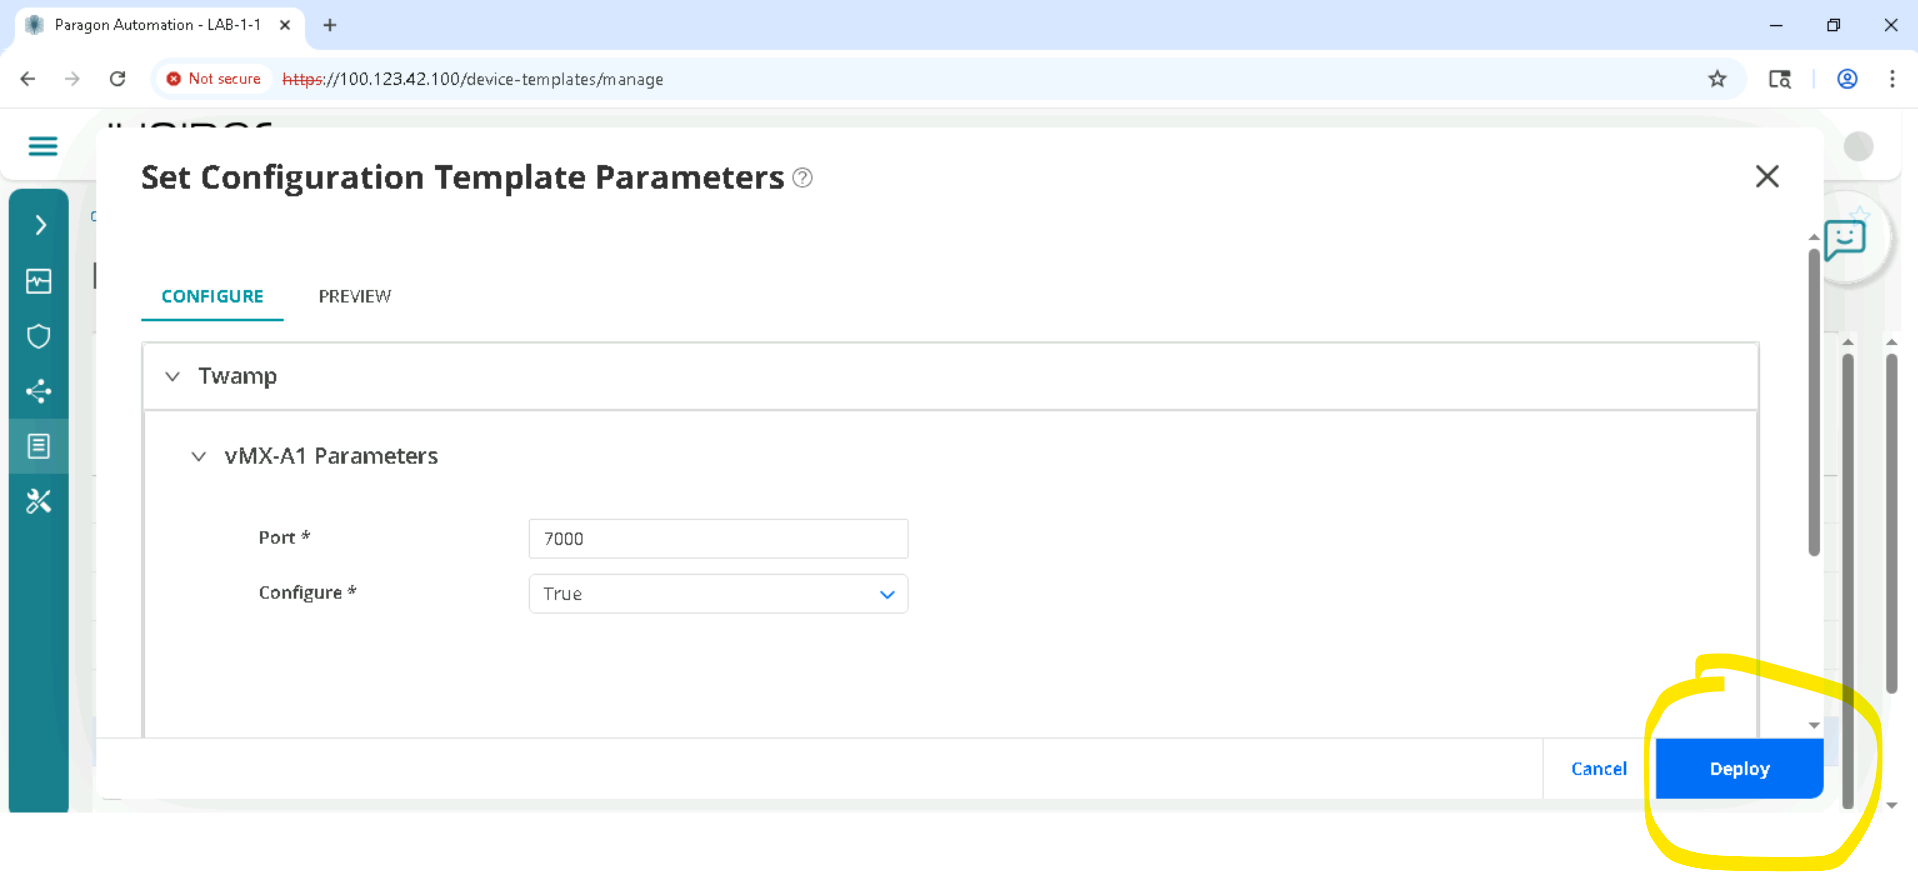
Click Deploy to devices if prompted are you sure to deploy, please click yes.
Wait for 2 mins and click Inventory > Troubleshoot devices, clear the Severity filter as in Step (2) , so all devices will be listed.
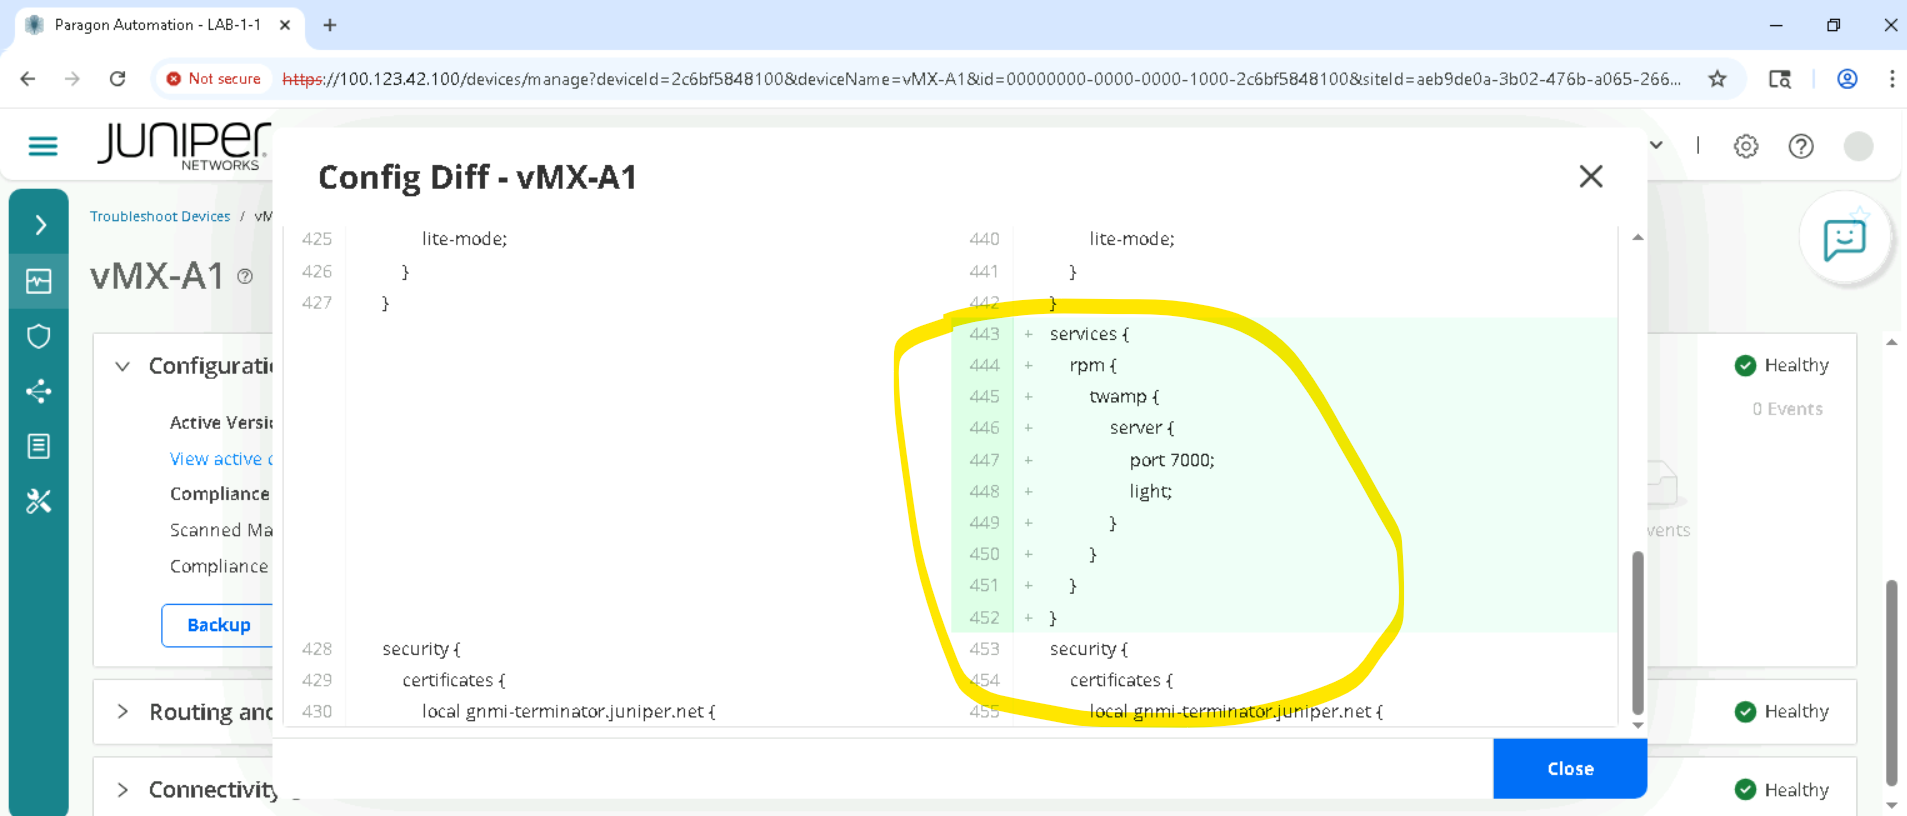
Click on the device, for SETA it will be vMX-A1 and so as to go to Accordion view and click Configuration > Compare
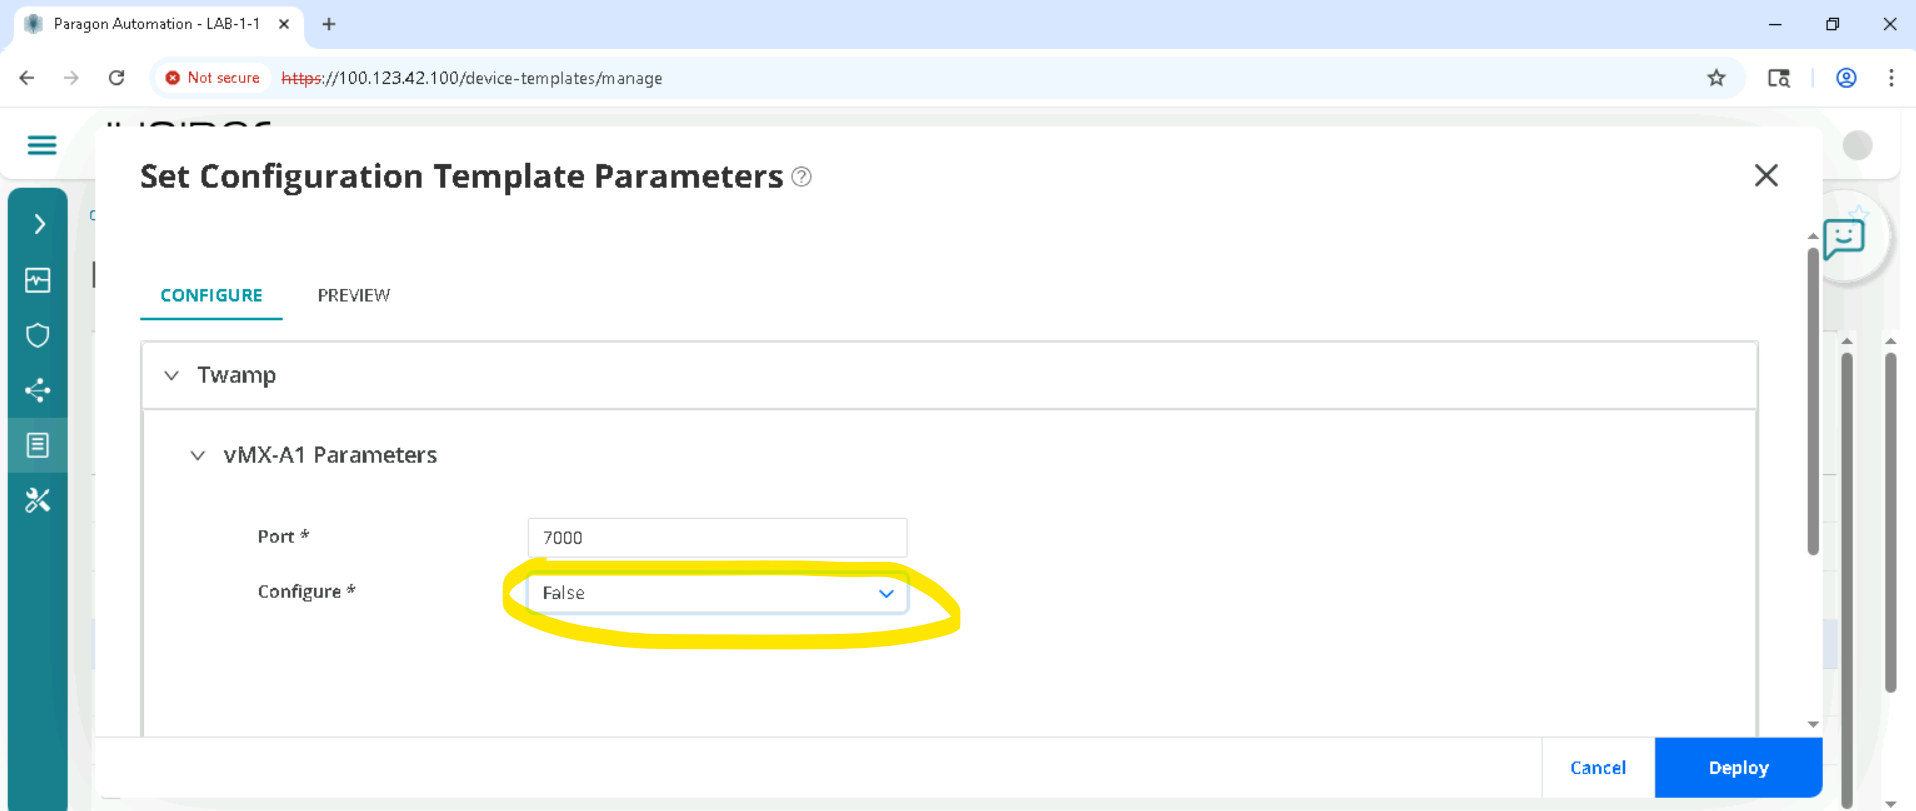
Delete the configurations using the same config template . we have to make sure this step is executed so that we don’t impact the lab. Goto Inventory > Configuration Templates, Select the template and Deploy to devices
Select the correct device and Deploy
Make sure to select Configure -> False , this will unconfigure Twamp.
Review Audit Logs
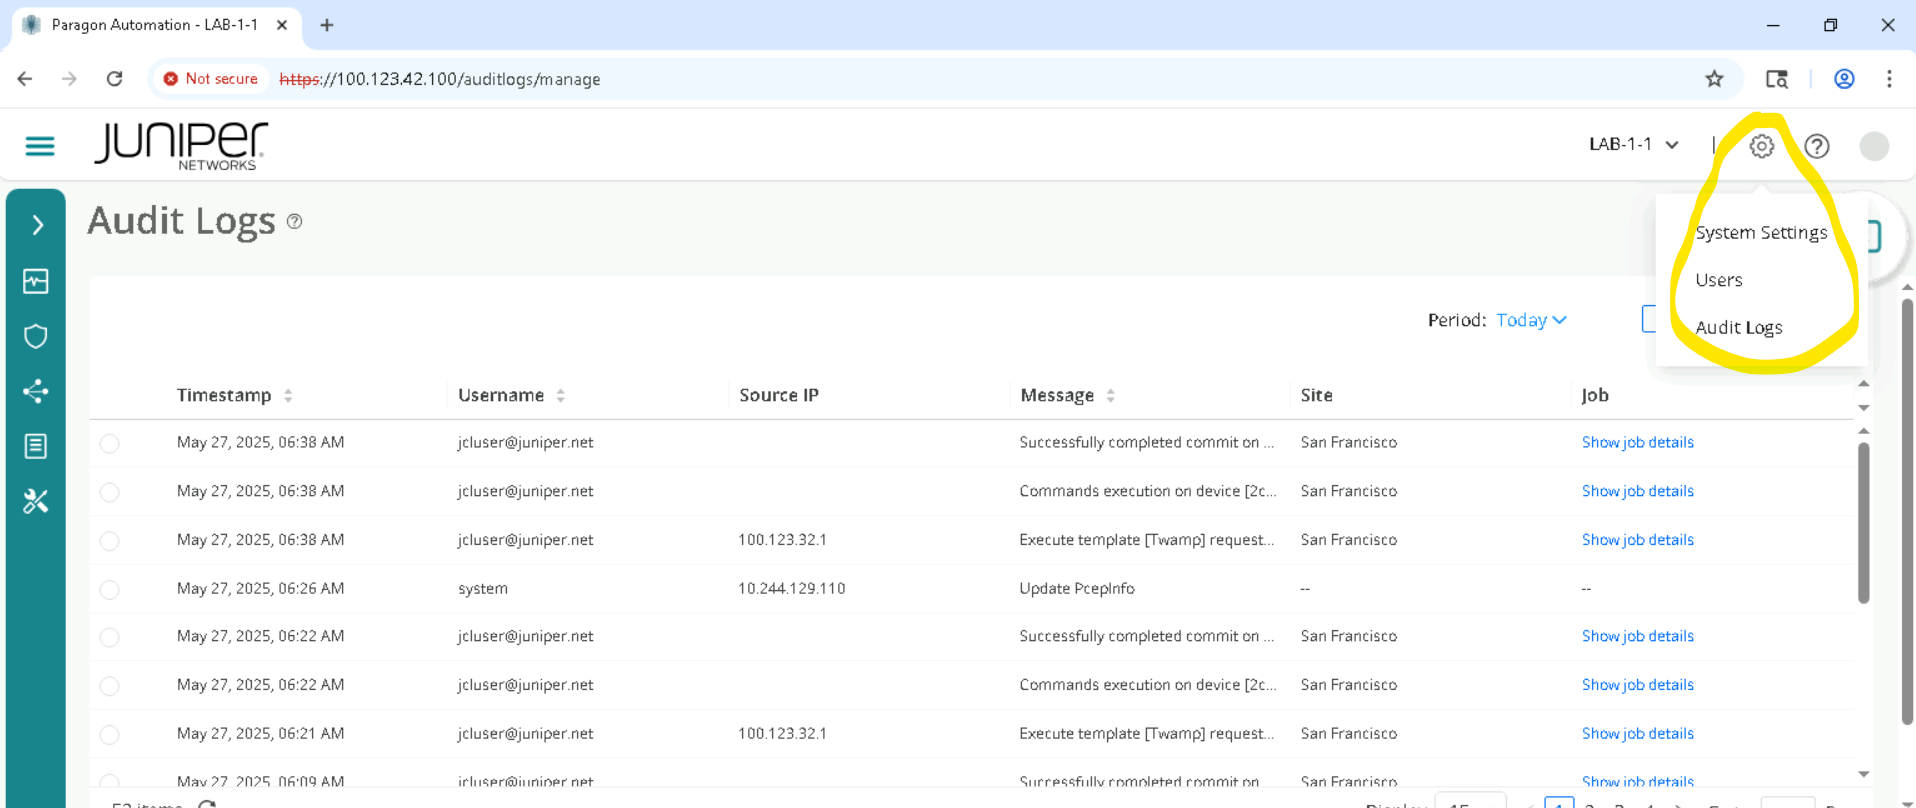
Navigate to Settings > Audit Logs
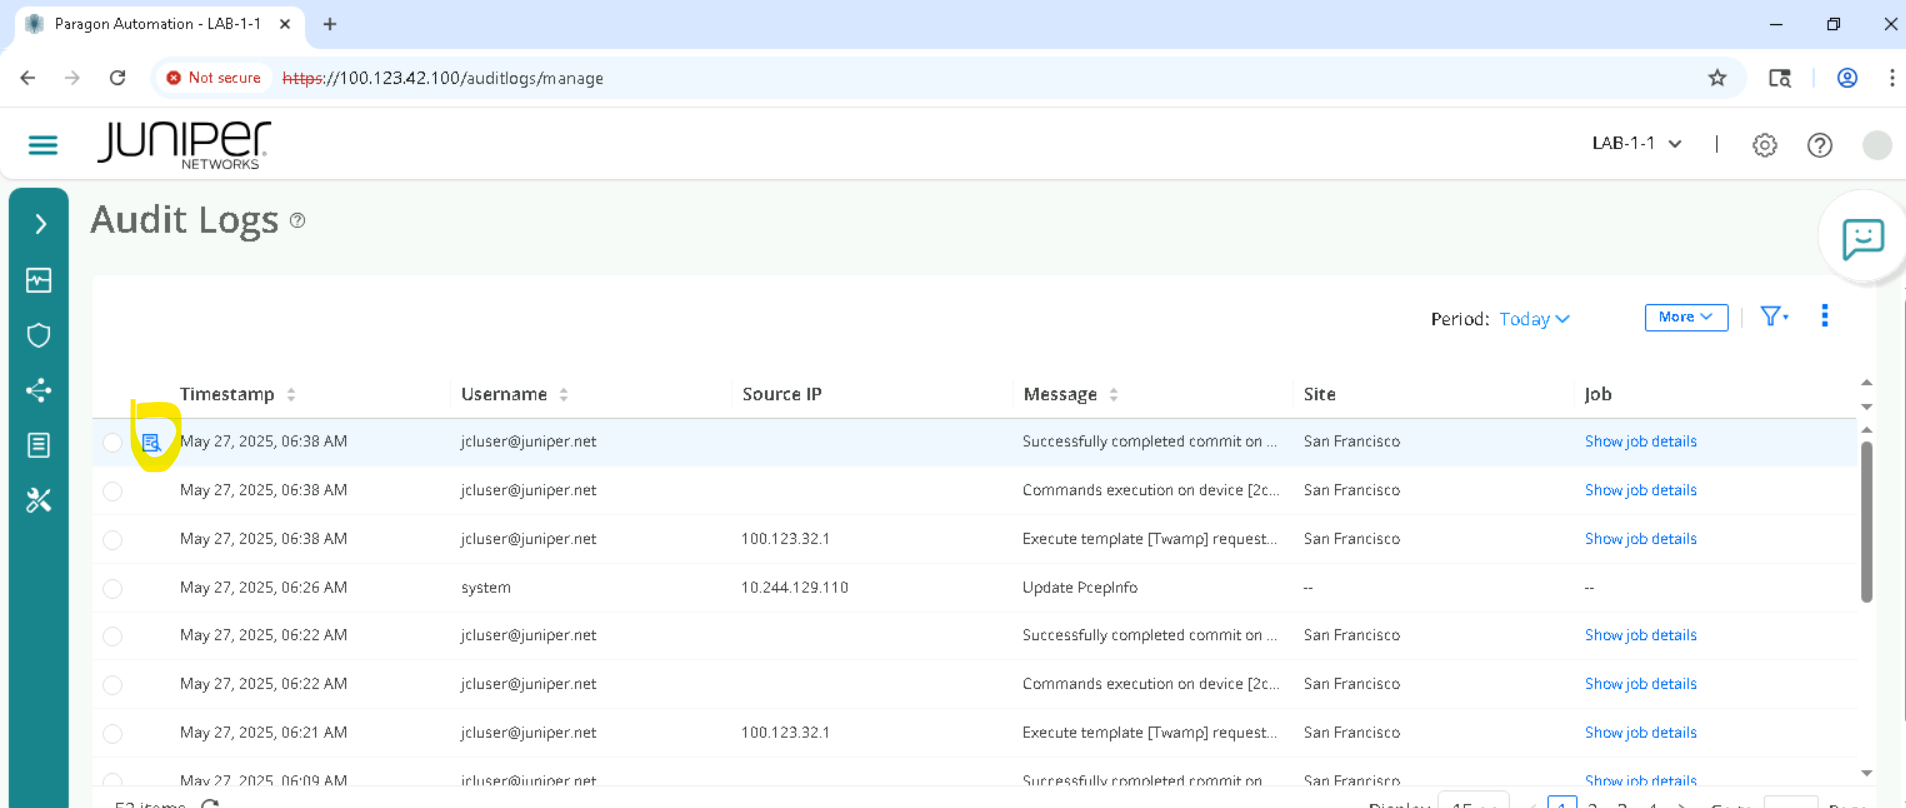
Select a job (any job) and click More > Detail.
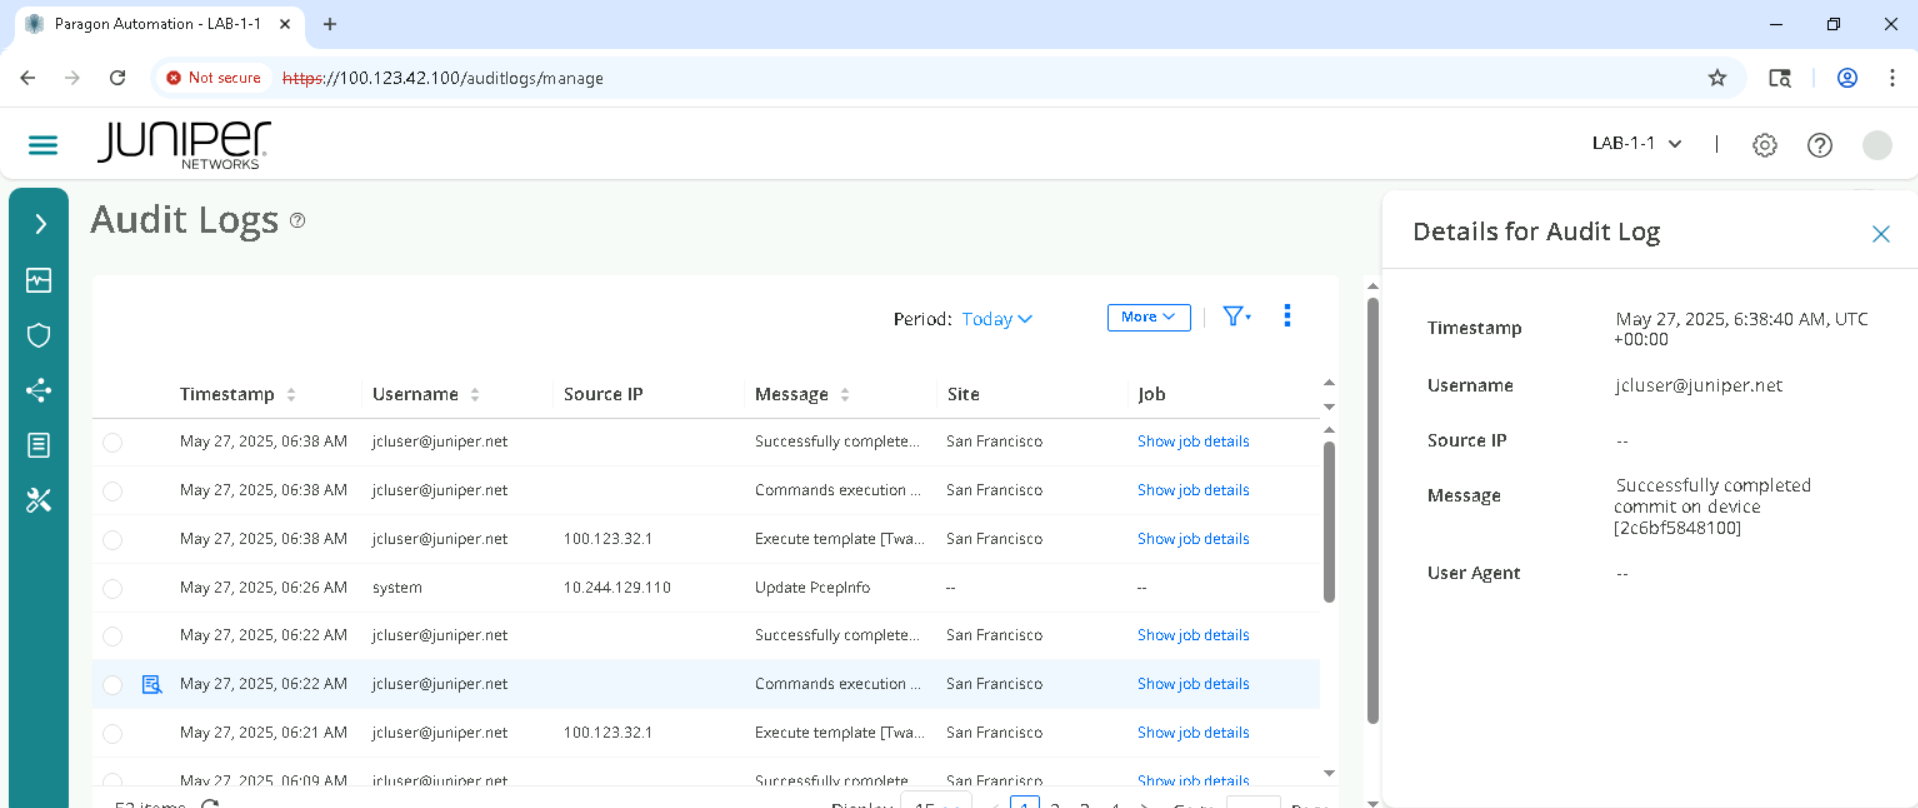
Review the Audit log details.
Tracking Trust score of devices
In the Routing Director GUI on the left side pane, go to Observability > Troubleshoot Devices.
We need to clear the Severity Filter to view all the devices , go ahead and click on X inside the Severity column to remove Urgent Action Needed and other filters. We must make sure everything is unselected here , so all devices are visible and listed.
Click on the device depending on the SET allocated for example SETA will have vMX-A1, vMX-A2 .
Click on vMX-A1 for SETA, vMX-B1 for SETB and so on , based on SET allocated.
Expand the Identity and Location accordion and click on Trust Score.
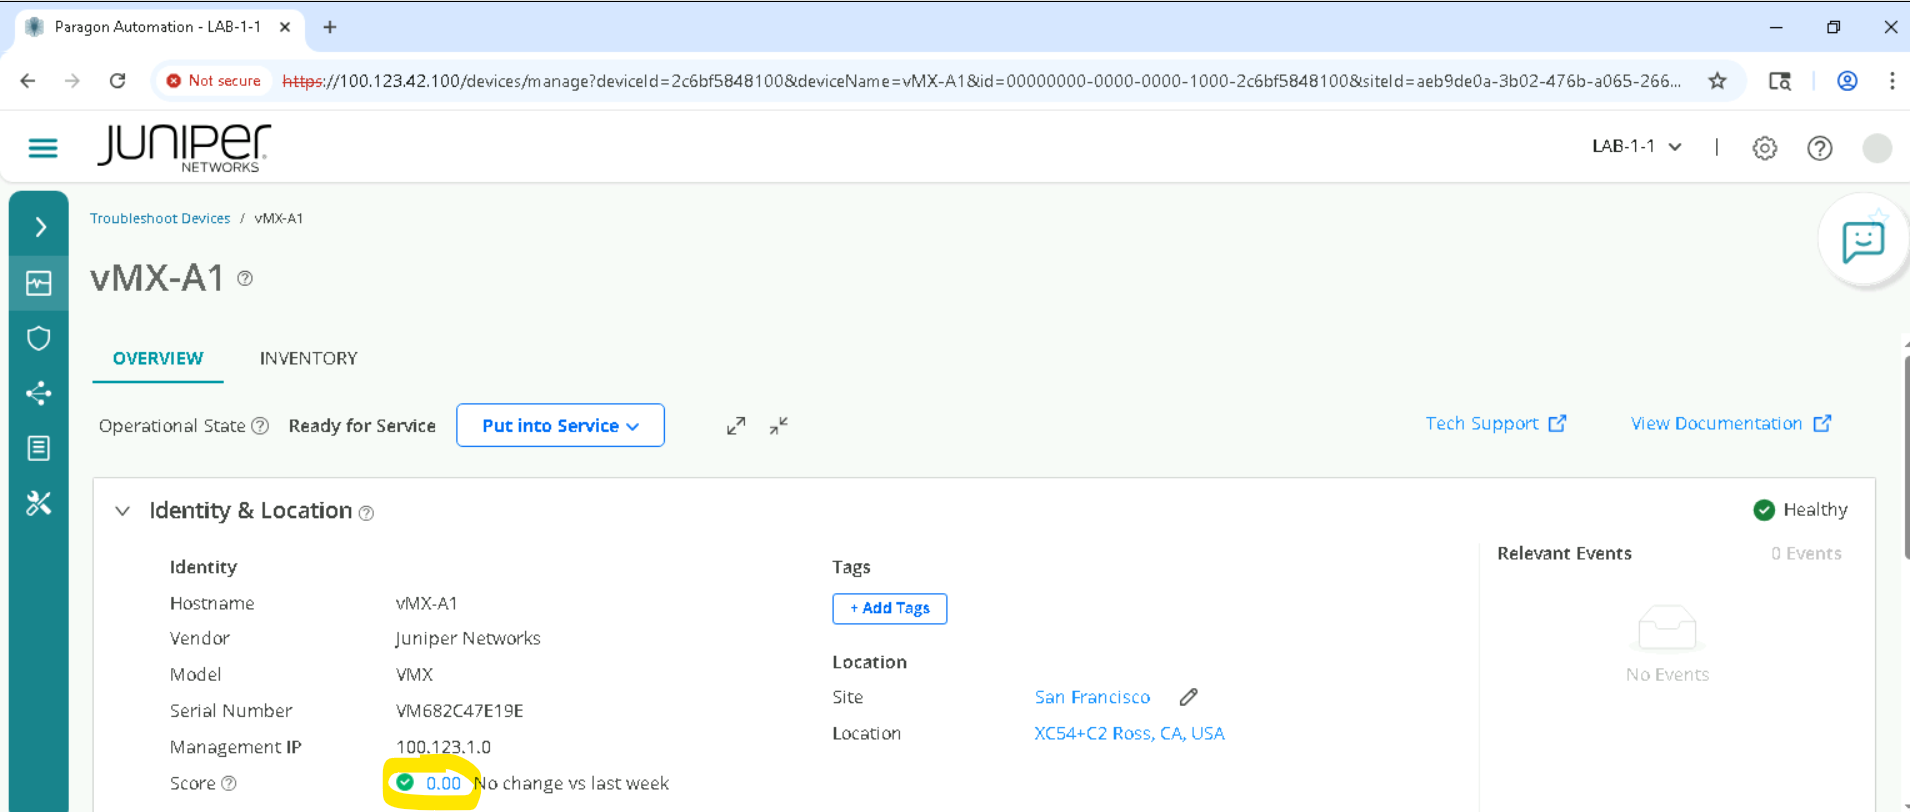
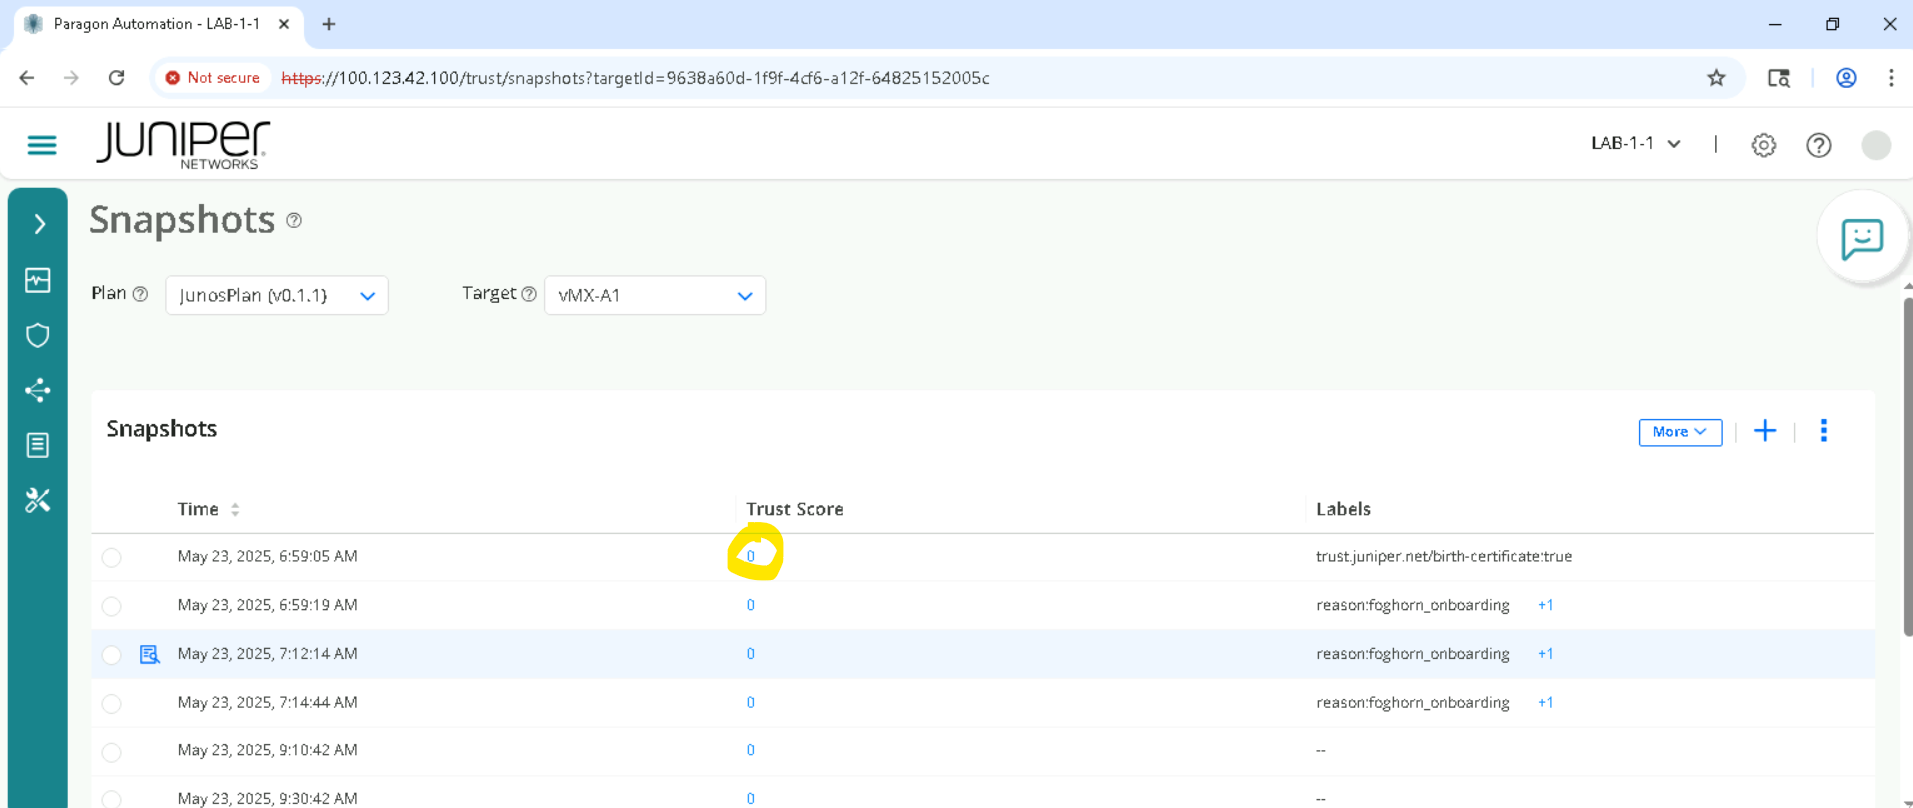
You will be redirected to the snapshots page, click on the latest Trust Score.
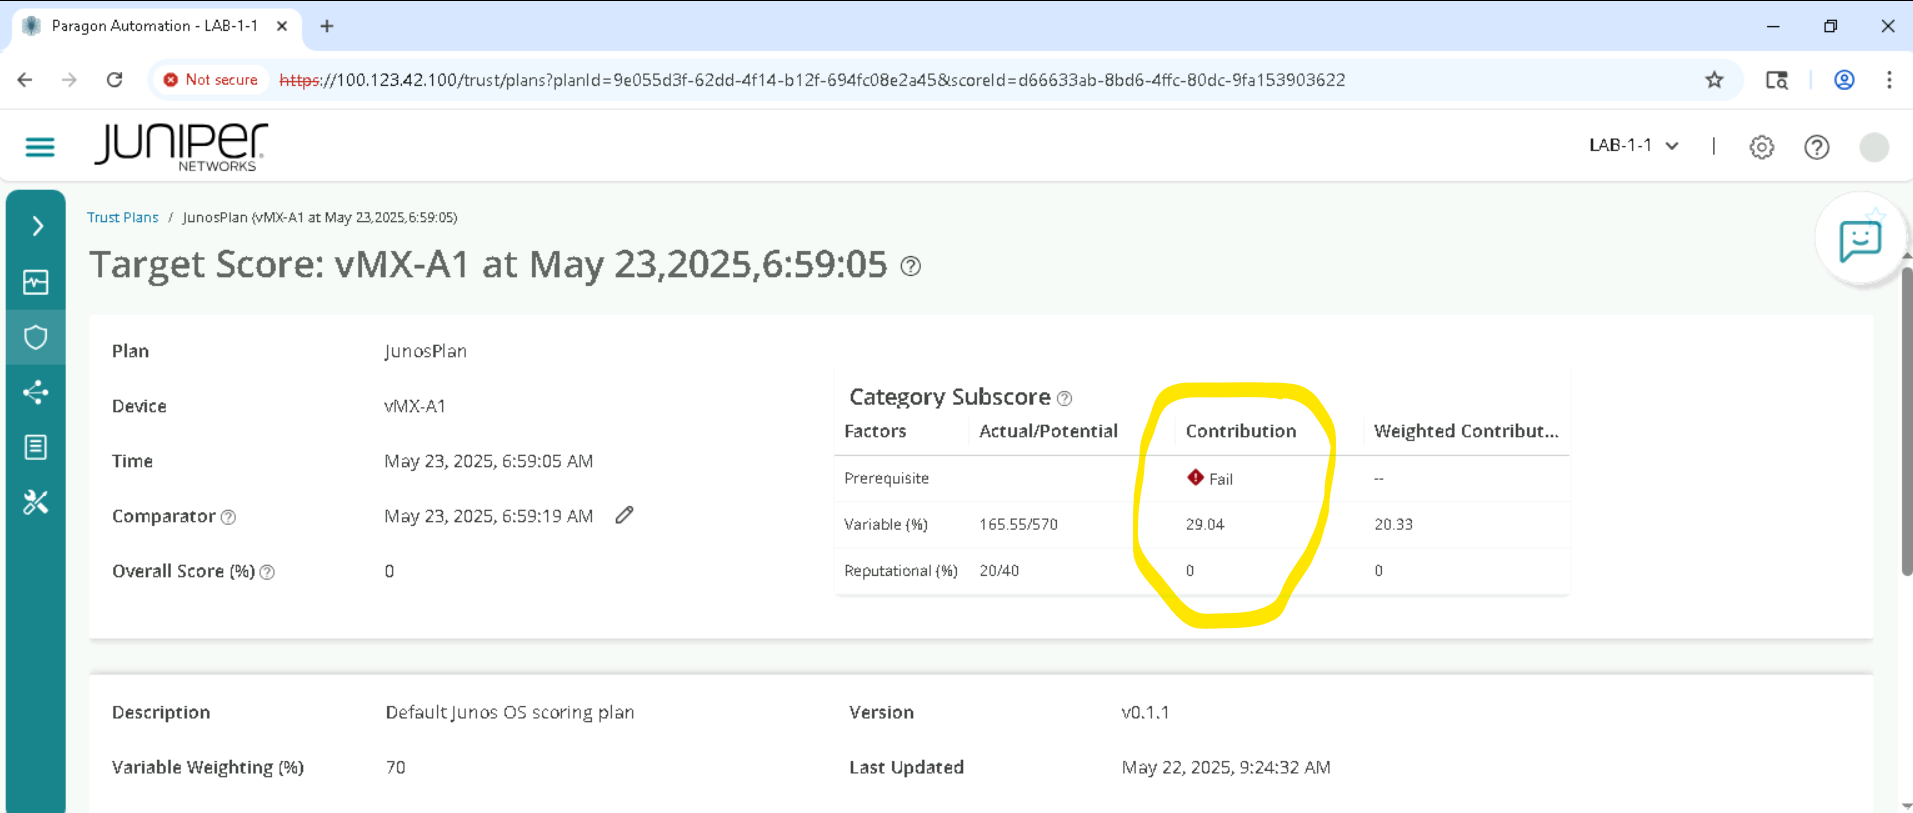
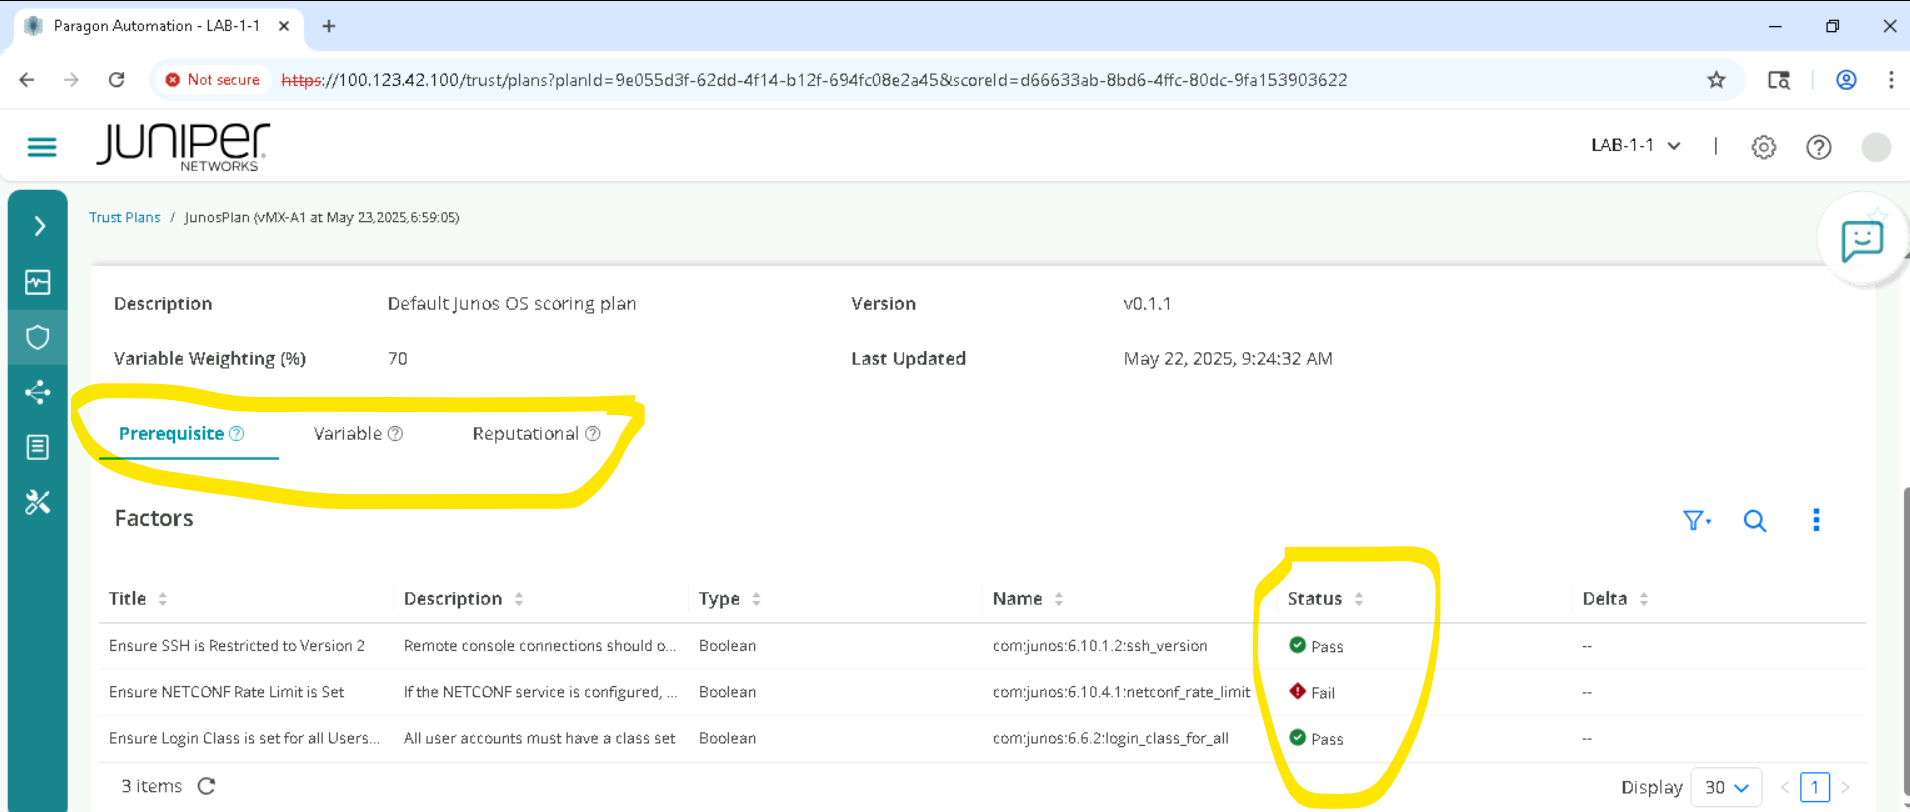
Trust score is a weighted average of Pre requisite Params, Variable and Reputational parameters . the actual contribution is listed as below . Please review each of these and how these impact the current trust score.
Track Interfaces Health, check for Flaps and stats
In the Routing Director GUI on the left side pane, go to Observability > Troubleshoot Devices.
We need to clear the Severity Filter to view all the devices , go ahead and click on X inside the Severity column to remove Urgent Action Needed and other filters. We must make sure everything is unselected here , so all devices are visible and listed.
Click on the device depending on the SET allocated for example SETA will have vMX-A1, vMX-A2 .
Click on vMX-A1 for SETA, vMX-B1 for SETB and so on , based on SET allocated.
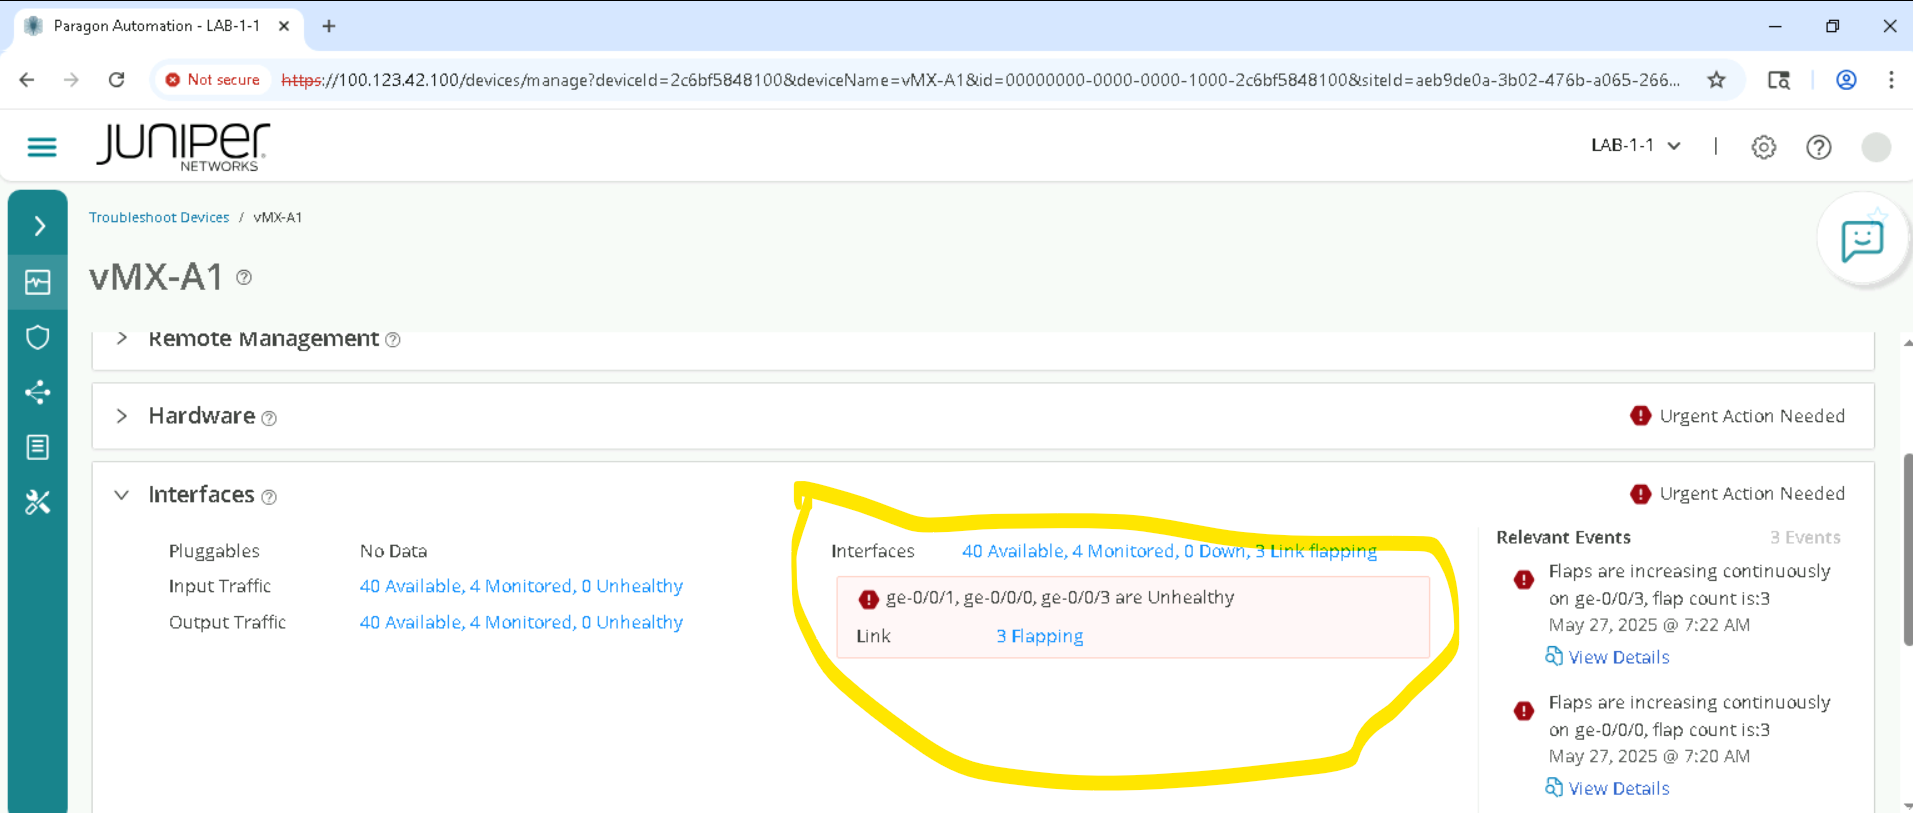
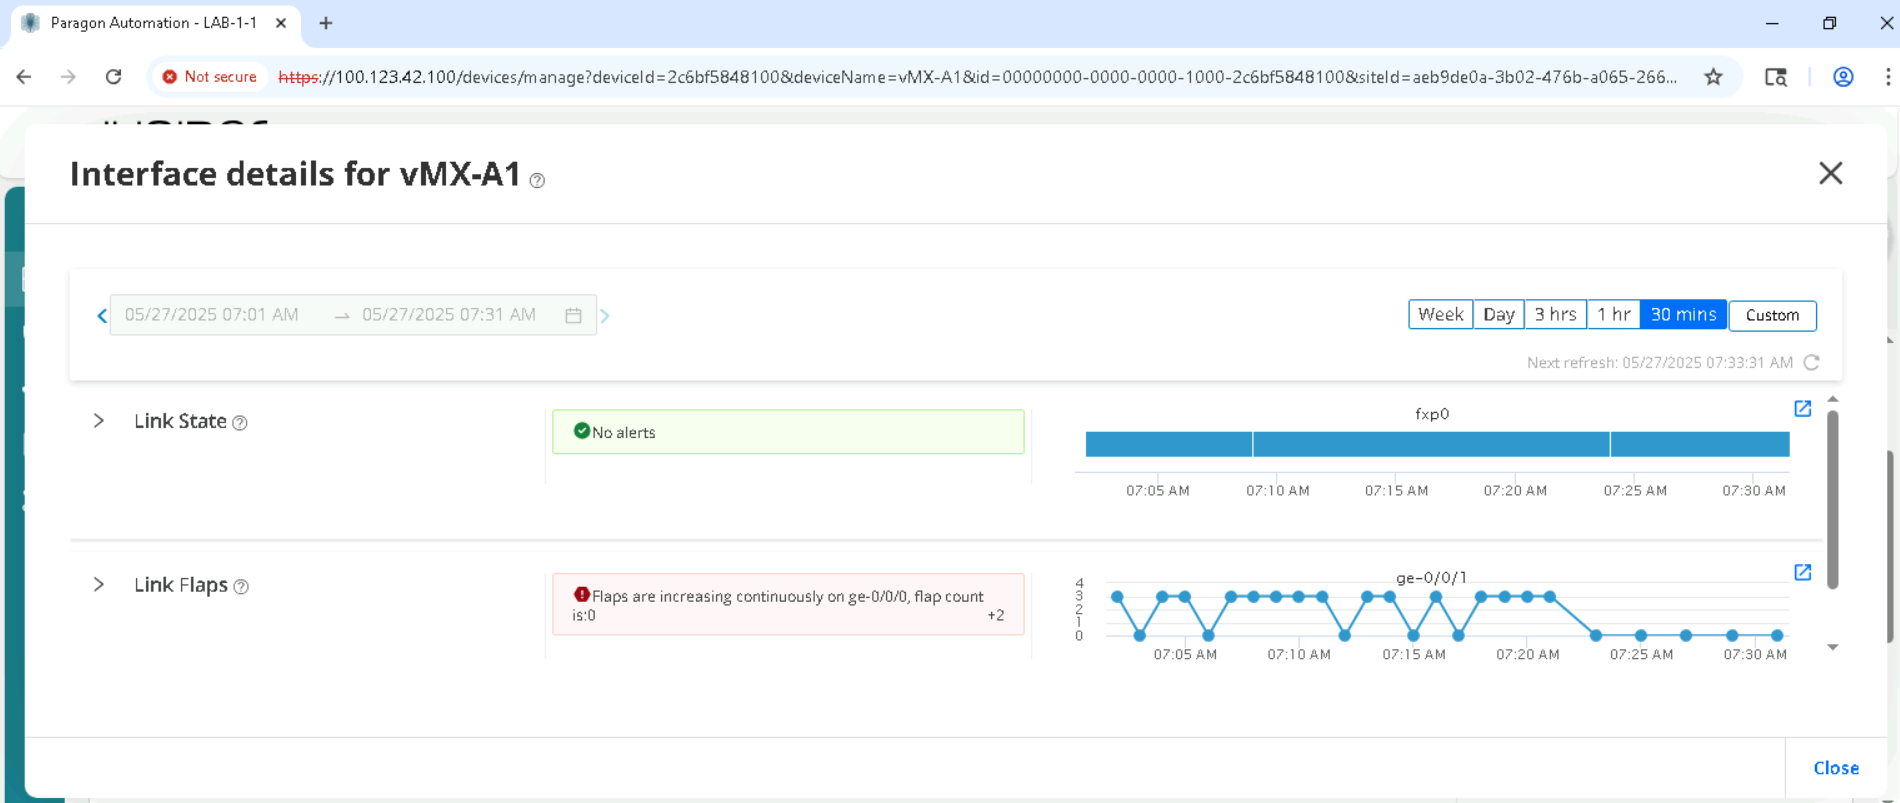
Expand the Interfaces accordion , check for Interface flaps if any. If the link is flapping , click on the Flapping links to view timeline view.
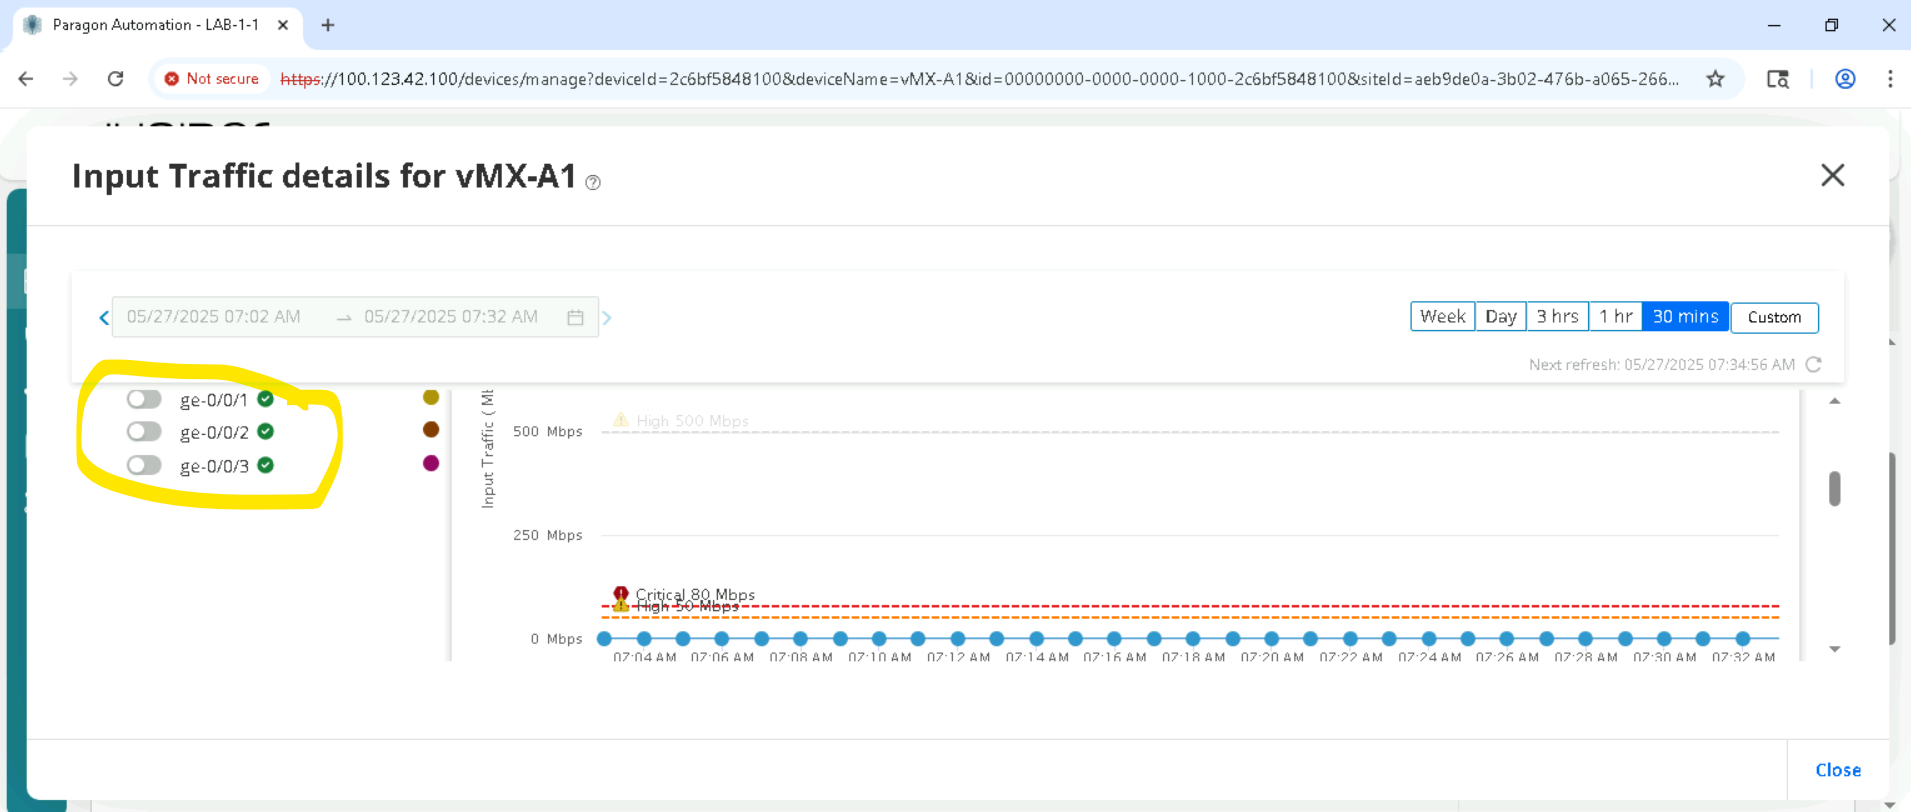
Review Input and Output Interface statistics , make sure to select the correct interface on the left as highlighted.
Review Alarms, Alerts, and Syslogs
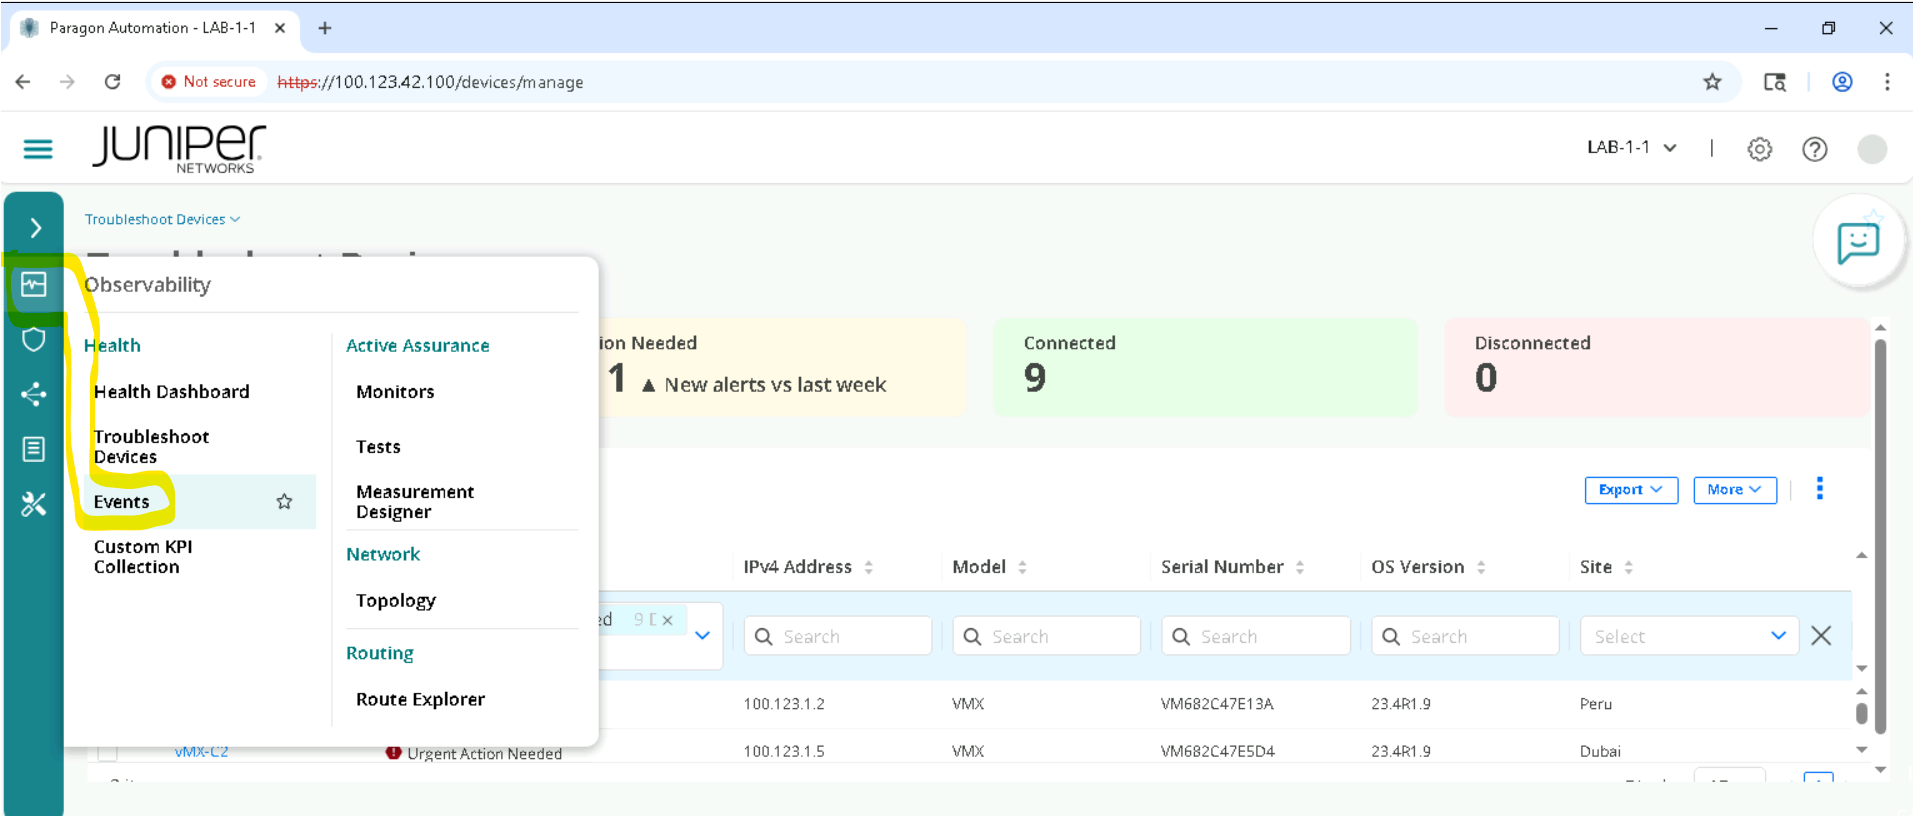
Click on Observability > Events, and review outstanding Alarms, Alerts, and syslog.
You have successfully completed this Hands-On Lab!
Lab Survey
Please take 2 minutes and complet the Routing Director LCM Hands-On Lab Survey