Routing Analytics
Overview
Routing issues can be challenging to quickly detect, diagnose, and resolve. Routing Director’s (formerly Paragon Automation) Routing Analytics feature is a sophisticated data analytics software designed for fine-grained collection, storage, and analysis focused on the network’s dynamic control plane.
This lab demonstrates Routing Analytics capabilities such as monitoring and alerting detailed routing data, interactive troubleshooting, BGP anomaly detection (including route leaks and outages), and analysis of policy, configuration, and topology changes, detect sudden changes in routes across the network. Additionally, Routing Analytics feature serves as a collector for sampled IPFIX data and Junos Resiliency Interface (JRI) data, aggregating network-wide information into a centralized database where machine learning algorithms helps identify traffic blackholing and other issues. This solution enhances network visibility and operational efficiency by leveraging automation and advanced analytics to address complex routing challenges.
We would like you to experience Routing Analytics in this Lab.
Starting Lab
This lab allows 6 people per sandbox to take this lab per session.
If you would like to do this lab raise your hand to get Lab User information.
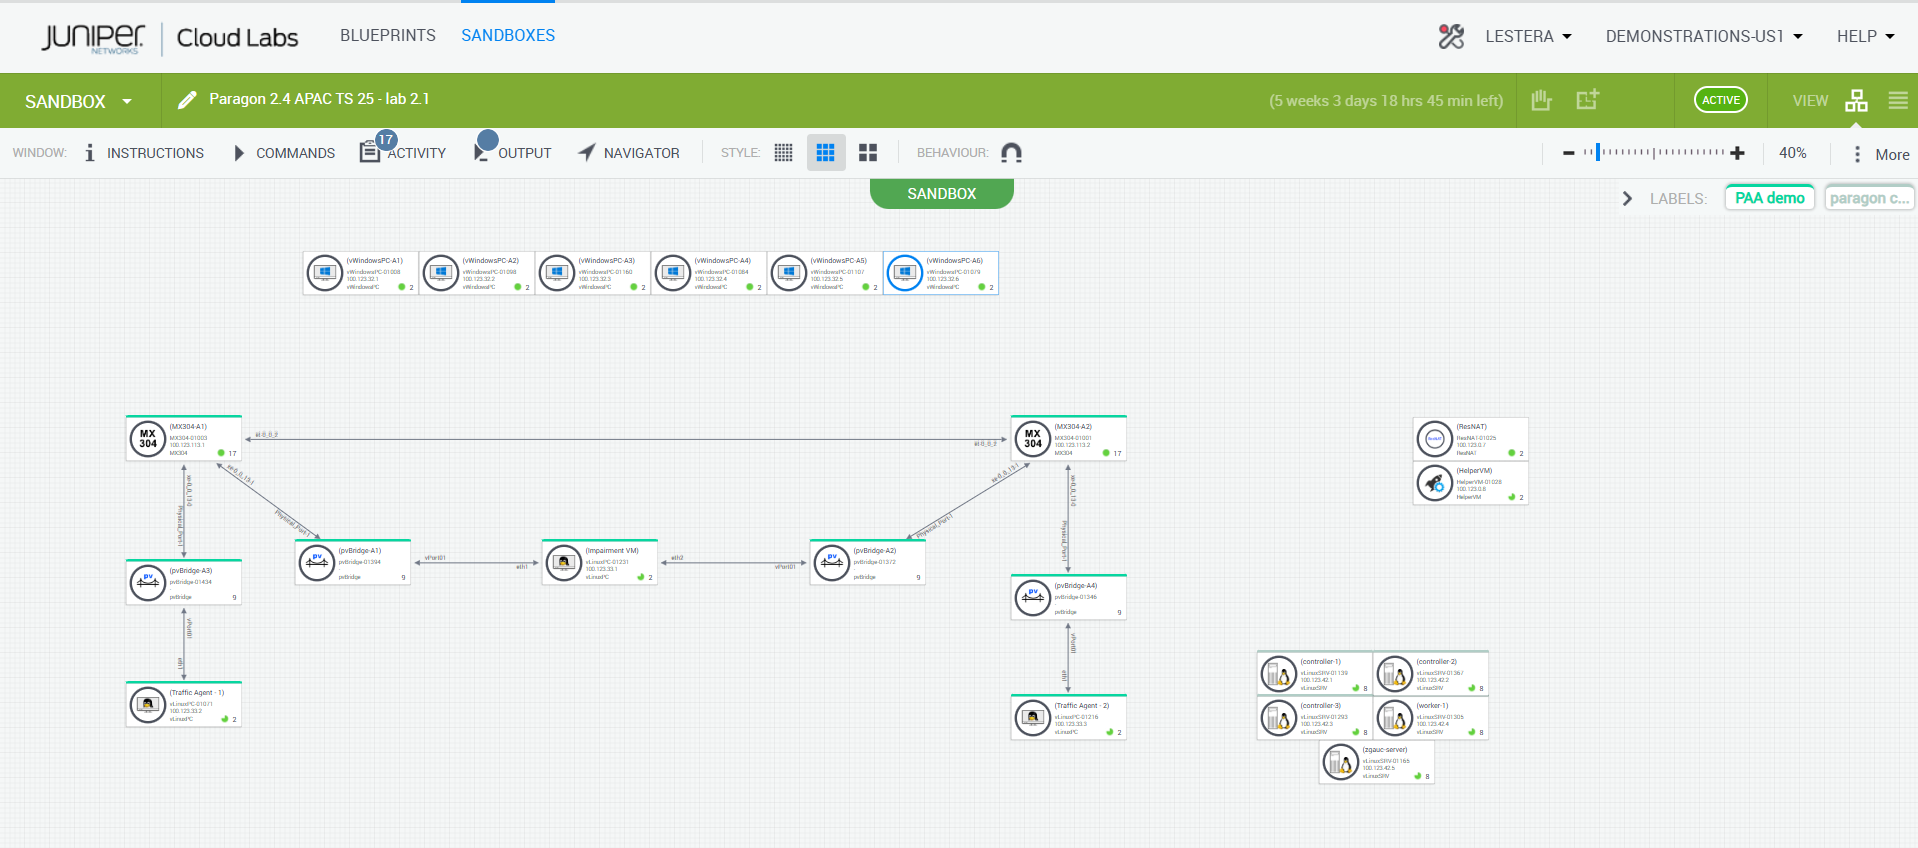
Lab Blueprint Topology
The blueprint consists of 2 MX devices (models may vary across sandbox) and Routing Director 2.4.0
Routing Analytics
The objective is to demonstrate Routing Analytics
Track BGP adjacencies in the network, BGP Flaps, Autonomous system, RIB changes
Track Network Wide Routing Updates
Track Prefixes across the network or filtered down to devices and thus narrowing down the issues. Could be an upgrade to new software or could be issues with Routing .
Prefix of interest tracking
Login to Routing Director via Jumpbox
Using RDP Client, connect to your Labuser assigned IP address/Port
Login using your Lab User credentials
Open Chrome, and navigate to https://100.123.42.100, you should see the login page to Juniper Routing Director GUI
Login using your Lab User credentials
Username - jcluser@juniper.net
Password - Juniper!1
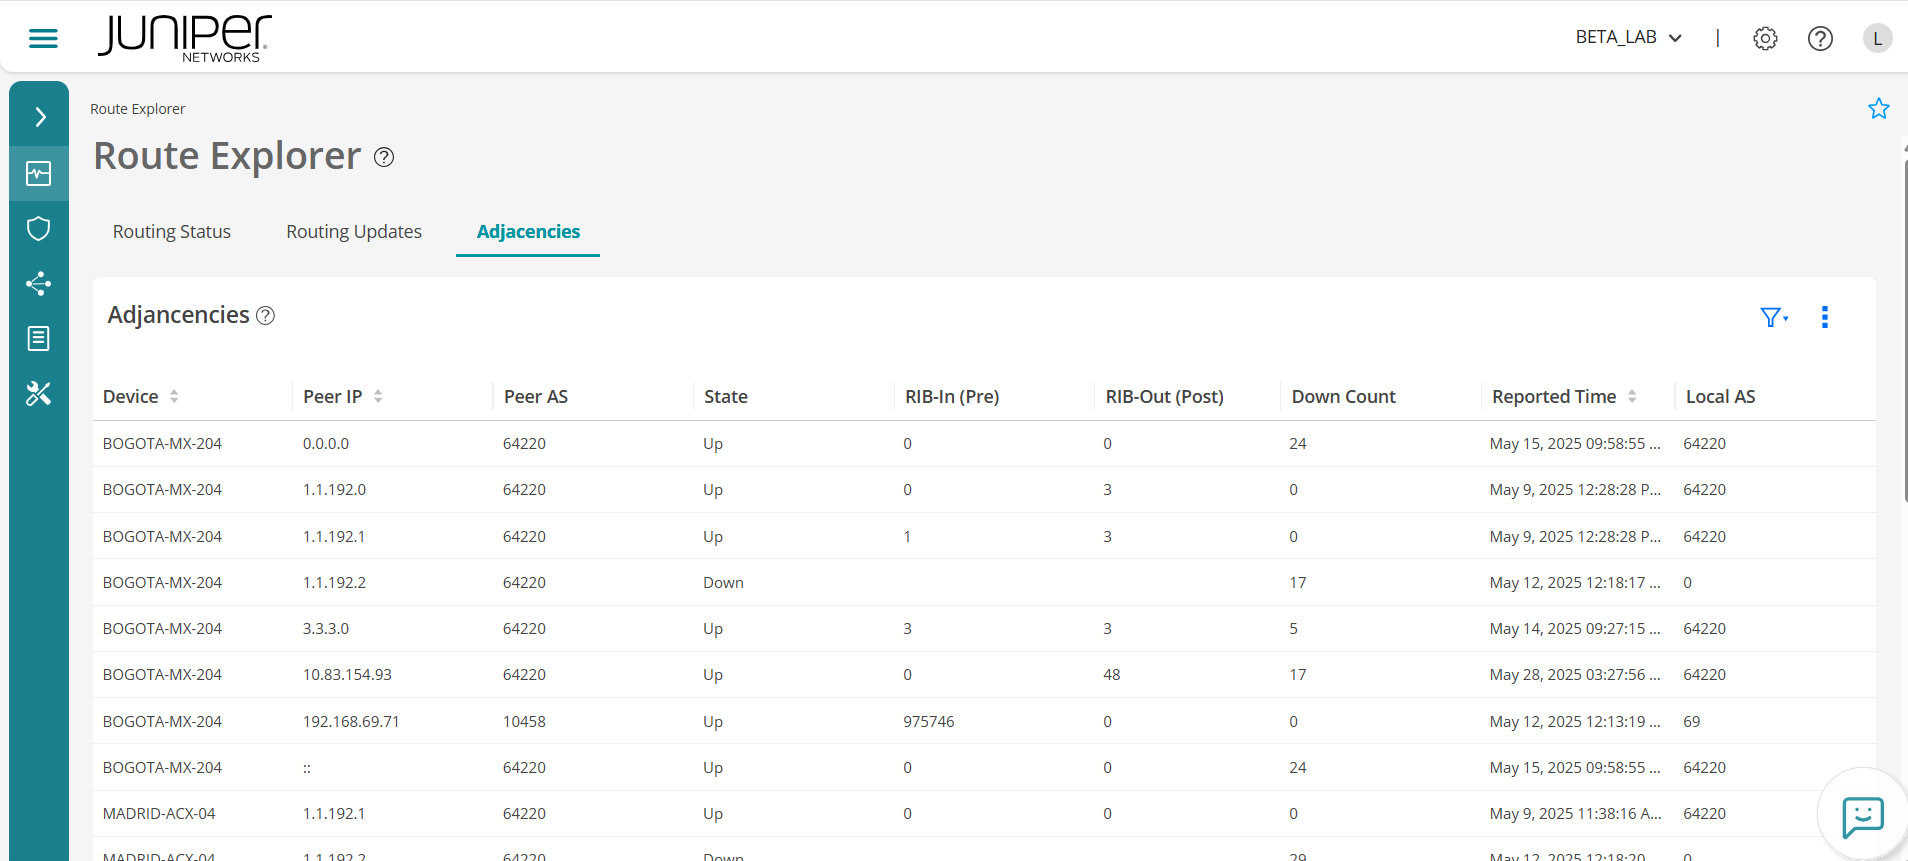
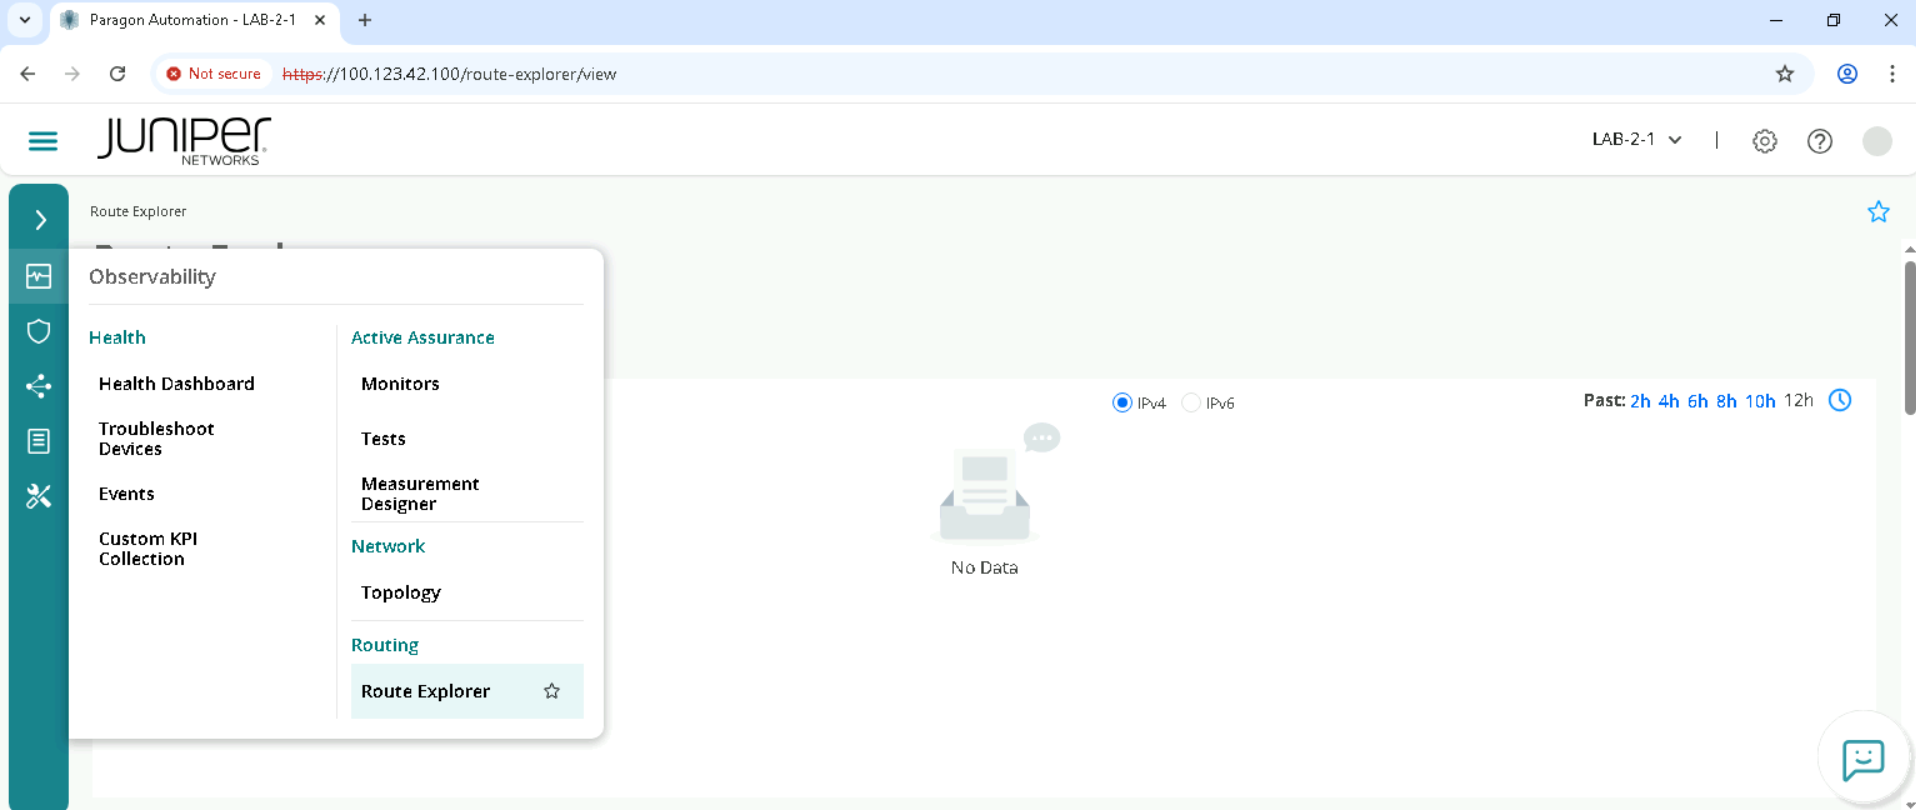
Track BGP adjacencies in the network, BGP Flaps, Autonomous system, RIB changes
In the Paragon UI on the left side pane, go to Observability > Route Explorer.
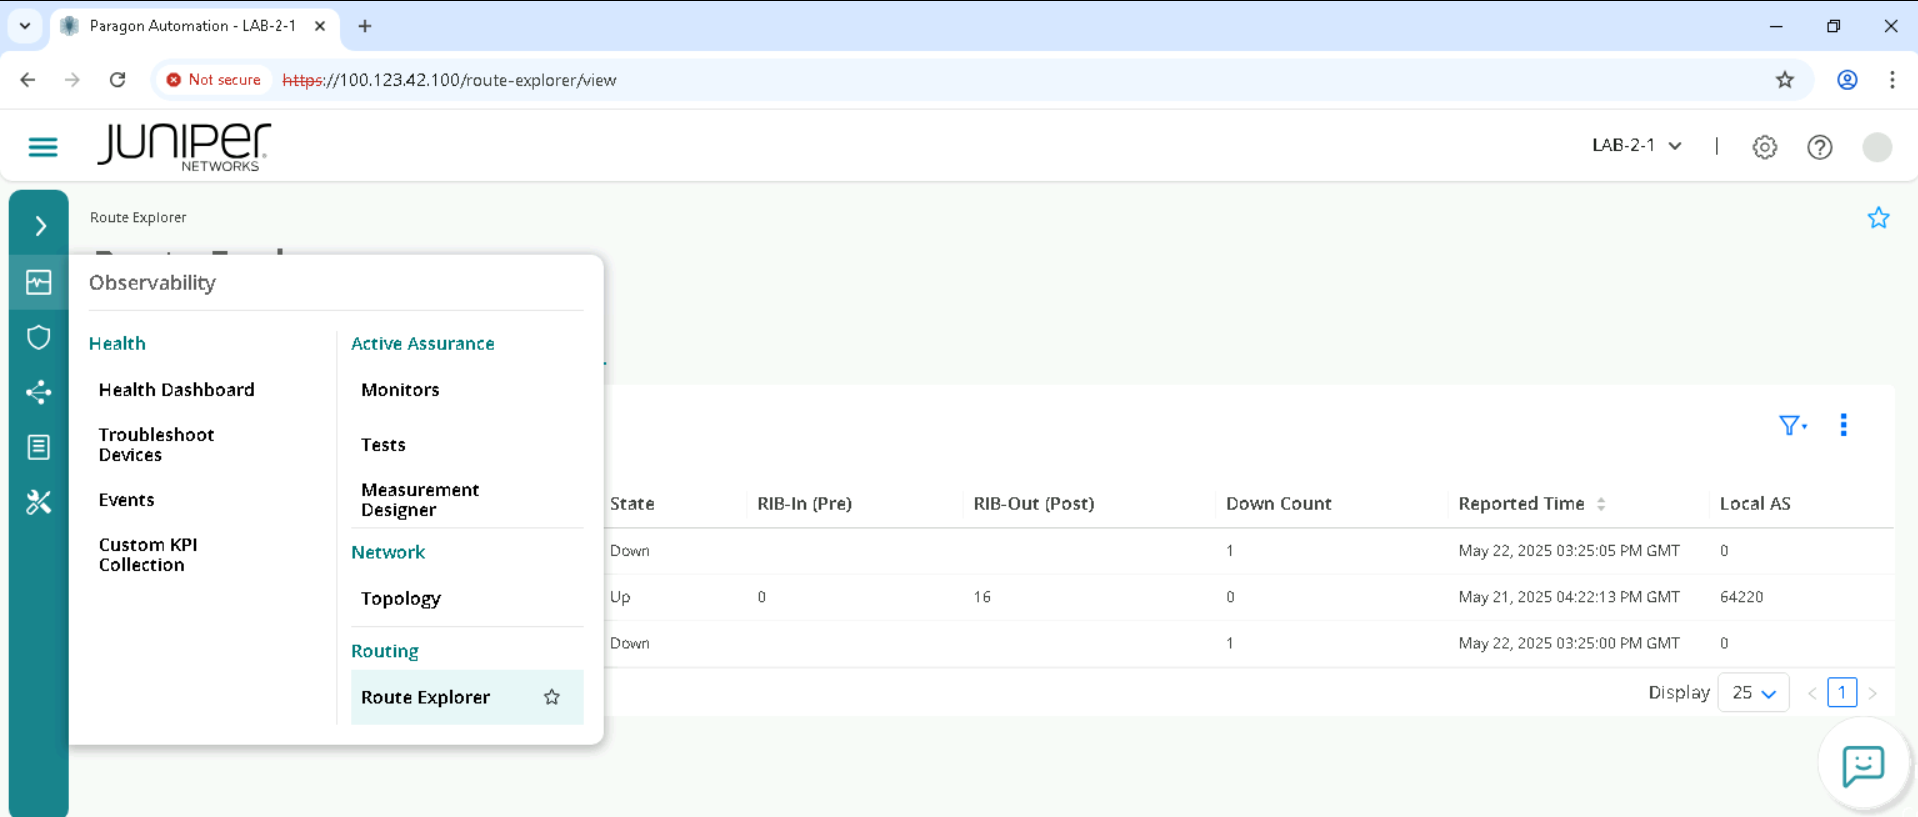
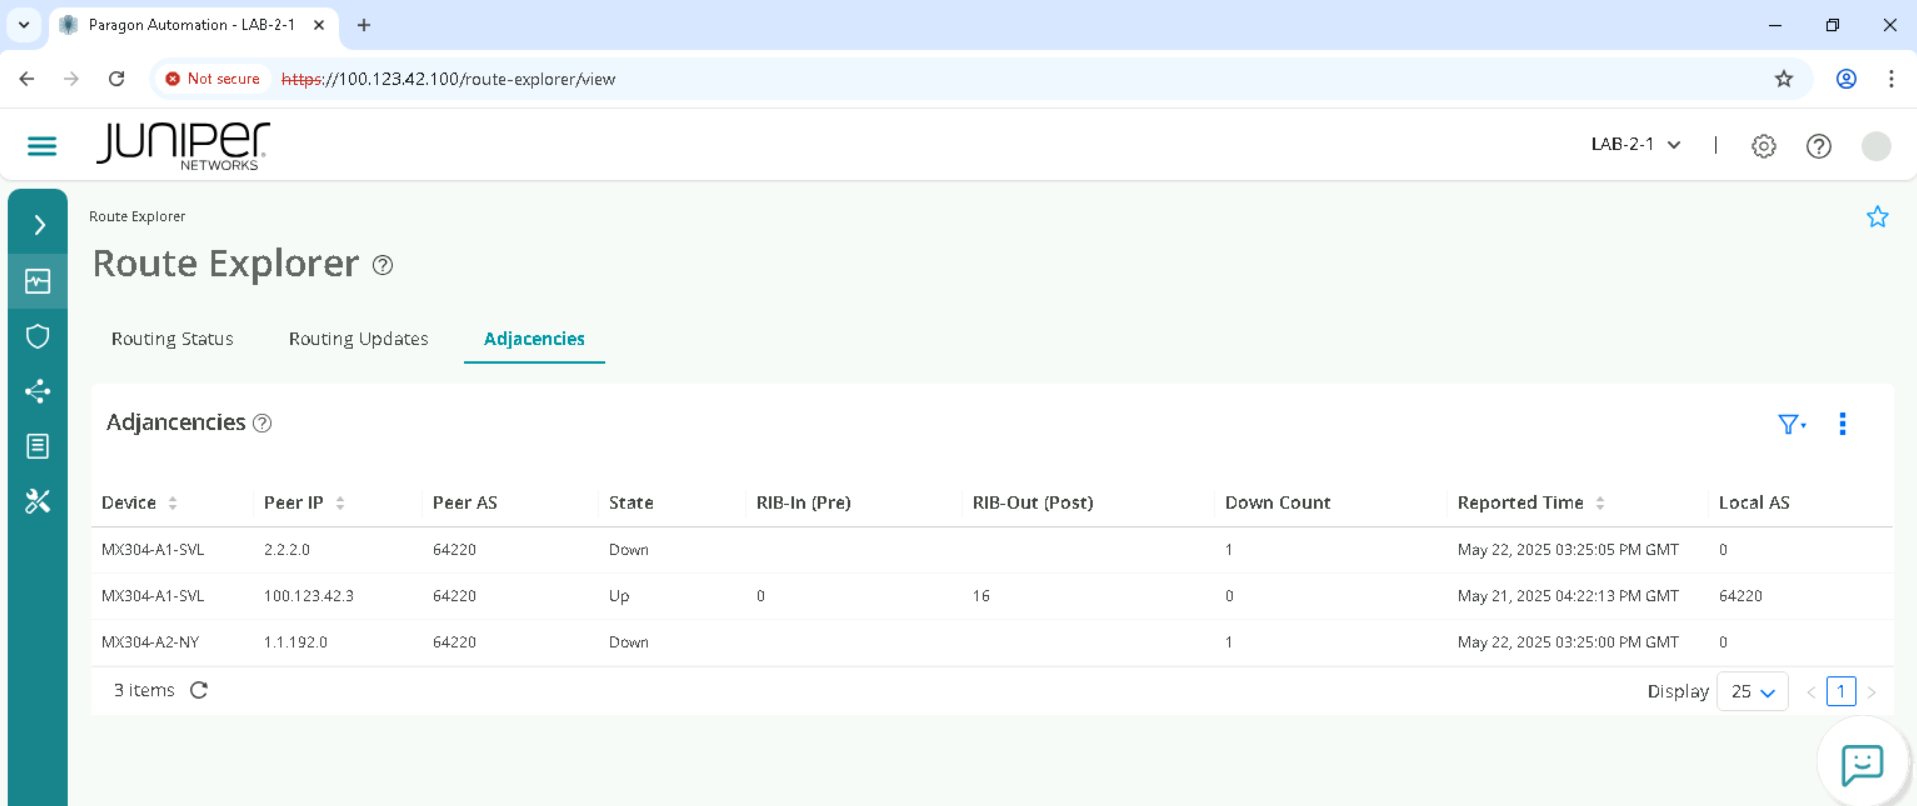
Click on Adjacencies
Verify how many Peers are available
Check for BGP flaps with the down count
Make sure all adjacencies are UP
Review RIB counts and local Autonomous system
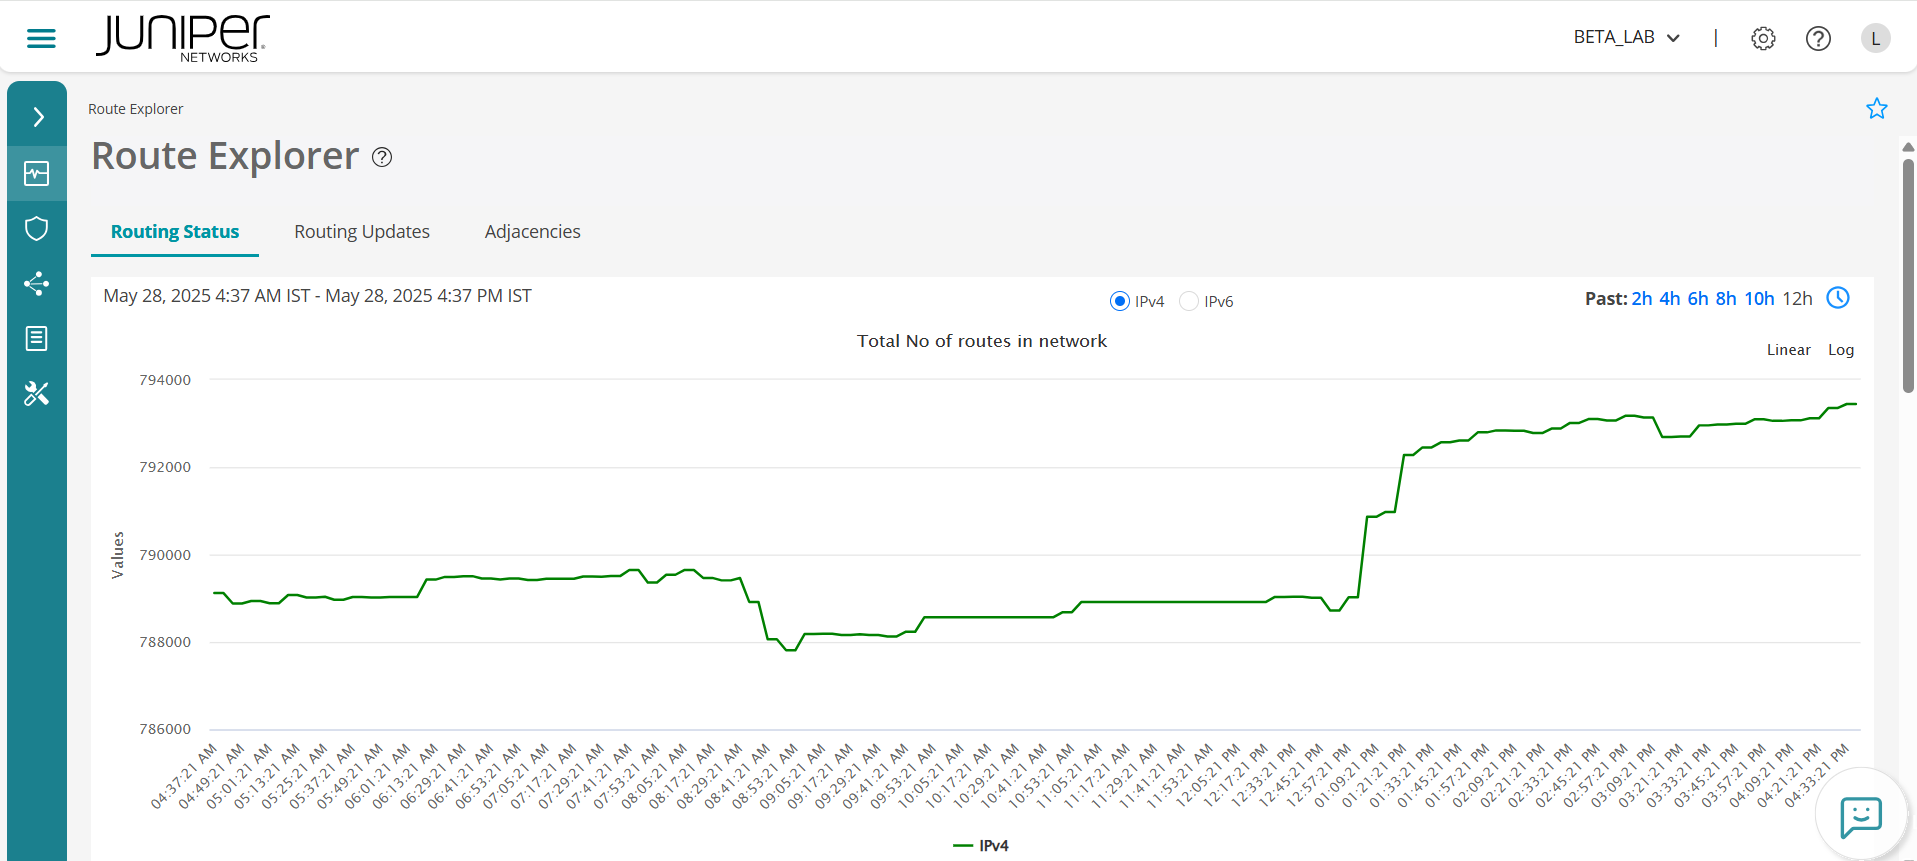
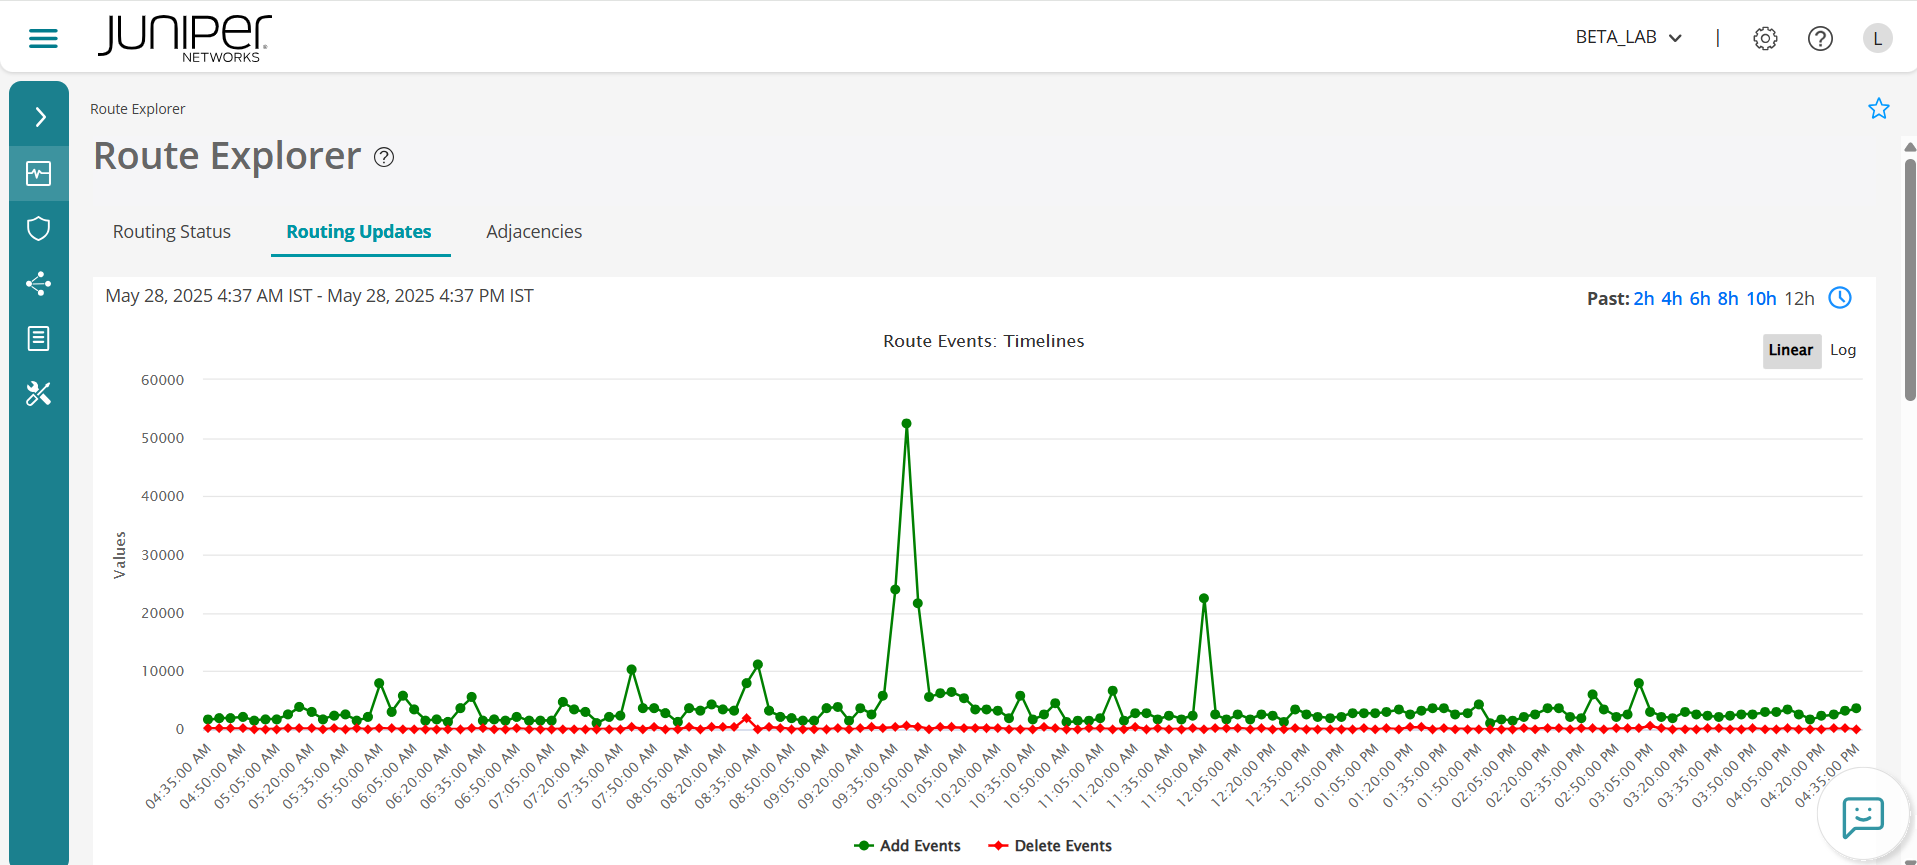
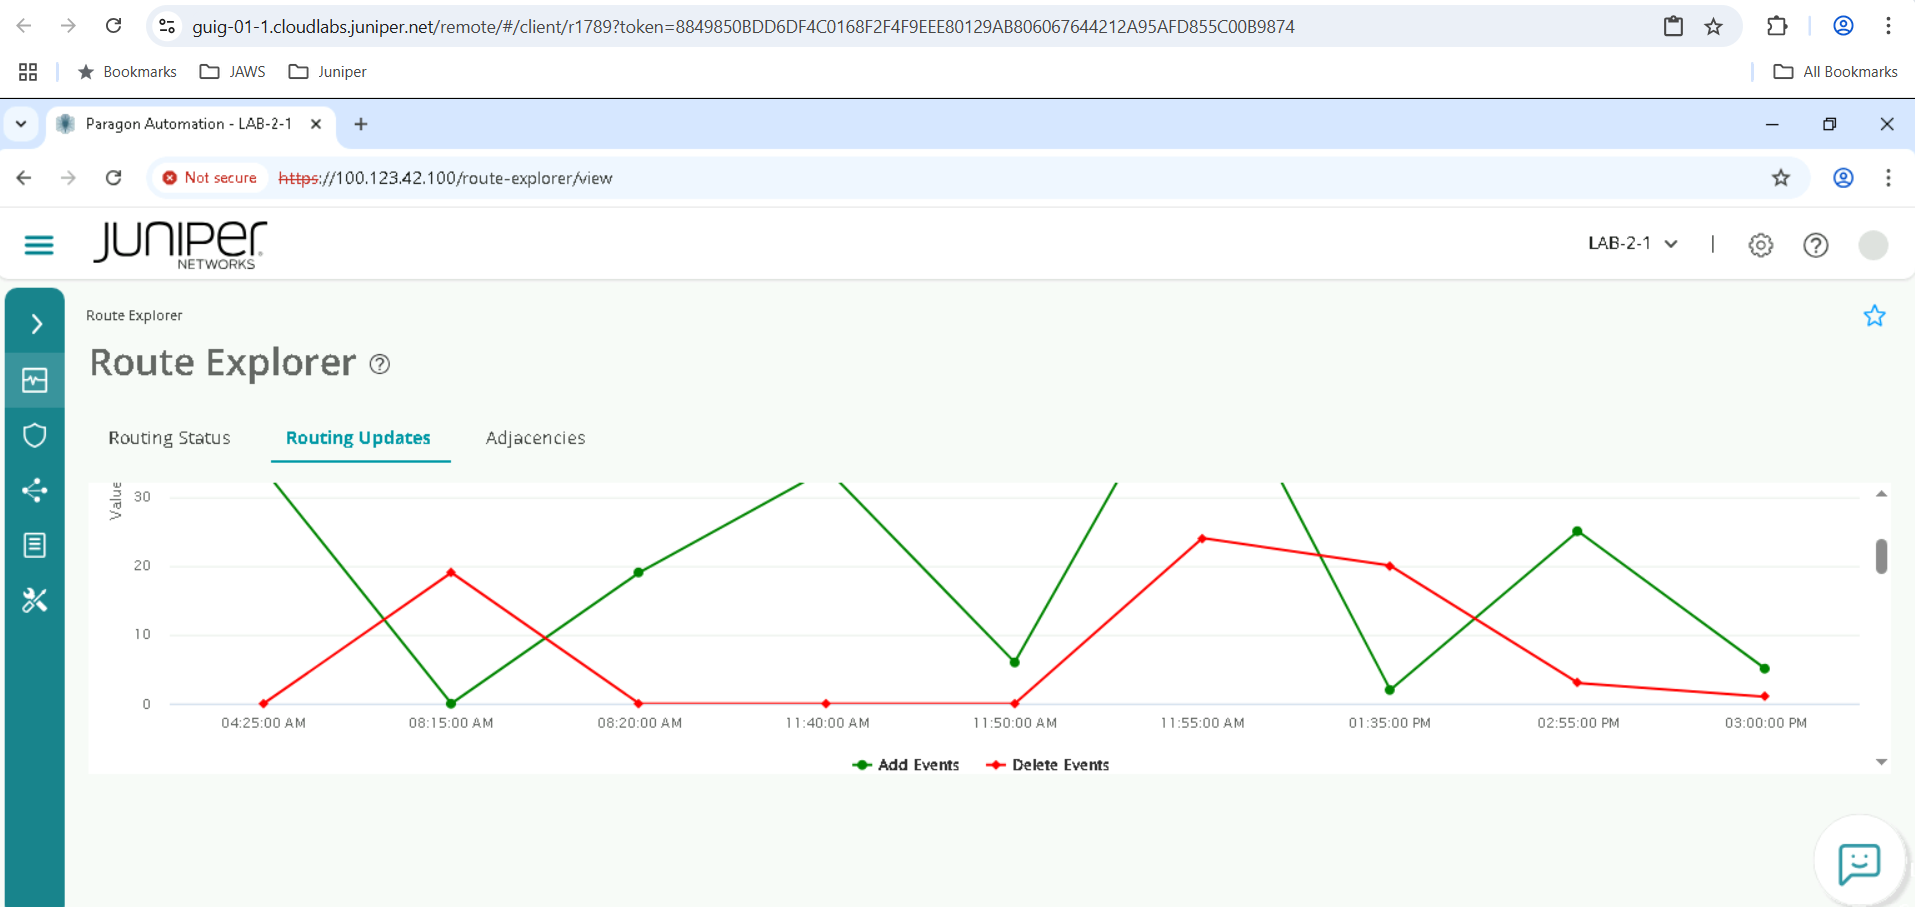
Track and Visualize Network Wide Routing Updates
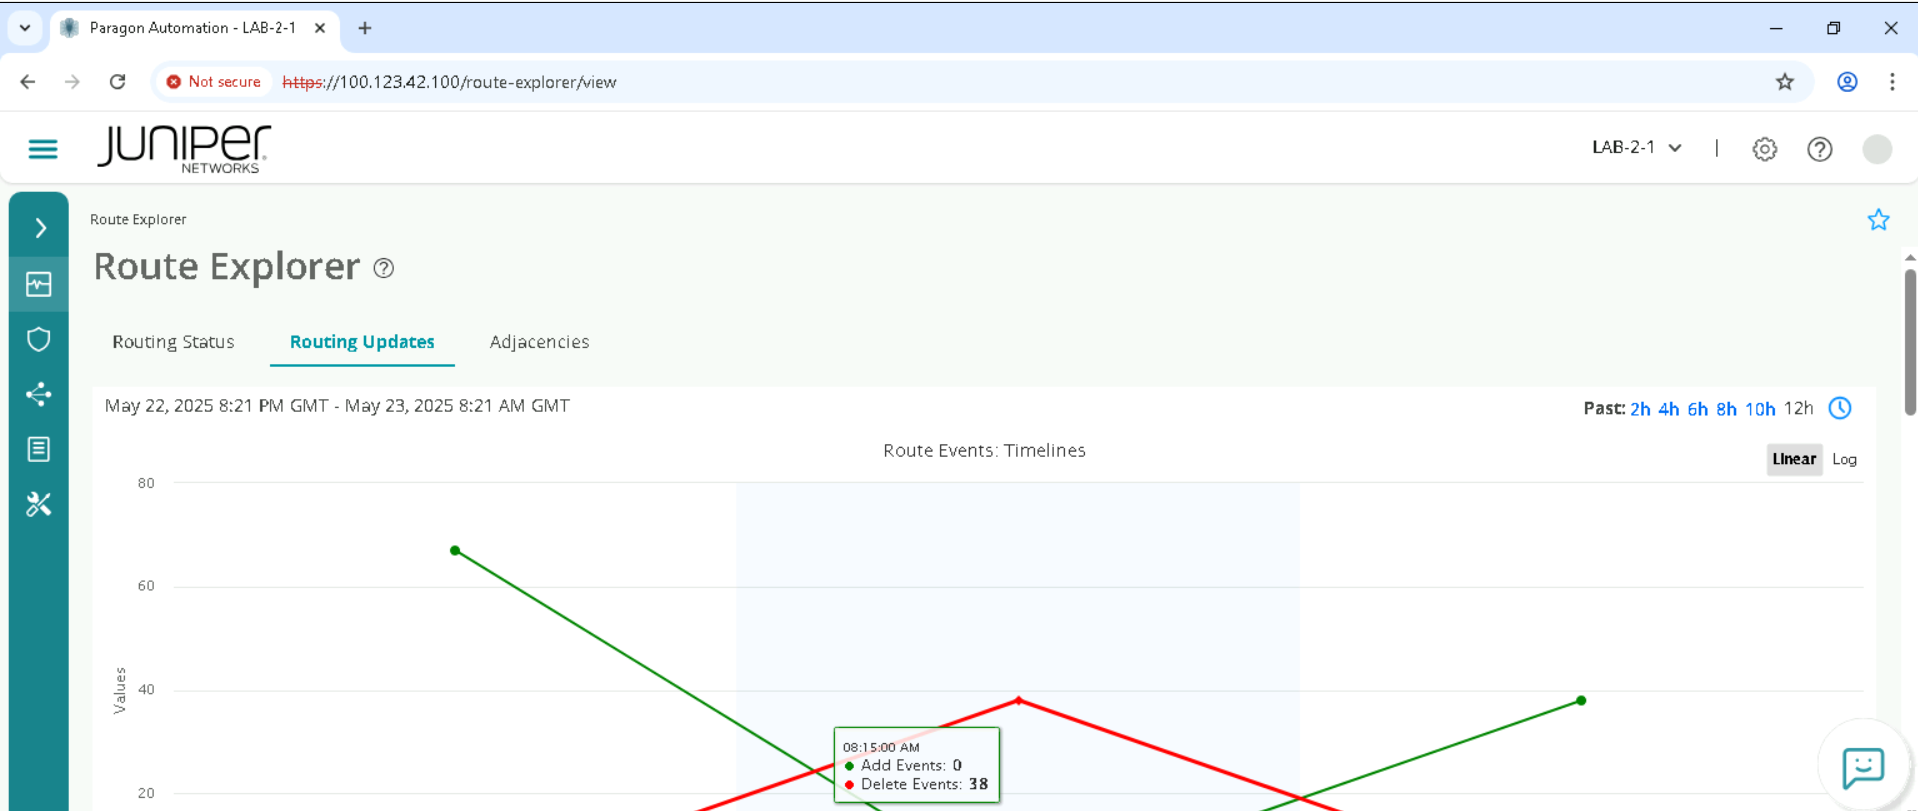
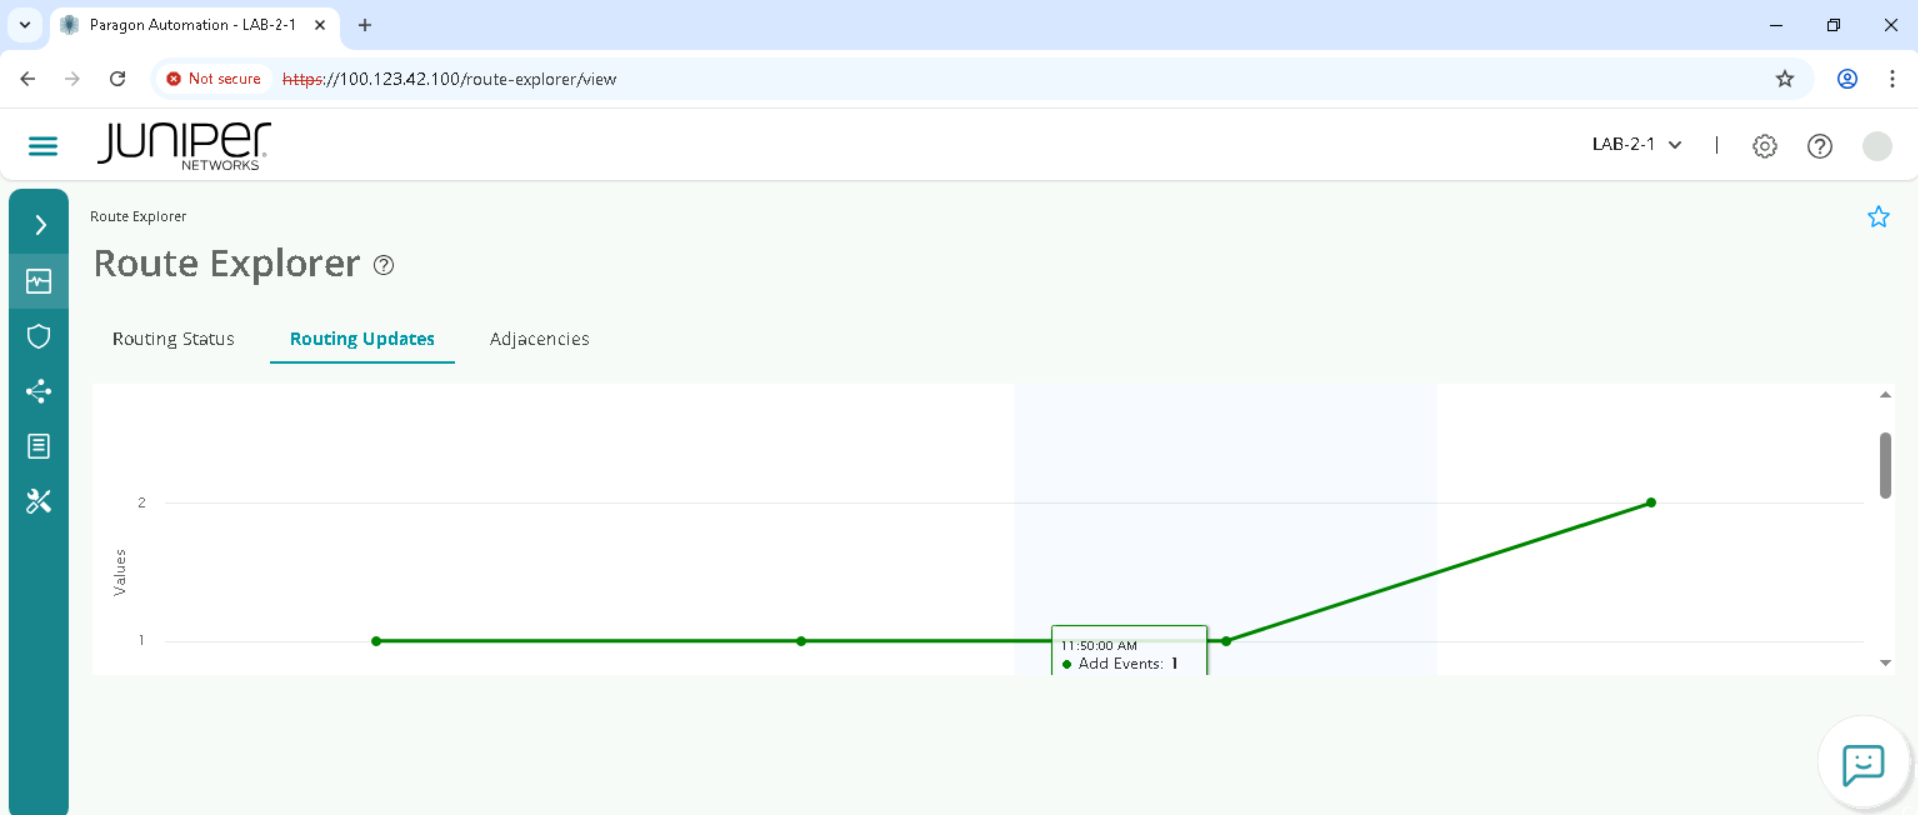
Click Routing updates
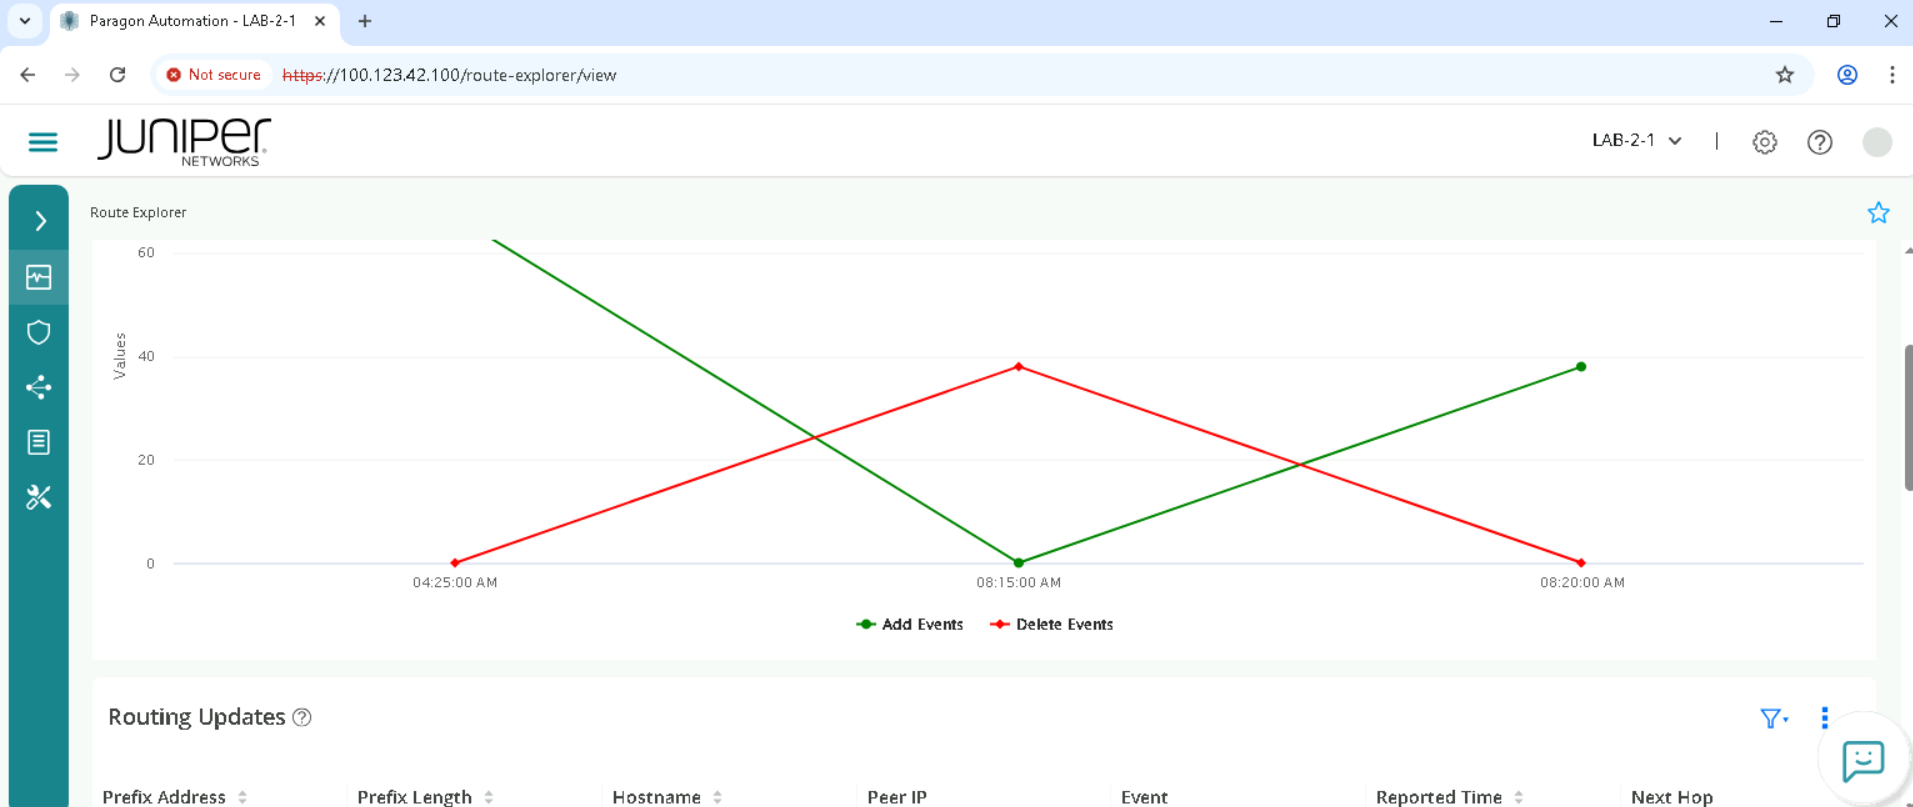
Review the devices and prefixes that were Added or removed on the Route events graph
Review the route event timelines and check if there are add or delete or both events.
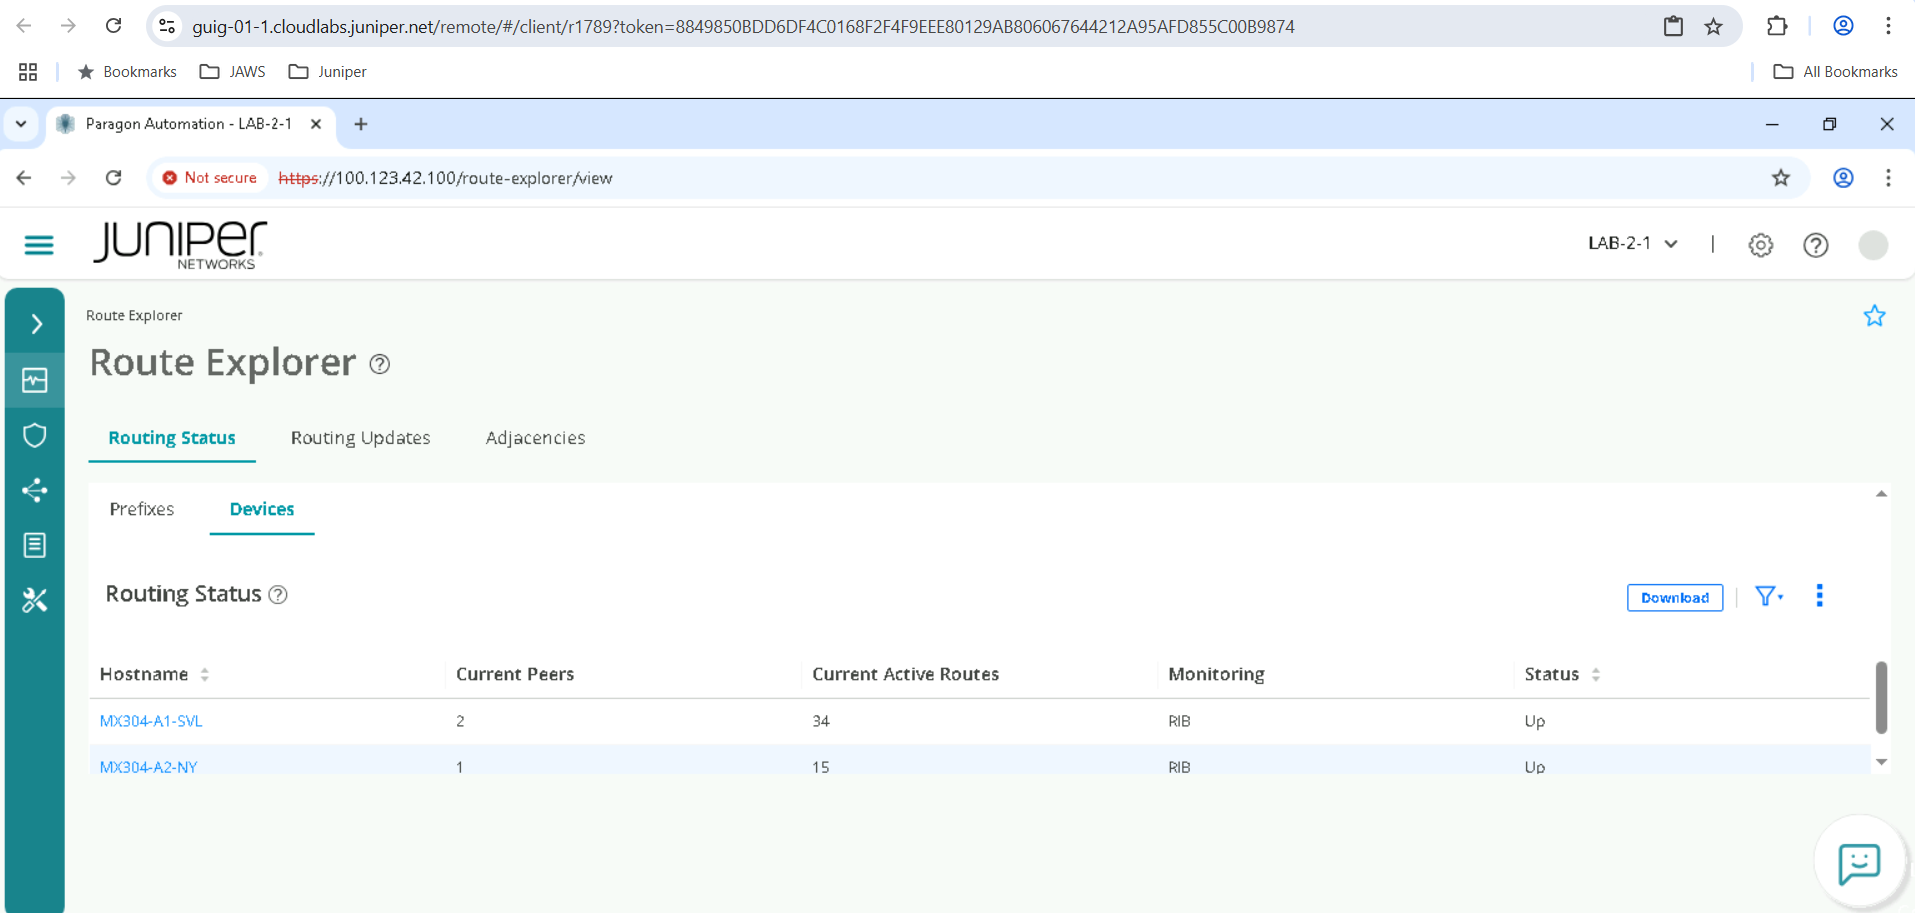
Track Routing Updates for a specific device
This will help in troubleshooting as to which device is causing issues.
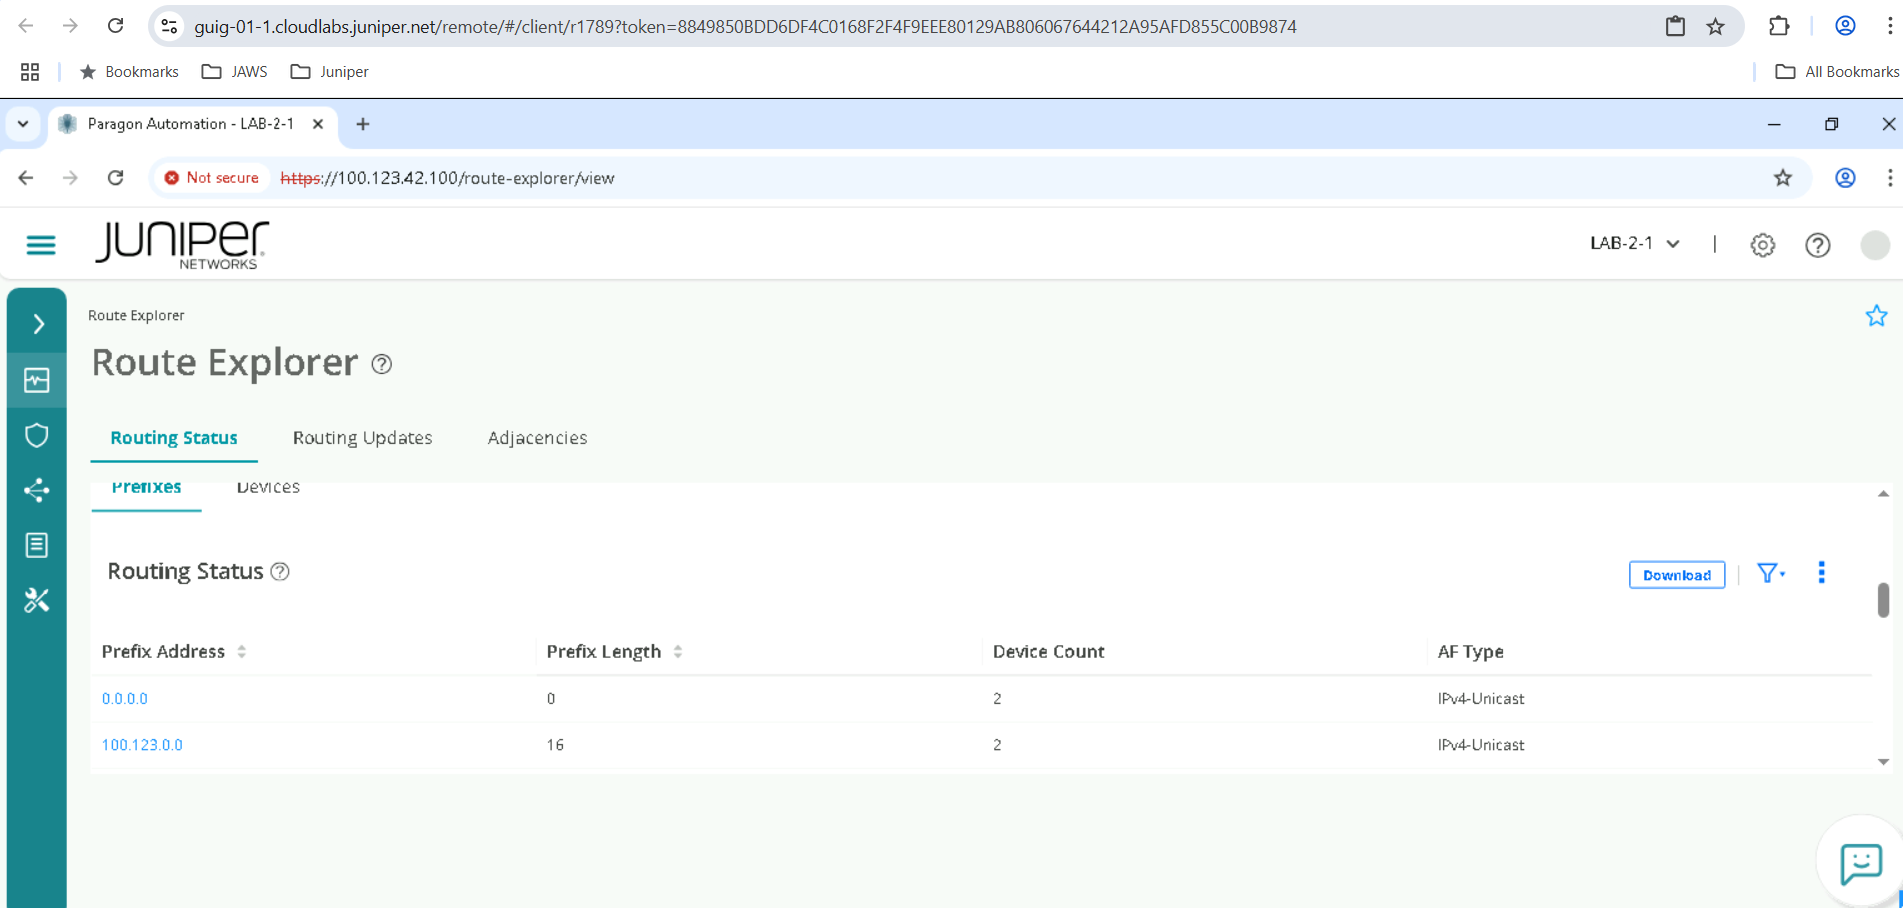
Click on Routing Status Page, then Click on Devices Click on any device (example click on device name MX304-A1-SVL and this will redirect to the Routing Updates page with a filter for that device selected, this page will show a graph of add and delete events for the selected device. Review how many routes were added or deleted. You will need to scroll down and up using the scroll bar on the right as the Page can be big. By Scrolling you can review the prefixes in this individual device.
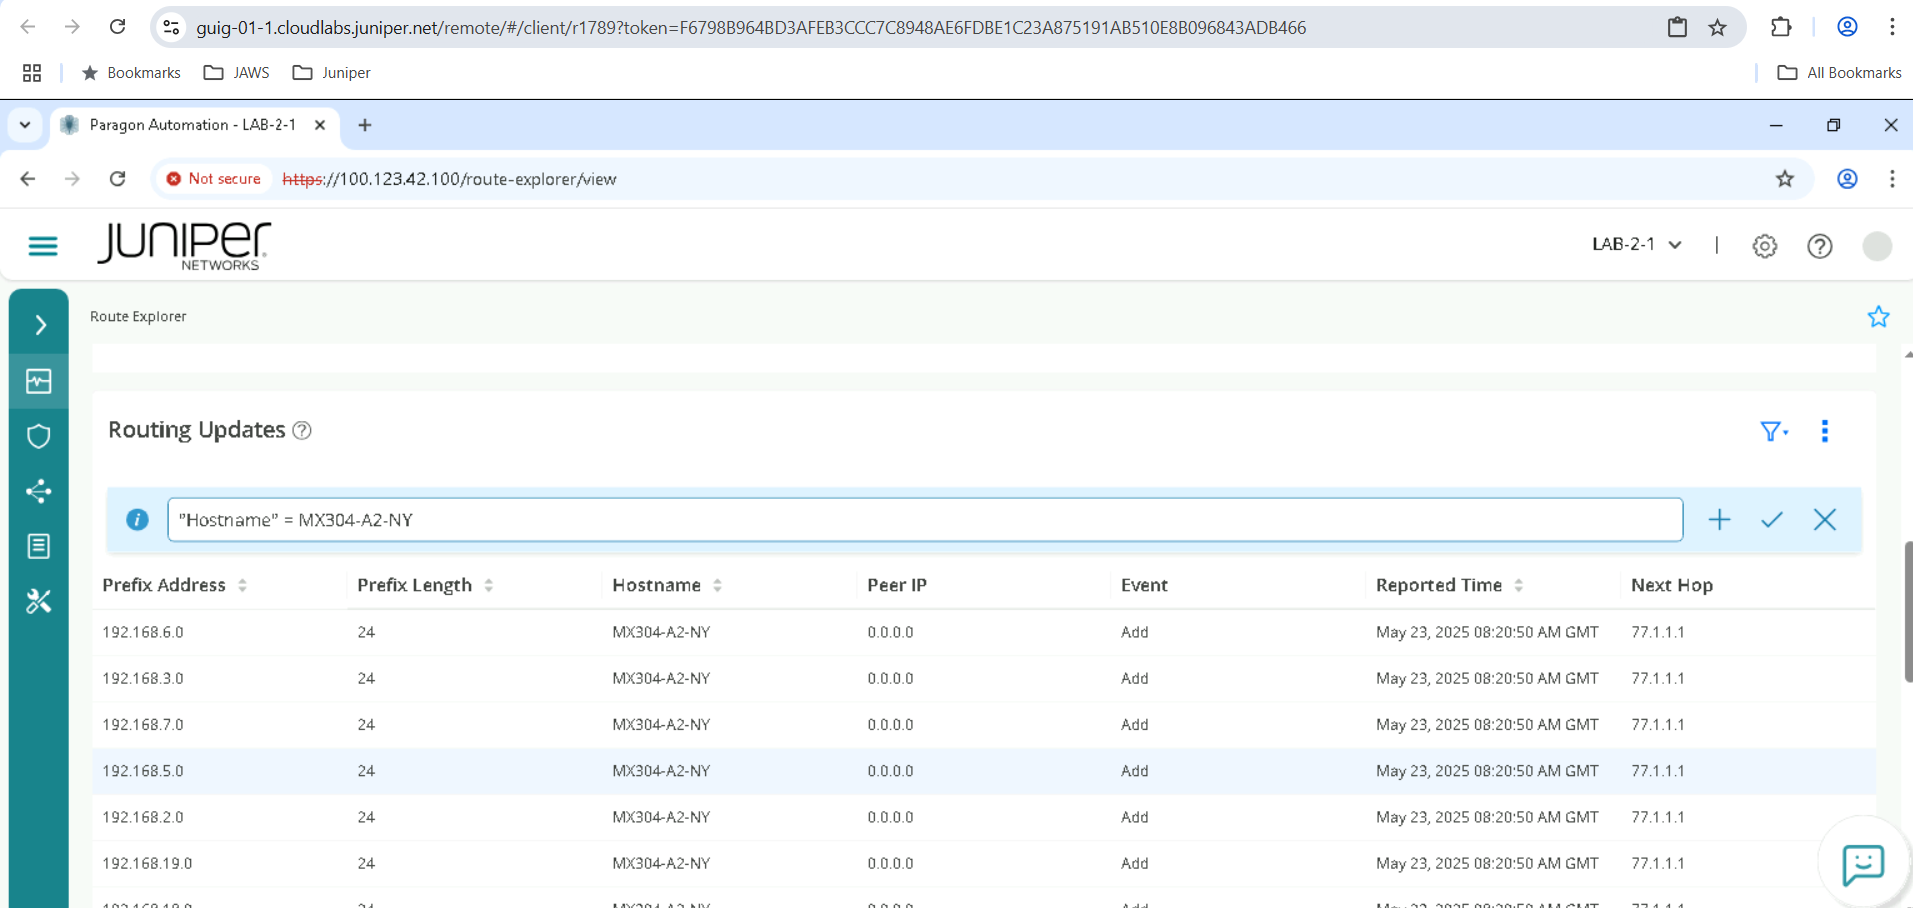
Prefix of Interest Tracking
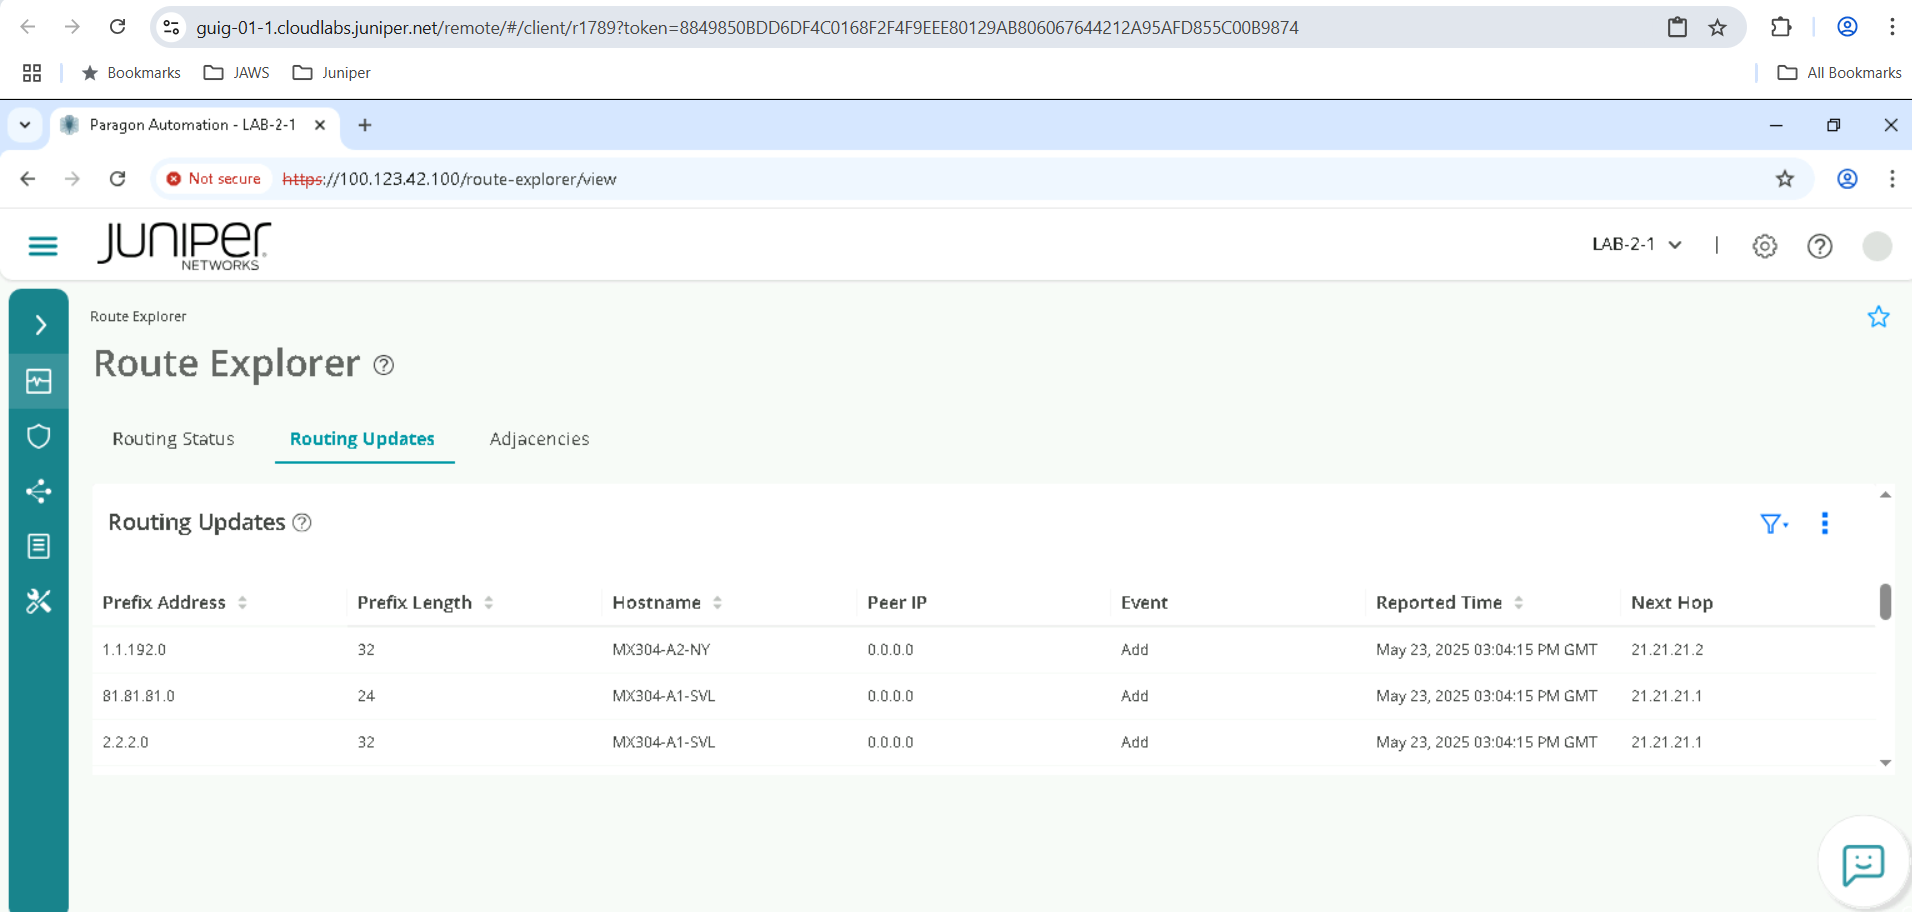
Navigate to observability>Route explorer>Routing Updates.
When we Click on Routing Updates, there will be Prefix addresses listed. Note down the first prefix and note the prefix length as both will be required for next set of steps . in the below case the prefix address is 1.1.192.0 and prefix length is 32 , but you may see a different one. Please note the reported time needs to be within the last 12 hours .
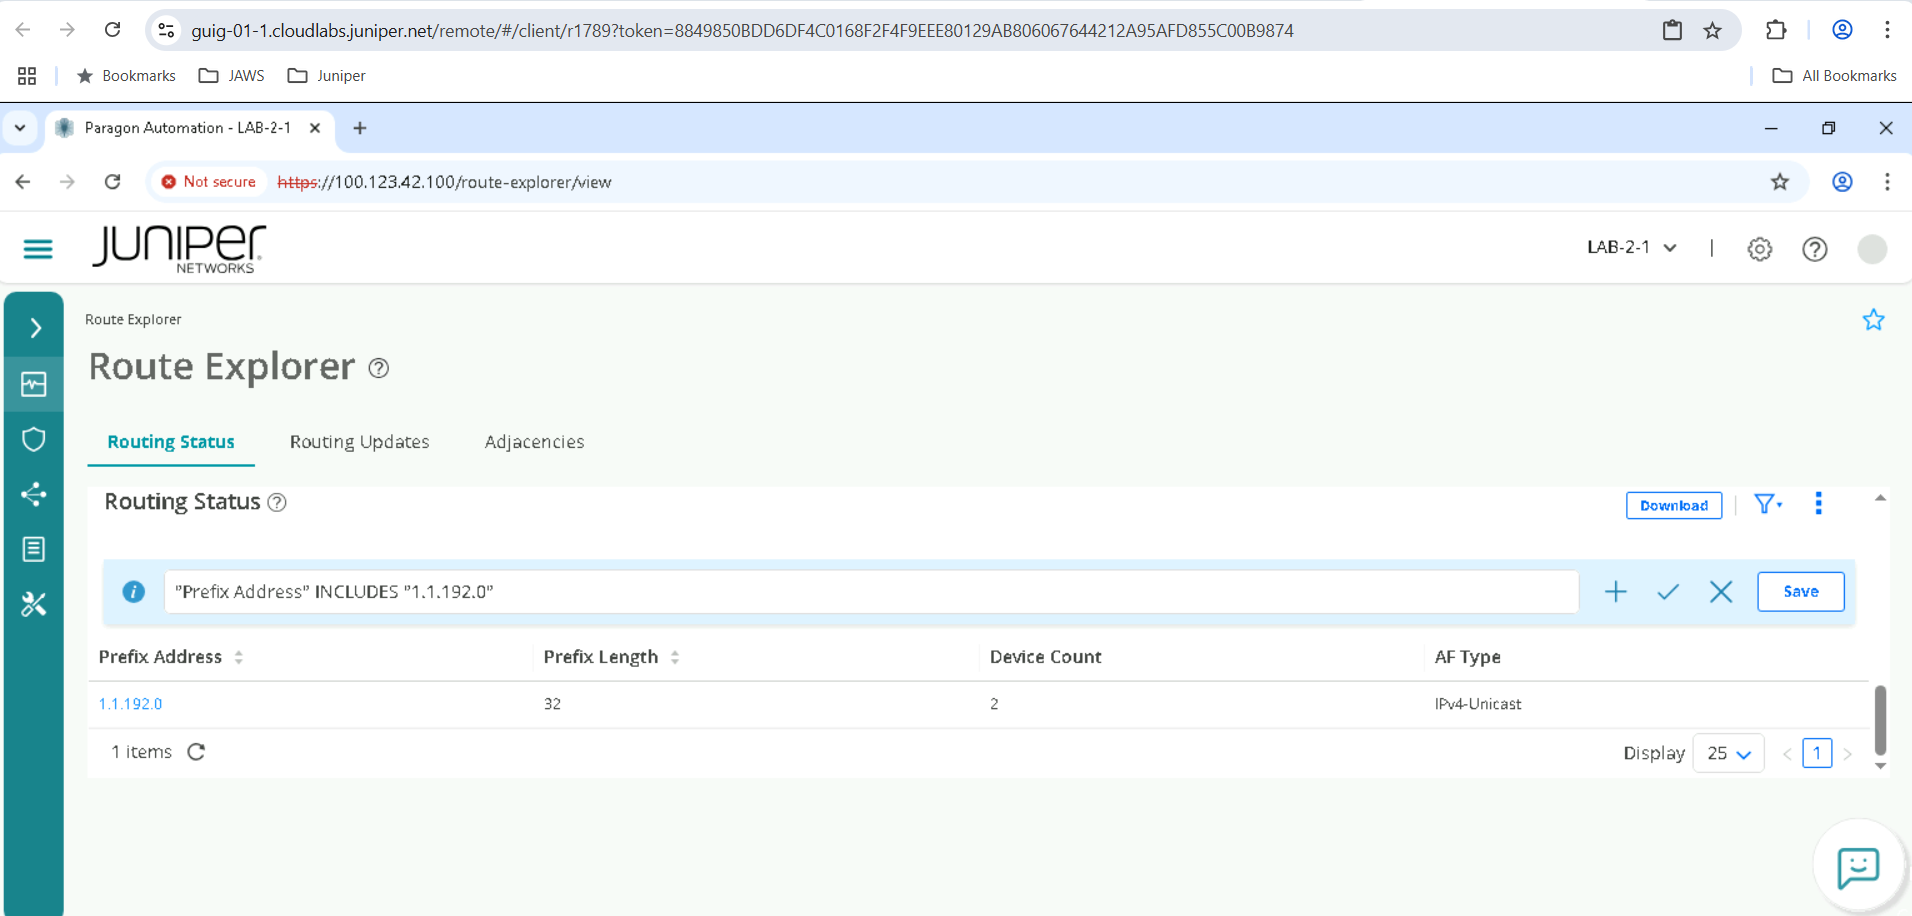
Click back on on the Routing Status page and click on the Funnel / Advanced filter, change the Field to Prefix address and in the Value include the earlier copied prefix and click on Add.
The prefix will now be displayed but also note there may be multiple entries each listed with a different prefix length, so select the one which has the prefix length that was previously noted and click on this Prefix address. This will take you back to the Routing updates page, albeit with a filtered version for the selected prefix, review the timeline and observe the add and or delete events for this prefix address with the correct prefix length.
You have successfully completed this Hands-On Lab!
Lab Survey
Please take 2 minutes and complet the Routing Analytics Hands-On Lab Survey