
Apstra Marvis Better together lab guide.
Overview
The demonstration starts with a pre-configured Apstra setup that has rack type, template, logical device and blueprint already pre-configured. Day 1 and Day 2 Apstra configurations are also done to showcase creation of routing zone, virtual networks, remote EVPN gateways, routing policies and connectivity templates. The purpose is to showcase Apstra DCI integration with Marvis and showcase the anomalies via the Marvis Dashboard. This process includes downloading and installing Apstra edge on the Apstra VM, running the Apstra edge docker container, registering the container on the JCloud instance Web UI, generating anomalies and showcasing it on the Marvis dashboard and remediating the errors produced.
Day 0 activity
Discover the vEX devices using Offbox agent and manage them
Assign system IDs to respective device parameters
Day 1 activity
Verify the configuration of templates, rack types, logical devices, interface mapping, blueprint. virtual networks, routing zones, connectivity templates and routing policy
Deploy the configuration onto the fabric
Untar the Apstra Edge package
Create an organization in JCloud
Register Apstra Edge in JCloud
Day 2 activity
Generate anomalies in Apstra
Verify anomalies in the Marvis dashboard
Resolves the anomalies and re-verify in the Marvis dashboard
Review the Impact analysis and Service aware tabs in JCloud
Starting Lab
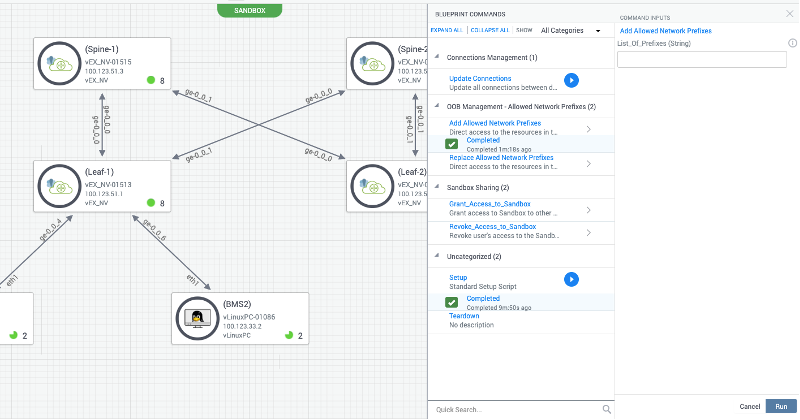
Topology
Topology consists of a 2-stage leaf spine architecture. We have 3 end hosts/BMS connecting to the leafs. The BMS-1 and BMS-3 are part of the same VN and BMS-2 belongs to a different VN.
Access Details
Once you have submitted the form check your inbox and you should have received an email from (_jcl-hol@juniper.net) containing the lab details as show below.
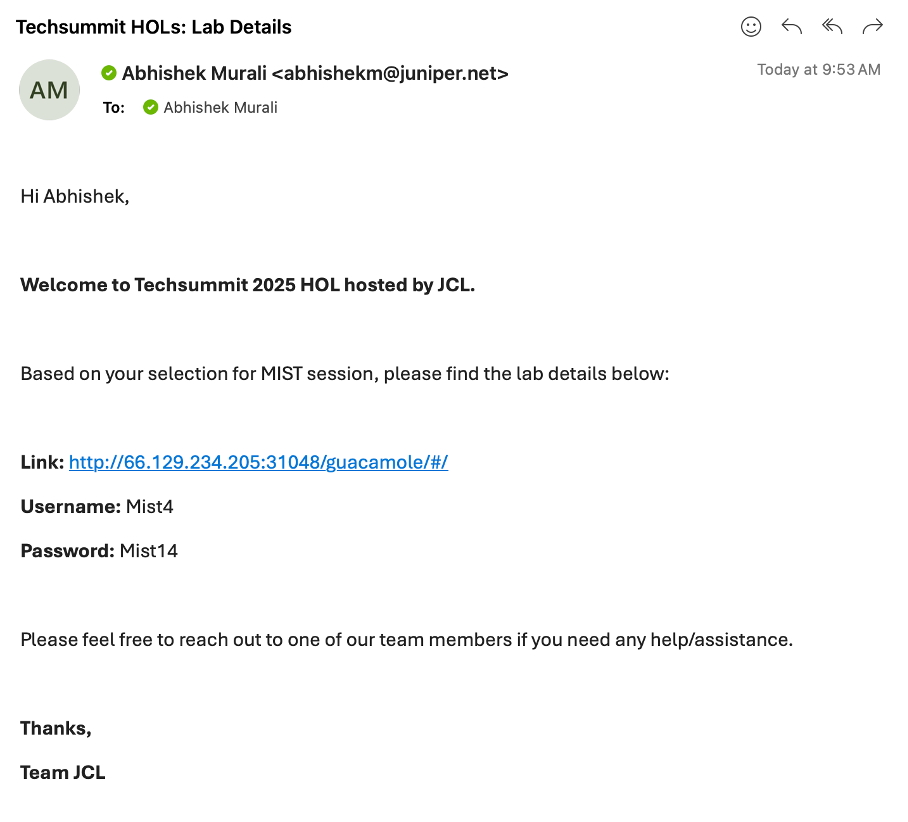
Open a browser and http into server Link provided to you in the above email.
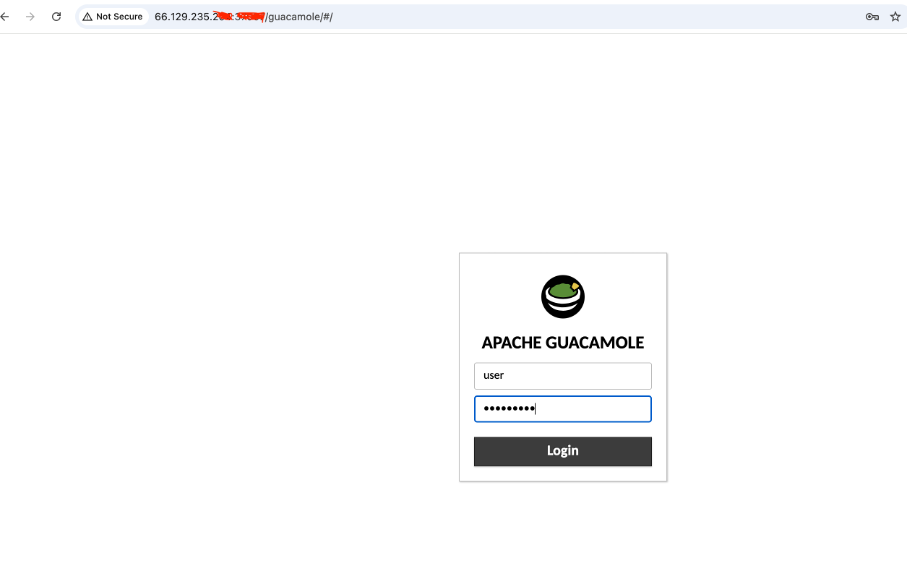
Login with username and the password shared via email.
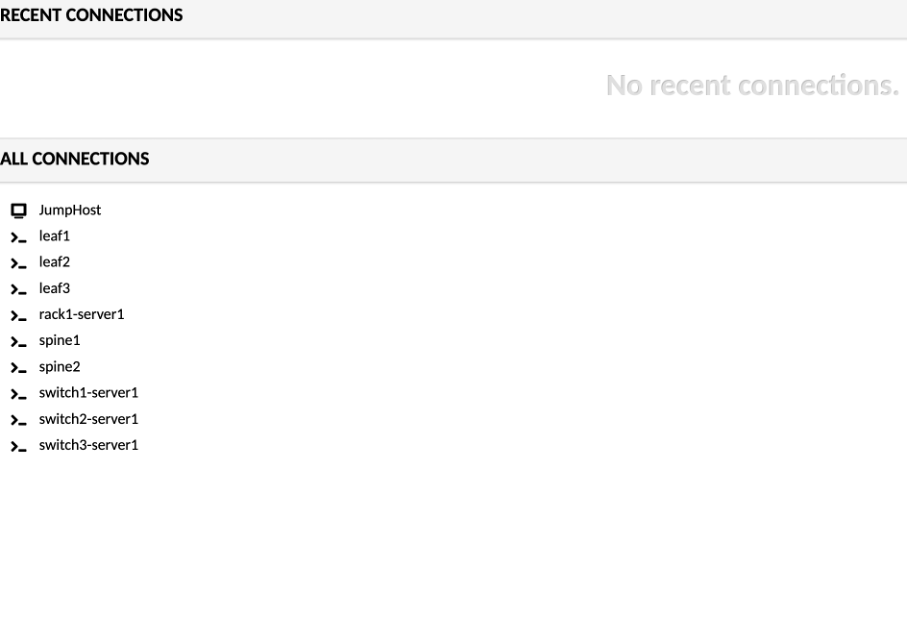
Click on JumpHost, to login:
user - jumpstation
password - Juniper!1
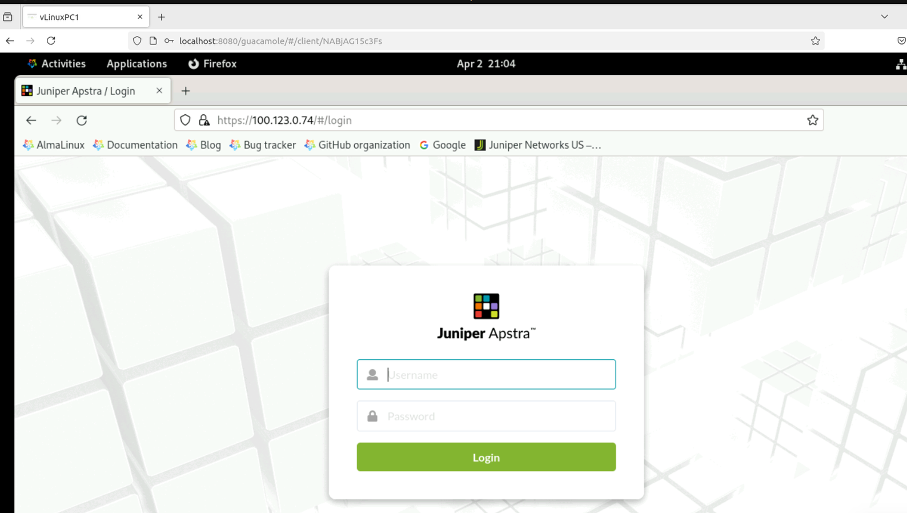
Open a Firefox browser and navigate to Apstra UI: https://100.123.0.74 with username: admin and password: Juniper!1
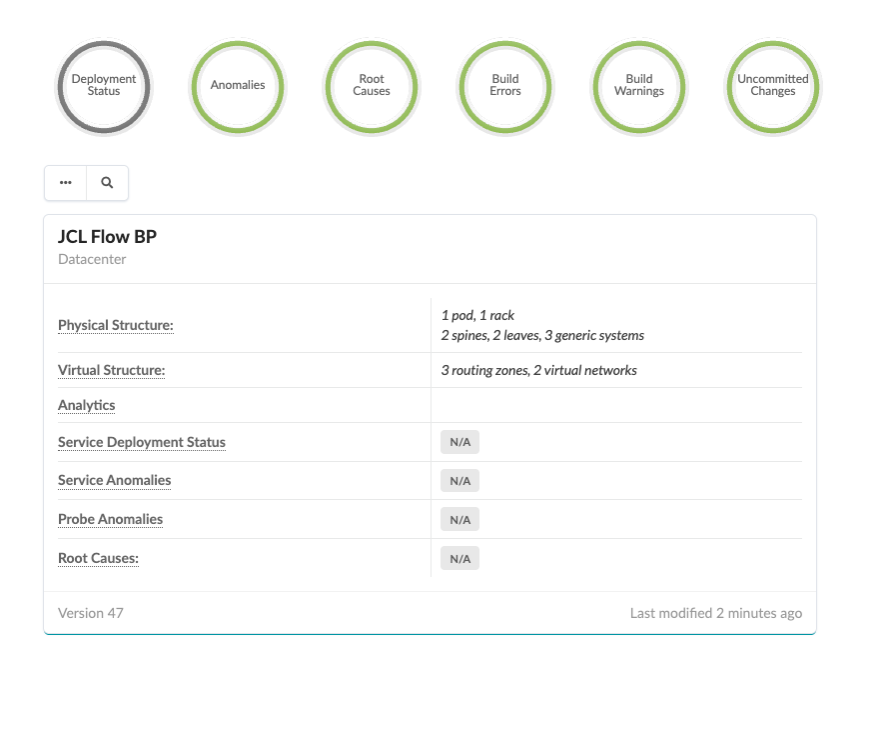
Navigate to Blueprints, You will be working with JCL Flow BP blueprint.

Reviewing DC Configuration (Pre-Configured)
Review Resources
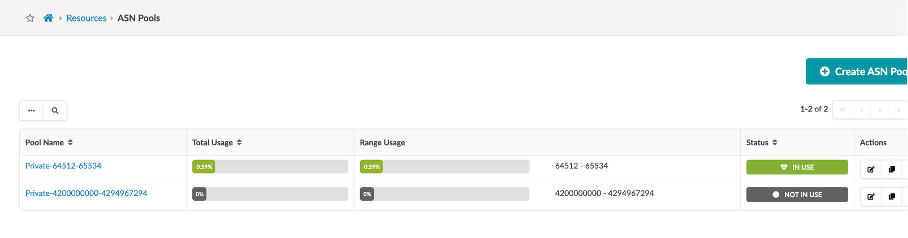
Navigate to Resources > IP Pools section in Apstra UI.
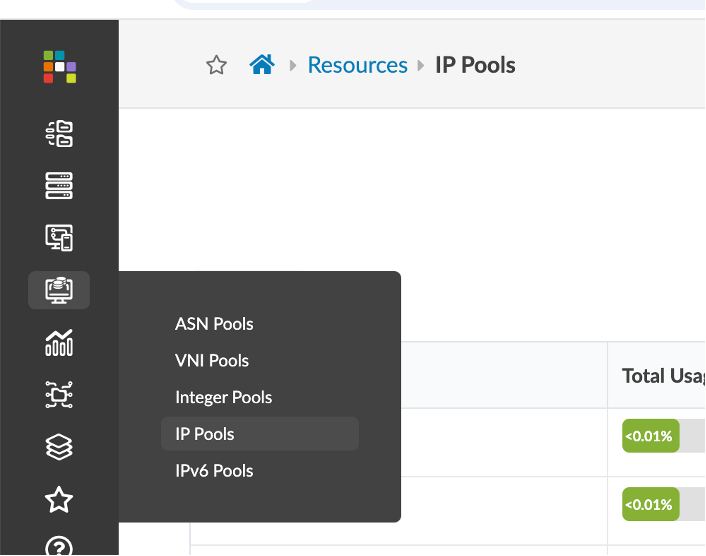
For this demo we will be using the default IP and ASN pool that comes pre-configured with Apstra.
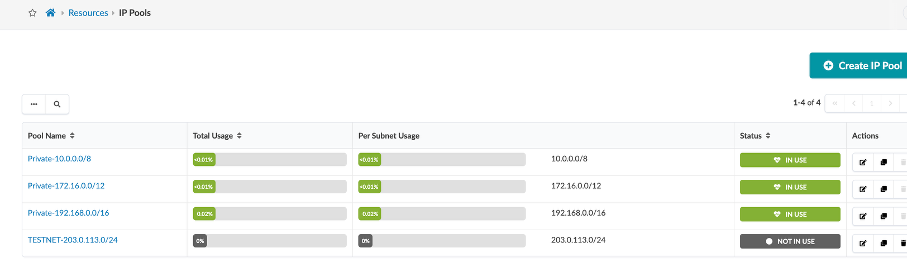
You can create multiple IP Pools using the Create IP Pool button as shown.
Similarly, cross check ASN and VNI Pools and view how to create an ASN pool.
Device Profiles (Pre-configured)
Device Profiles are like Hardware Compatibility lists, and they describe the hardware capabilities and interface capacities of the network device as well as the software versions that are compatible with AIS
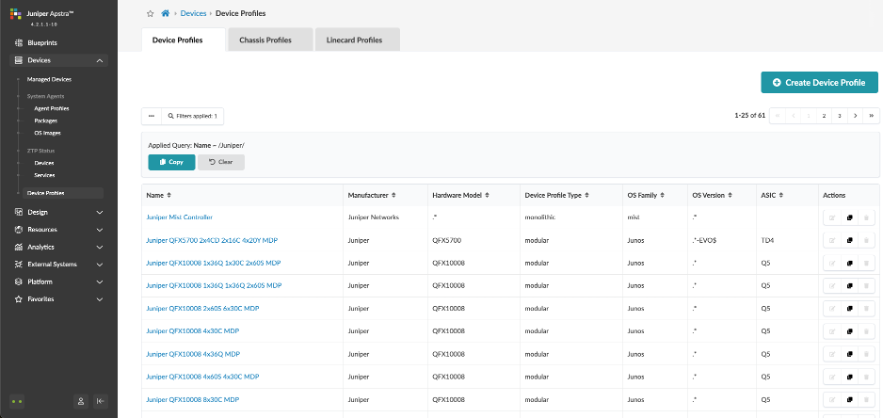
Navigate to Device > Device Profiles
We see a list of devices from different vendors. We can also use “Query” at the top to search for Juniper devices
We not expected to create device profiles for the switches. These, like the ASN and VNI pools come out of the box with a new AOS installation
Device Profiles used in this demo:
Leaf: Juniper vEX
Spine: Juniper vEX
Logical Devices (Pre-configured)
One of the benefits of using AIS is that the architect can decide on the associated network resource later in the design process. Instead, we create logical devices.
Logical devices let us create a “generic” network device and define the generic device parameters
Navigate to Design > Logical Devices
In this demo, we need a logical device for a Leaf role which requires 2x10Gbps access ports to connect to the BMS’s and 2x10Gbps uplink ports.
We can use “Query” at the top to search for ‘JCL’.
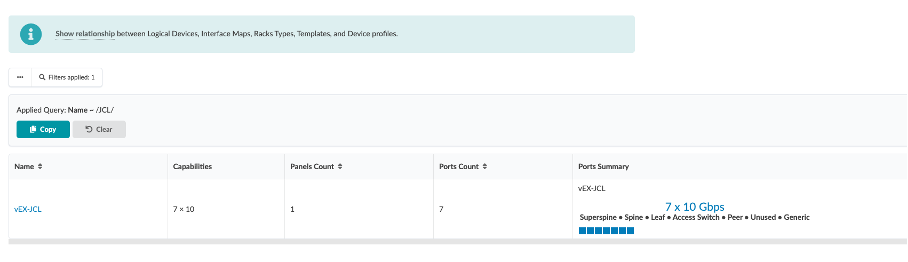
Logical Devices used for the purpose of this demo are as below
Leaf Logical Device: vEX-JCL
Spine Logical Device: vEX-JCL
Later, while at the build stage we select the actual network devices that will be used in the data centre fabric by choosing a ‘Device profile’ that fits into the requirements of the Logical device.
Interface Maps (Pre-configured)
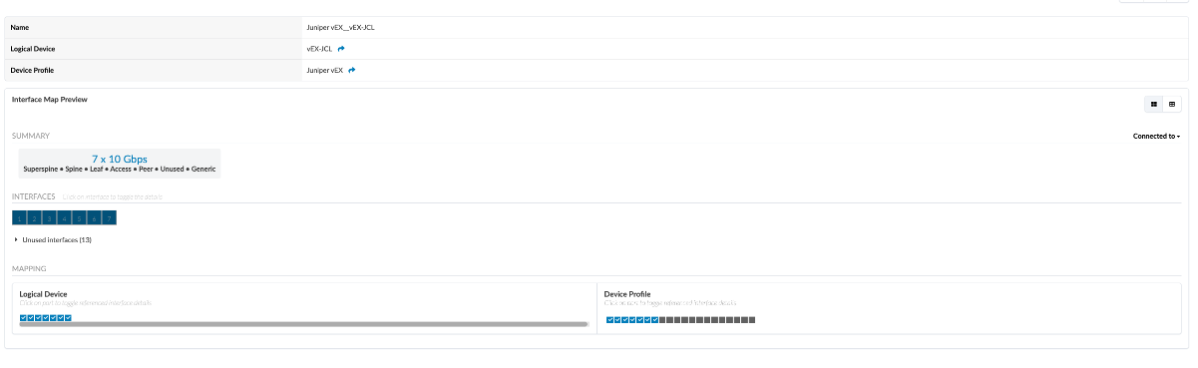
Interface Maps map a ‘Logical device’ with a ‘Device Profile’ that fits the definitions of a Logical device. Apstra ships with several predefined Interface Maps and for this demo, we use the shipped ones.
Navigate to Design > Interface Maps, to explore the predefined Interface Maps
Search for Juniper_vEX in the ‘Query’ bar for the Interface Map name
Interface Maps used in this demo:
Leaf logical device AOS-7x10-Leaf: Juniper vEX__vEX-JCL
Spine logical device AOS-7x10-Spine: Juniper vEX__vEX-JCL
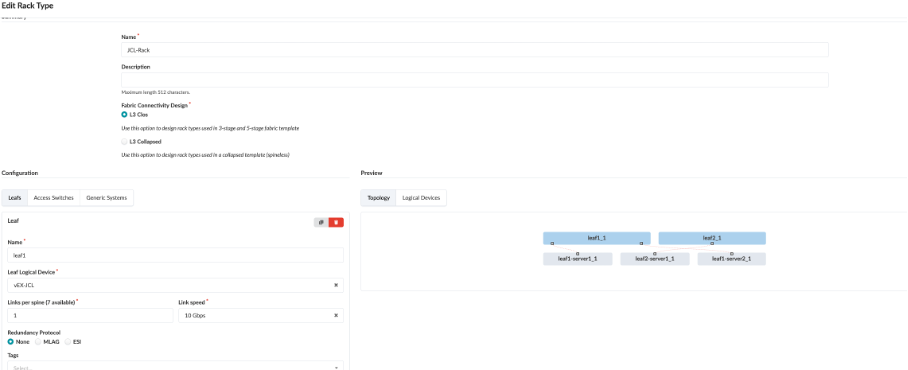
Review Rack Types
Rack Types are modular definitions containing top-of-rack switches, workloads, and their associated connections. There are also redundancy protocol settings and other details contained. The racks we have built will be used in the next stages of modelling our lab fabric. Like the other building blocks we will work with, there are several pre-defined examples that come with the server. You can examine them in the list to get a feel for the possibilities. They can all be easily cloned and modified to give us the exact characteristics we need to architect our fabric.
These are already pre-configured so you just need to review them and not create them.
Navigate to Design > Rack Types > Create in Builder, to explore and create the rack types.
The rack that has been used for the purpose of this demo is JCL-Rack.
You can query for the same and check the rack used in this demo.
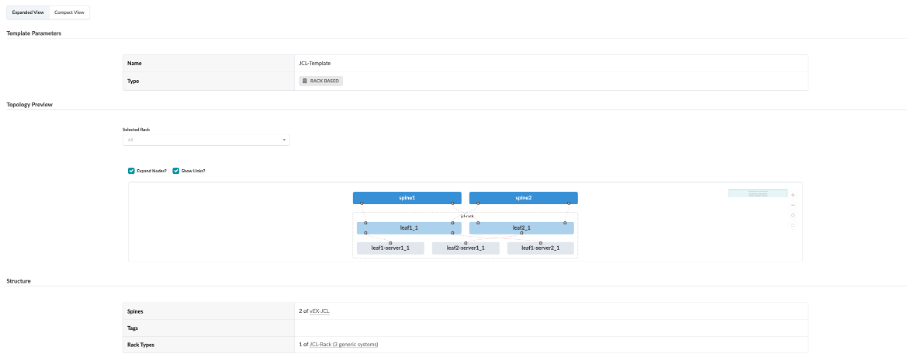
Review Templates
This is the last step in the data centre design workflow. A template brings together the spine devices and leaves/racks (along with some other parameters) to create a reusable fabric design. Apstra ships with several predefined templates, but for this demo we create our own. A template can be a rack, a row, a pod, or the entire data centre. (Template is already pre-created).
Navigate to Design > Templates
Click on JCL-Template template, and review the details:
Deploying Blueprint
In this section, we create an active blueprint using the template created in the previous section, render the cabling plan, create offbox agents for the fabric devices and deploy the underlay and overlay configuration.
Navigate to Blueprint – JCL Flow BP
Onboard Devices
At this point, we will configure the agents to discover the Junos devices and create the off-box device agent which will be used by AOS to manage the devices.
Navigate to Devices > Managed Devices
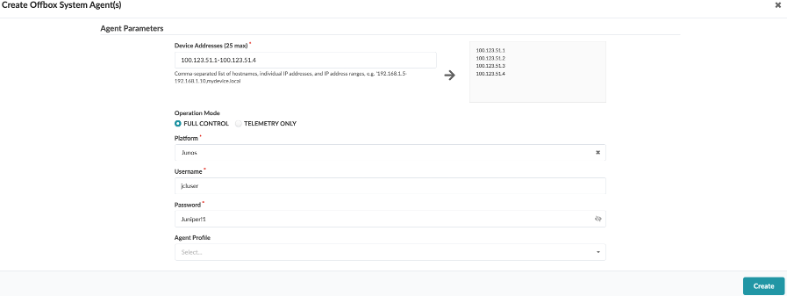
Click on Create Offbox Agent(s) at the top right of the screen,and enter the following:
Device Addresses - 100.123.51.1-100.123.51.4
Platform - Junos
Username - jcluser
Password - Juniper!1
Click on Create.
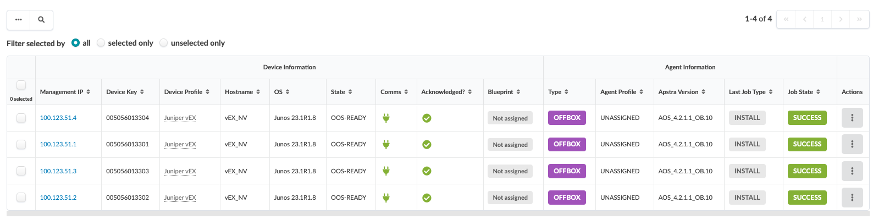
Back on the OFFBOX page, we should see the devices appear. Notice the Job State shows IN PROGRESS and the Type is OFFBOX
After a few minutes, the Job State should change to SUCCESS, and the Comms should show.
To bring vEX devices under Apstra management, acknowledge devices. To acknowledge the devices, select them and in the toolbar that appears click Acknowledge selected systems.
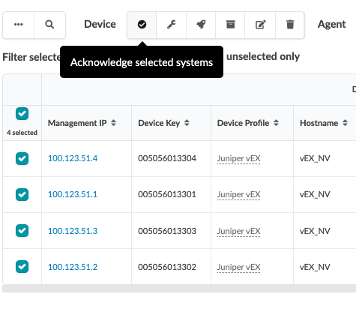
The circles in the Acknowledged column change to green checkmarks, confirming that the devices are now ready to be managed by Apstra.
At this point, we would be able to add the devices to our blueprint.
Assign System IDs to Fabric Nodes
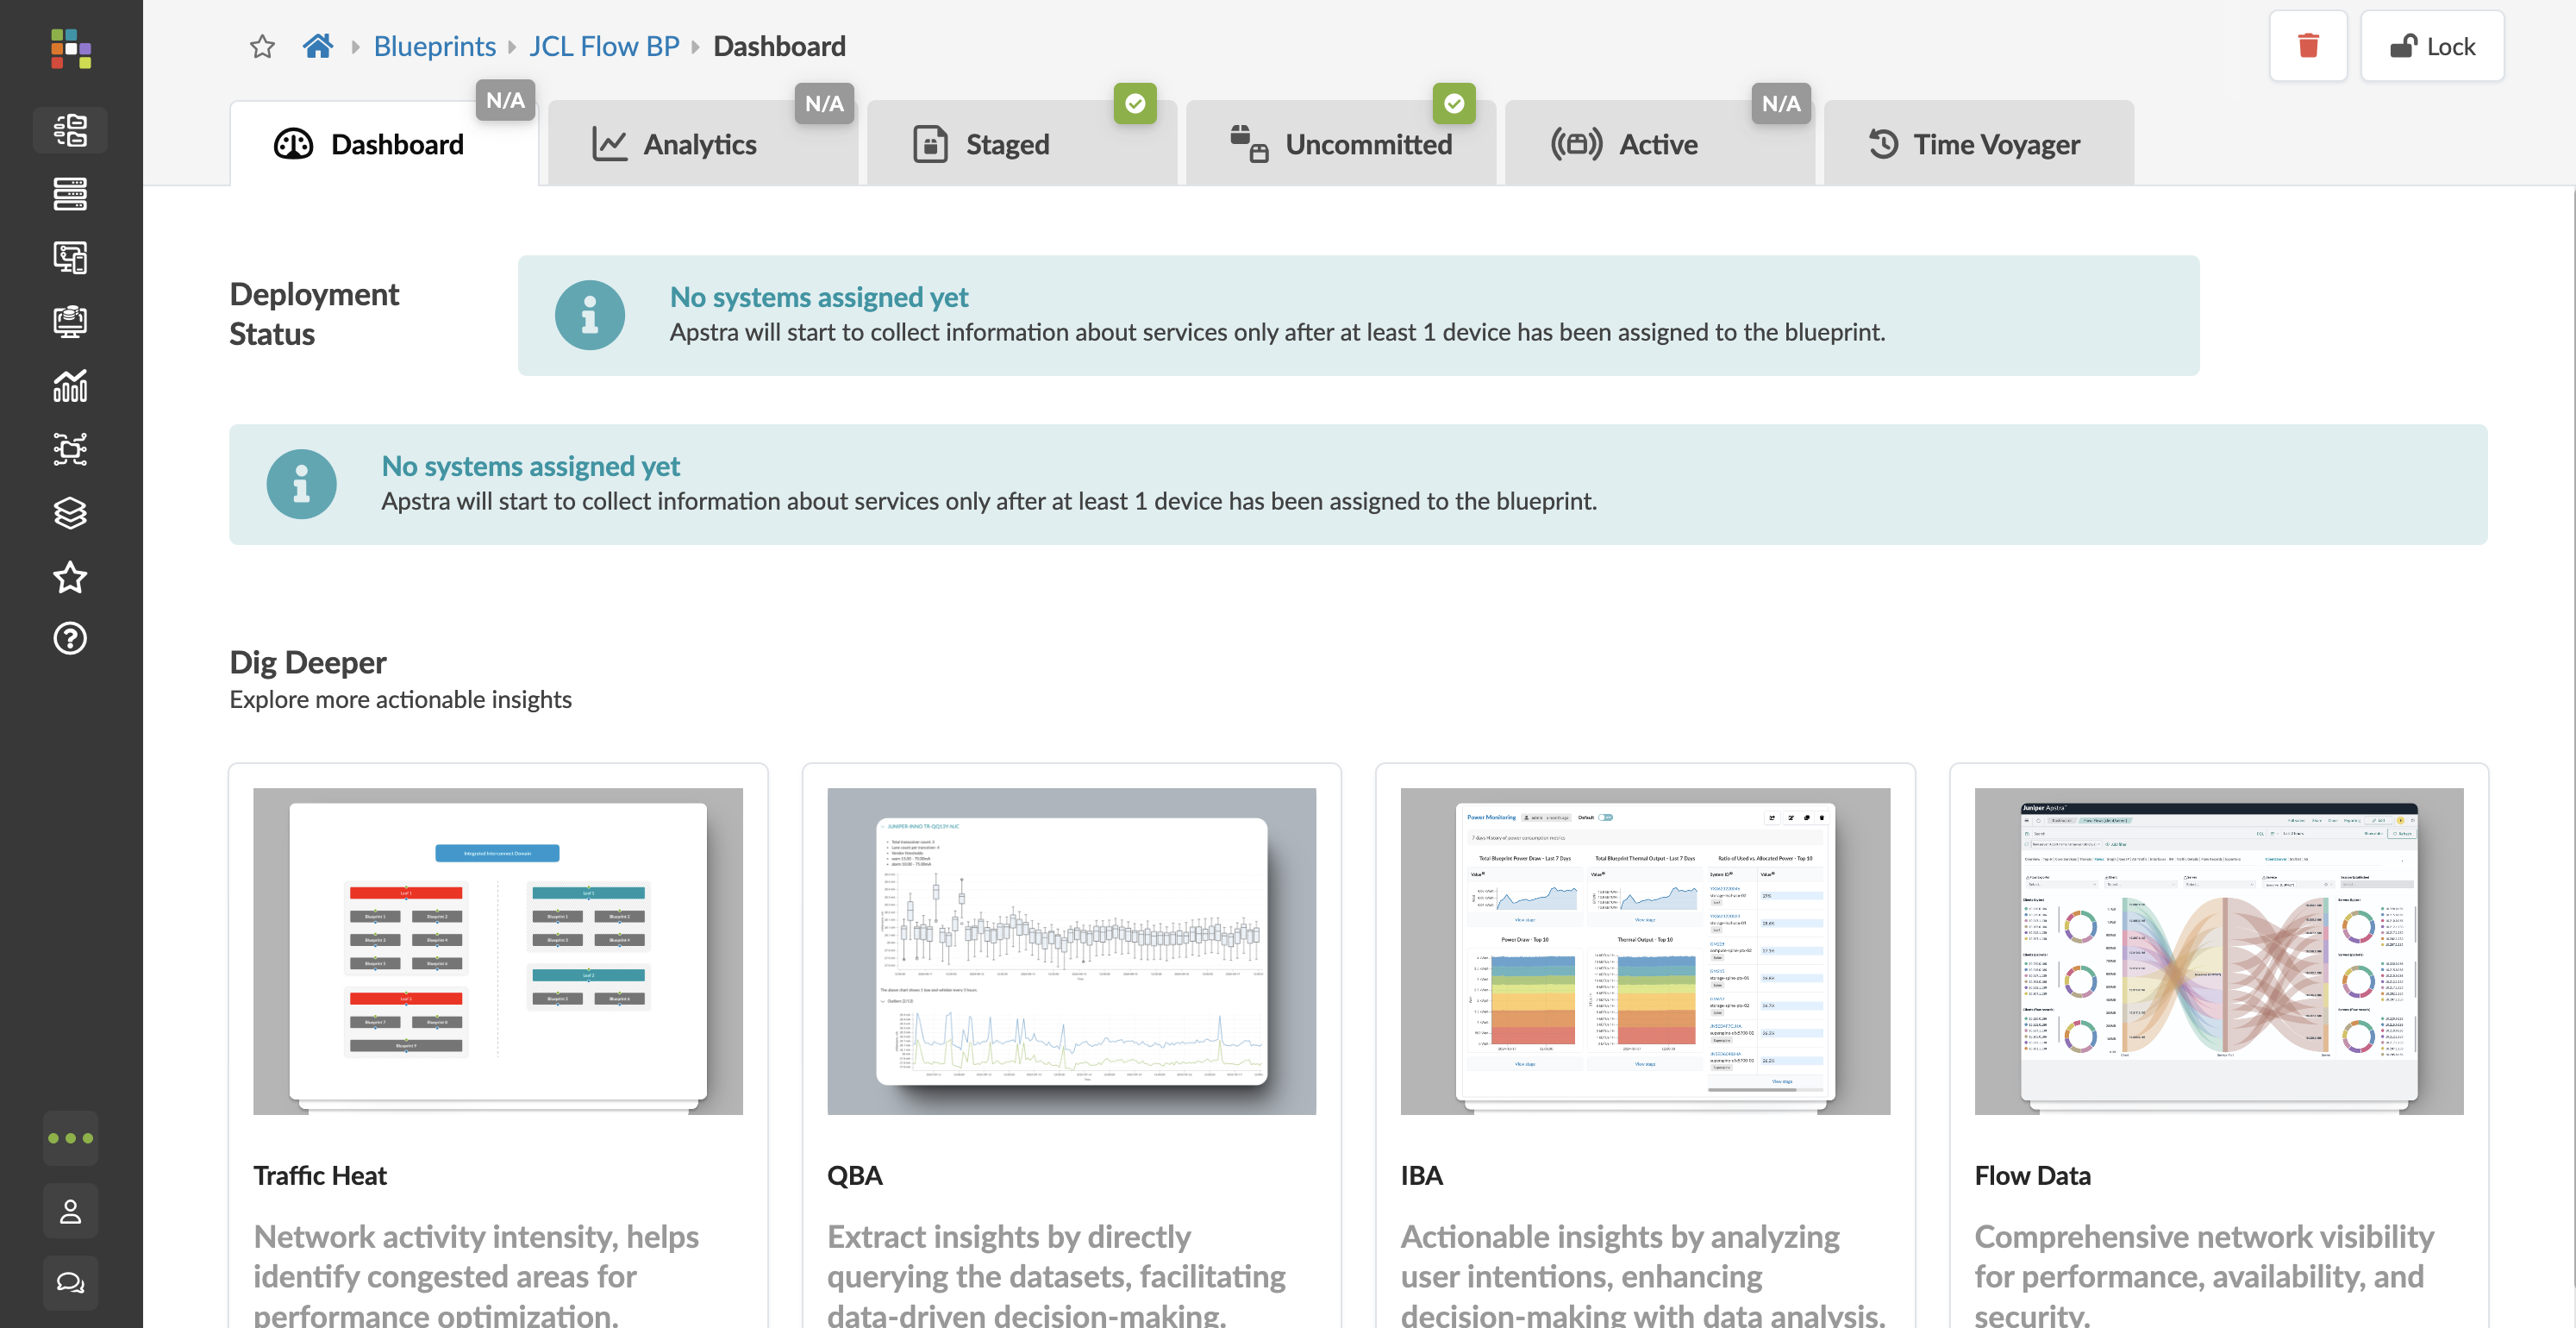
Click the Blueprints icon in the menu bar on the left and select JCL FLow BP.. This opens up the Blueprint Dashboard.
Navigate to the Staged tab.
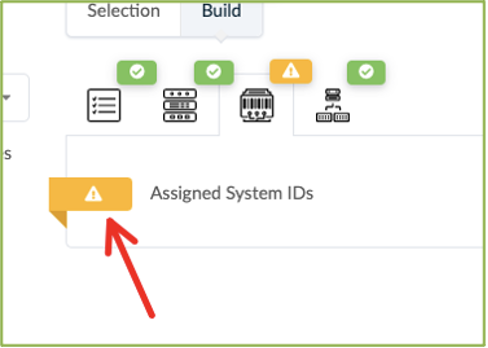
Click the Devices tab in the Build workspace on the right of the screen.
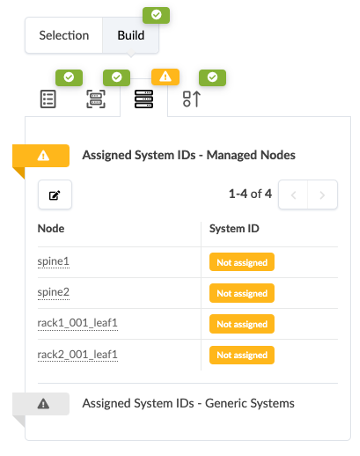
Click the yellow splat to the left of Assigned System IDs.
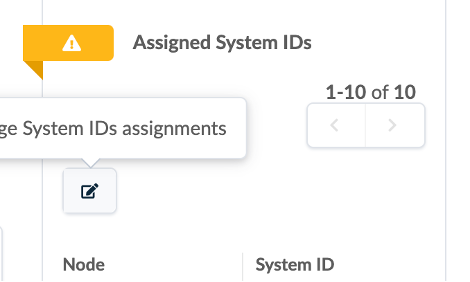
Click on Change System ID Assignment.
Associate each fabric node with the correct System ID/IP Address as shown in the img below:
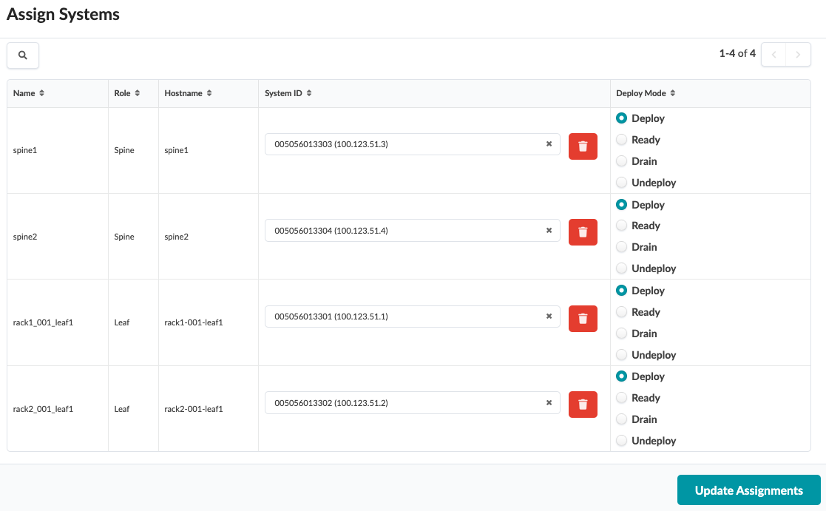
Use the drop down window to assign device IDs to devices (spine, server leaf and border leaf).
Mode - Deploy (in right column)
Click on Update Assignments
Spine1 : 100.123.51.3 Spine2 : 100.123.51.4 leaf1 : 100.123.51.1 leaf2: 100.123.51.2
Import the Junos OS Apstra Flow Configlet
Import the Configlet
A standard Junos sFlow confliget is provided with your product. You’ll want to clone this default configlet, modify it to your needs, and then import it into your blueprint from the Apstra GUI see Example: Junos OS Apstra Flow Configlet.
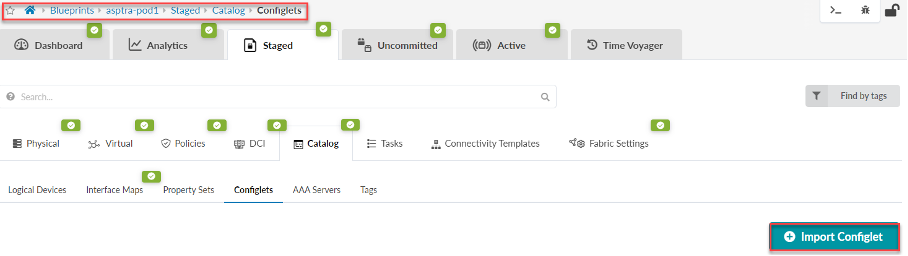
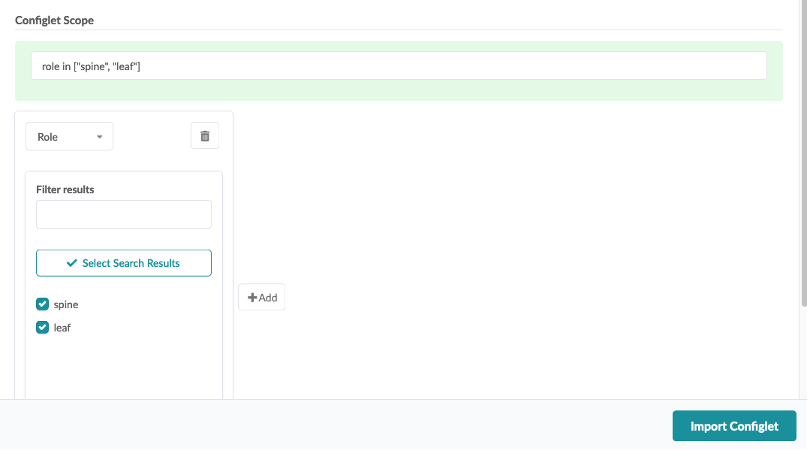
To import the flow data configlet into Apstra: From the left navigation menu in the Apstra GUI, navigate to Blueprints > Analytics > Staged. From the Catalog tab, select Configlets, then click Import Configlet
From the Configlet drop-down menu, select Flow Data for Optional Flow Analytics
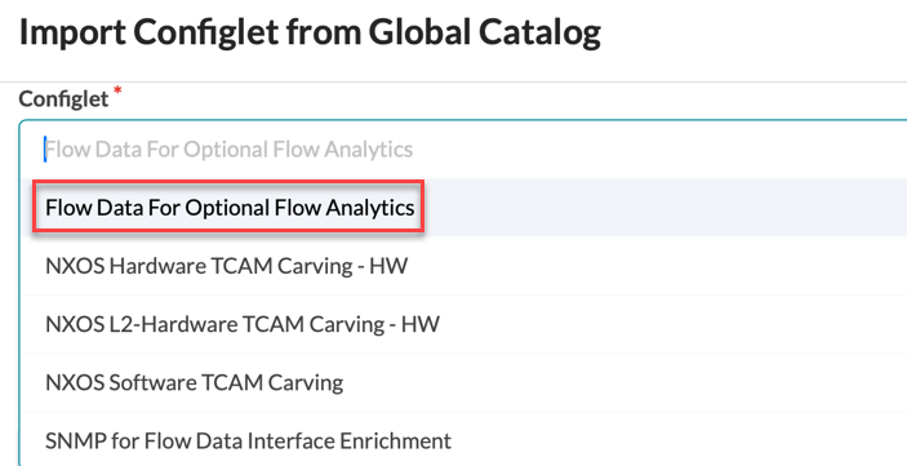
Select the devices you want to apply the configlet to, then click Import Configlet

Edit the property set to add the collector IP address of your Flow Data VM, then click Update
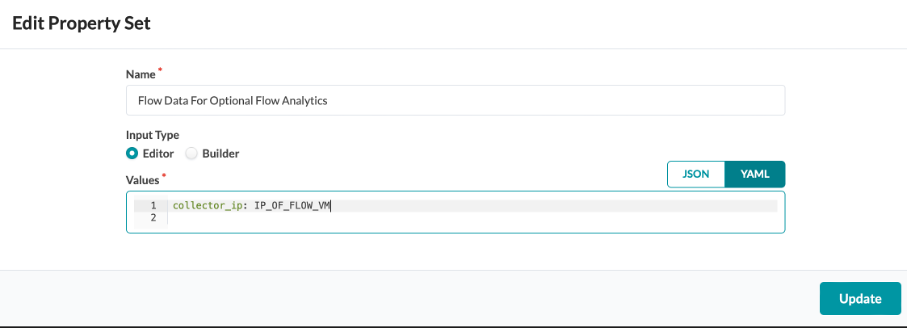
Note: The property set needed for these configlets are pre-configured
Under Property Set, select Flow Data For Optional Flow Analytics, then click Import Property Set
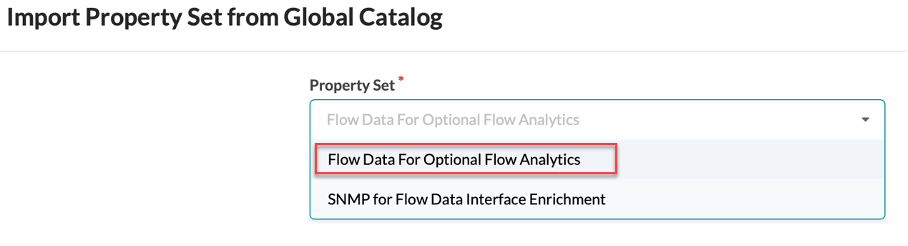
Finally, commit your configuration to import the configlet to your Junos devices
Configure SNMP for Interface Name Enrichment
If you prefer to see actual interface names such as xe-0/0/1 over interface indexes, Apstra Flow must query the devices using SNMP. This process is necessary for this type of enrichment.
Perform the following steps to configure SNMP:
From the left navigation menu in the Apstra GUI, navigate to Blueprints and select the blueprint you want to update. Navigate to the Staged >Catalog tab, select Configlets, then click Import Configlet

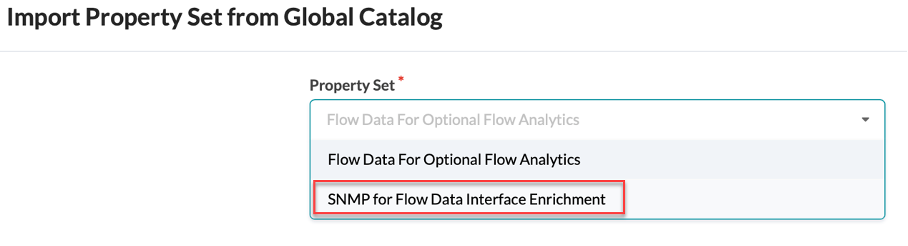
From the Global Catalog, select Example SNMPv2 configlet for flow-data interface enrichment
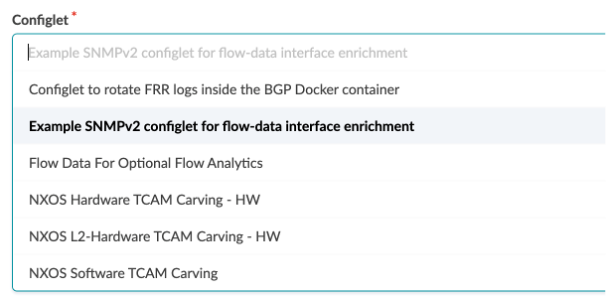
Select the devices you want to apply the configlet to, then click Import Configlet
Under Property Set, select SNMP for Flow Data Interface Enrichment, then click Import Property Set
Finally, commit your configuration to import the configlet to your Junos devices
Commit and Deploy the Blueprint
The next step is to Commit the configuration and deploy it from Apstra to the vEX devices.
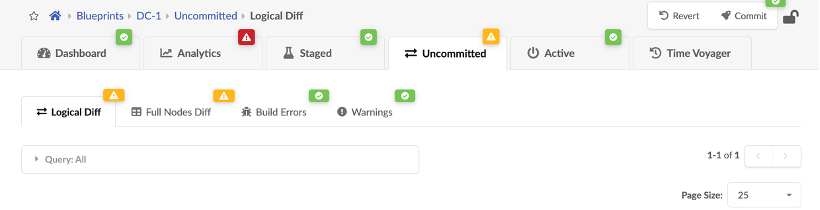
Navigate to the Uncommitted tab on the blueprint, and click Commit at the top right corner of the screen. This should take care of deploying the blueprint.
Now, wait for 3-4 mins for the deployments to finish and the alarms to resolve.
If there are alarms, follow the workflow below to re-apply the JCL underlay host scripts that interconnect the fabric nodes
-->If there are no alarms, proceed, if there are alarms, reach out to the lab team.
Reviewing Blueprint (Pre-configured)
In this section, we create Security Zones and Virtual Networks to enable multi-tenancy in the data centre overlay network and configure Configlets
NOTE: We are not required to configure anything as we have already configured them for the demo just review each section
Routing Zones (Pre-configured)
The routing zone provides inter-VLXAN routing and isolation among different tenants.
Navigate to Staged > Virtual. Go to Routing Zones and create a new Routing Zone
For this demo we have used the “New_RZ”
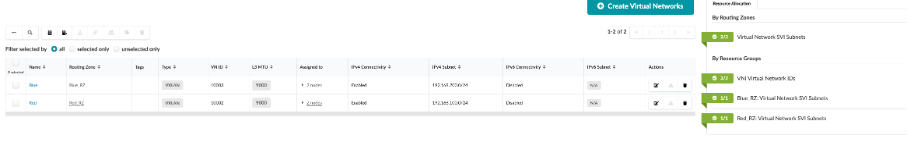
Virtual Networks (Pre-configured)
Navigate to Staged > Virtual. Go to Virtual Networks
Connectivity Templates (Pre-configured)
Here we associate the endpoints with their associated virtual networks
Navigate to Staged > Connectivity Templates
Click on Untagged VxLAN ‘Red’
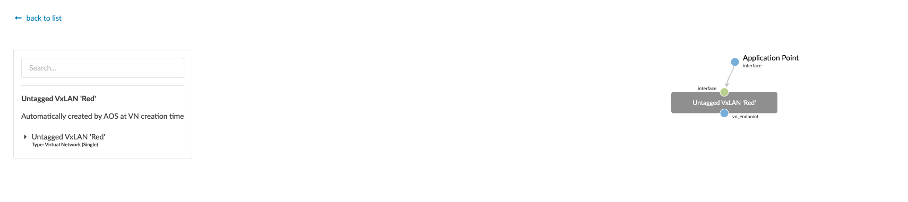
As seen its assigned on 2 endpoints i.e on ge-0/0/4 on Leaf1 and Leaf2
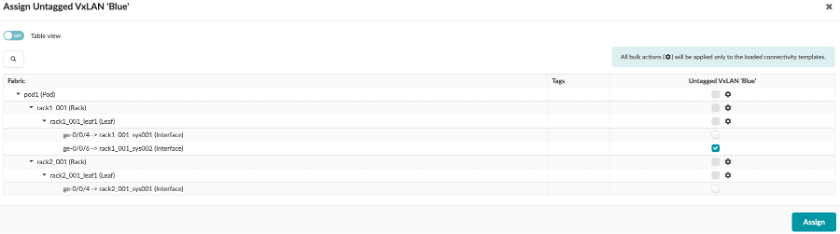
Similarly, Untagged VxLAN ‘Blue’ is assigned to one end point ie. ge-0/0/6 on Leaf1
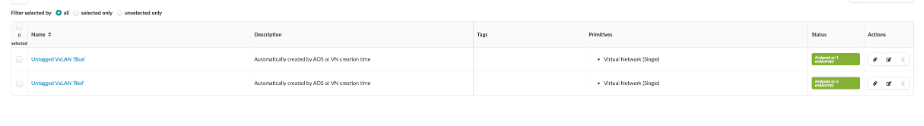
Resulting Connectivity Template screen would list Untagged VxLANs with an Assigned on xx endpoint(s) status.
Simulate/Generate traffic in Fabric
For the purpose of the demo we are required to generate test traffic in the fabric which can be then used for analysis. We should leave the traffic running for some time so that we have enough data for analysis.
SSH into BMS1 by clicking on the BMS1 connection:
Use the below command to generate HTTPS traffic from BMS1 - BMS3
sudo timeout 600 hping3 -S -p 443 -d 200 192.168.100.11
Apstra Flow Configuration
Review Apstra Premium License
From the left navigation menu, select Platform > Licenses

As you can see, we have already applied the license needed for this demo
Flow VM configuration
Now, SSH into the Flow VM by clicking on the Flow VM connection seen:
Once you login to the Flow VM
Restart the Flow Services
After you apply your license in Apstra, restart your flow services so that the services can pick up the license
To restart the services:
SSH to the Flow VM. The default login credentials are: apstra/apstra
Restart the collector service sudo systemctl restart flowcoll
Restart the OpenSearch service sudo systemctl restart opensearch
Restart the OpenSearch dashboard service sudo systemctl restart opensearch-dashboards
Setting up and connecting Apstra Edge with Apstra Cloud Services
Apstra 5.1 introduced the ability to configure the Apstra Edge connector directly inside the Apstra UI. This greatly simplifies the installation process required in Apstra 4.2.1 - 5.0. The new process in Apstra 5.1 eliminates the multiple manual steps required to load and activate Apstra Edge.
In addition to these changes, Apstra Cloud Services has added the facilities to manage the update process to keep the Edge container at the latest level. However, the included version (0.5.0) predates this capability. Therefore, the Edge version on the new 5.1 server must be manually updated to an upgrade capable version to initiate this functionality. Once this has been done, all future updates are managed by the system.
Creating Org and Adopting Edge on Jcloud (Juniper Apstra Cloud Services)
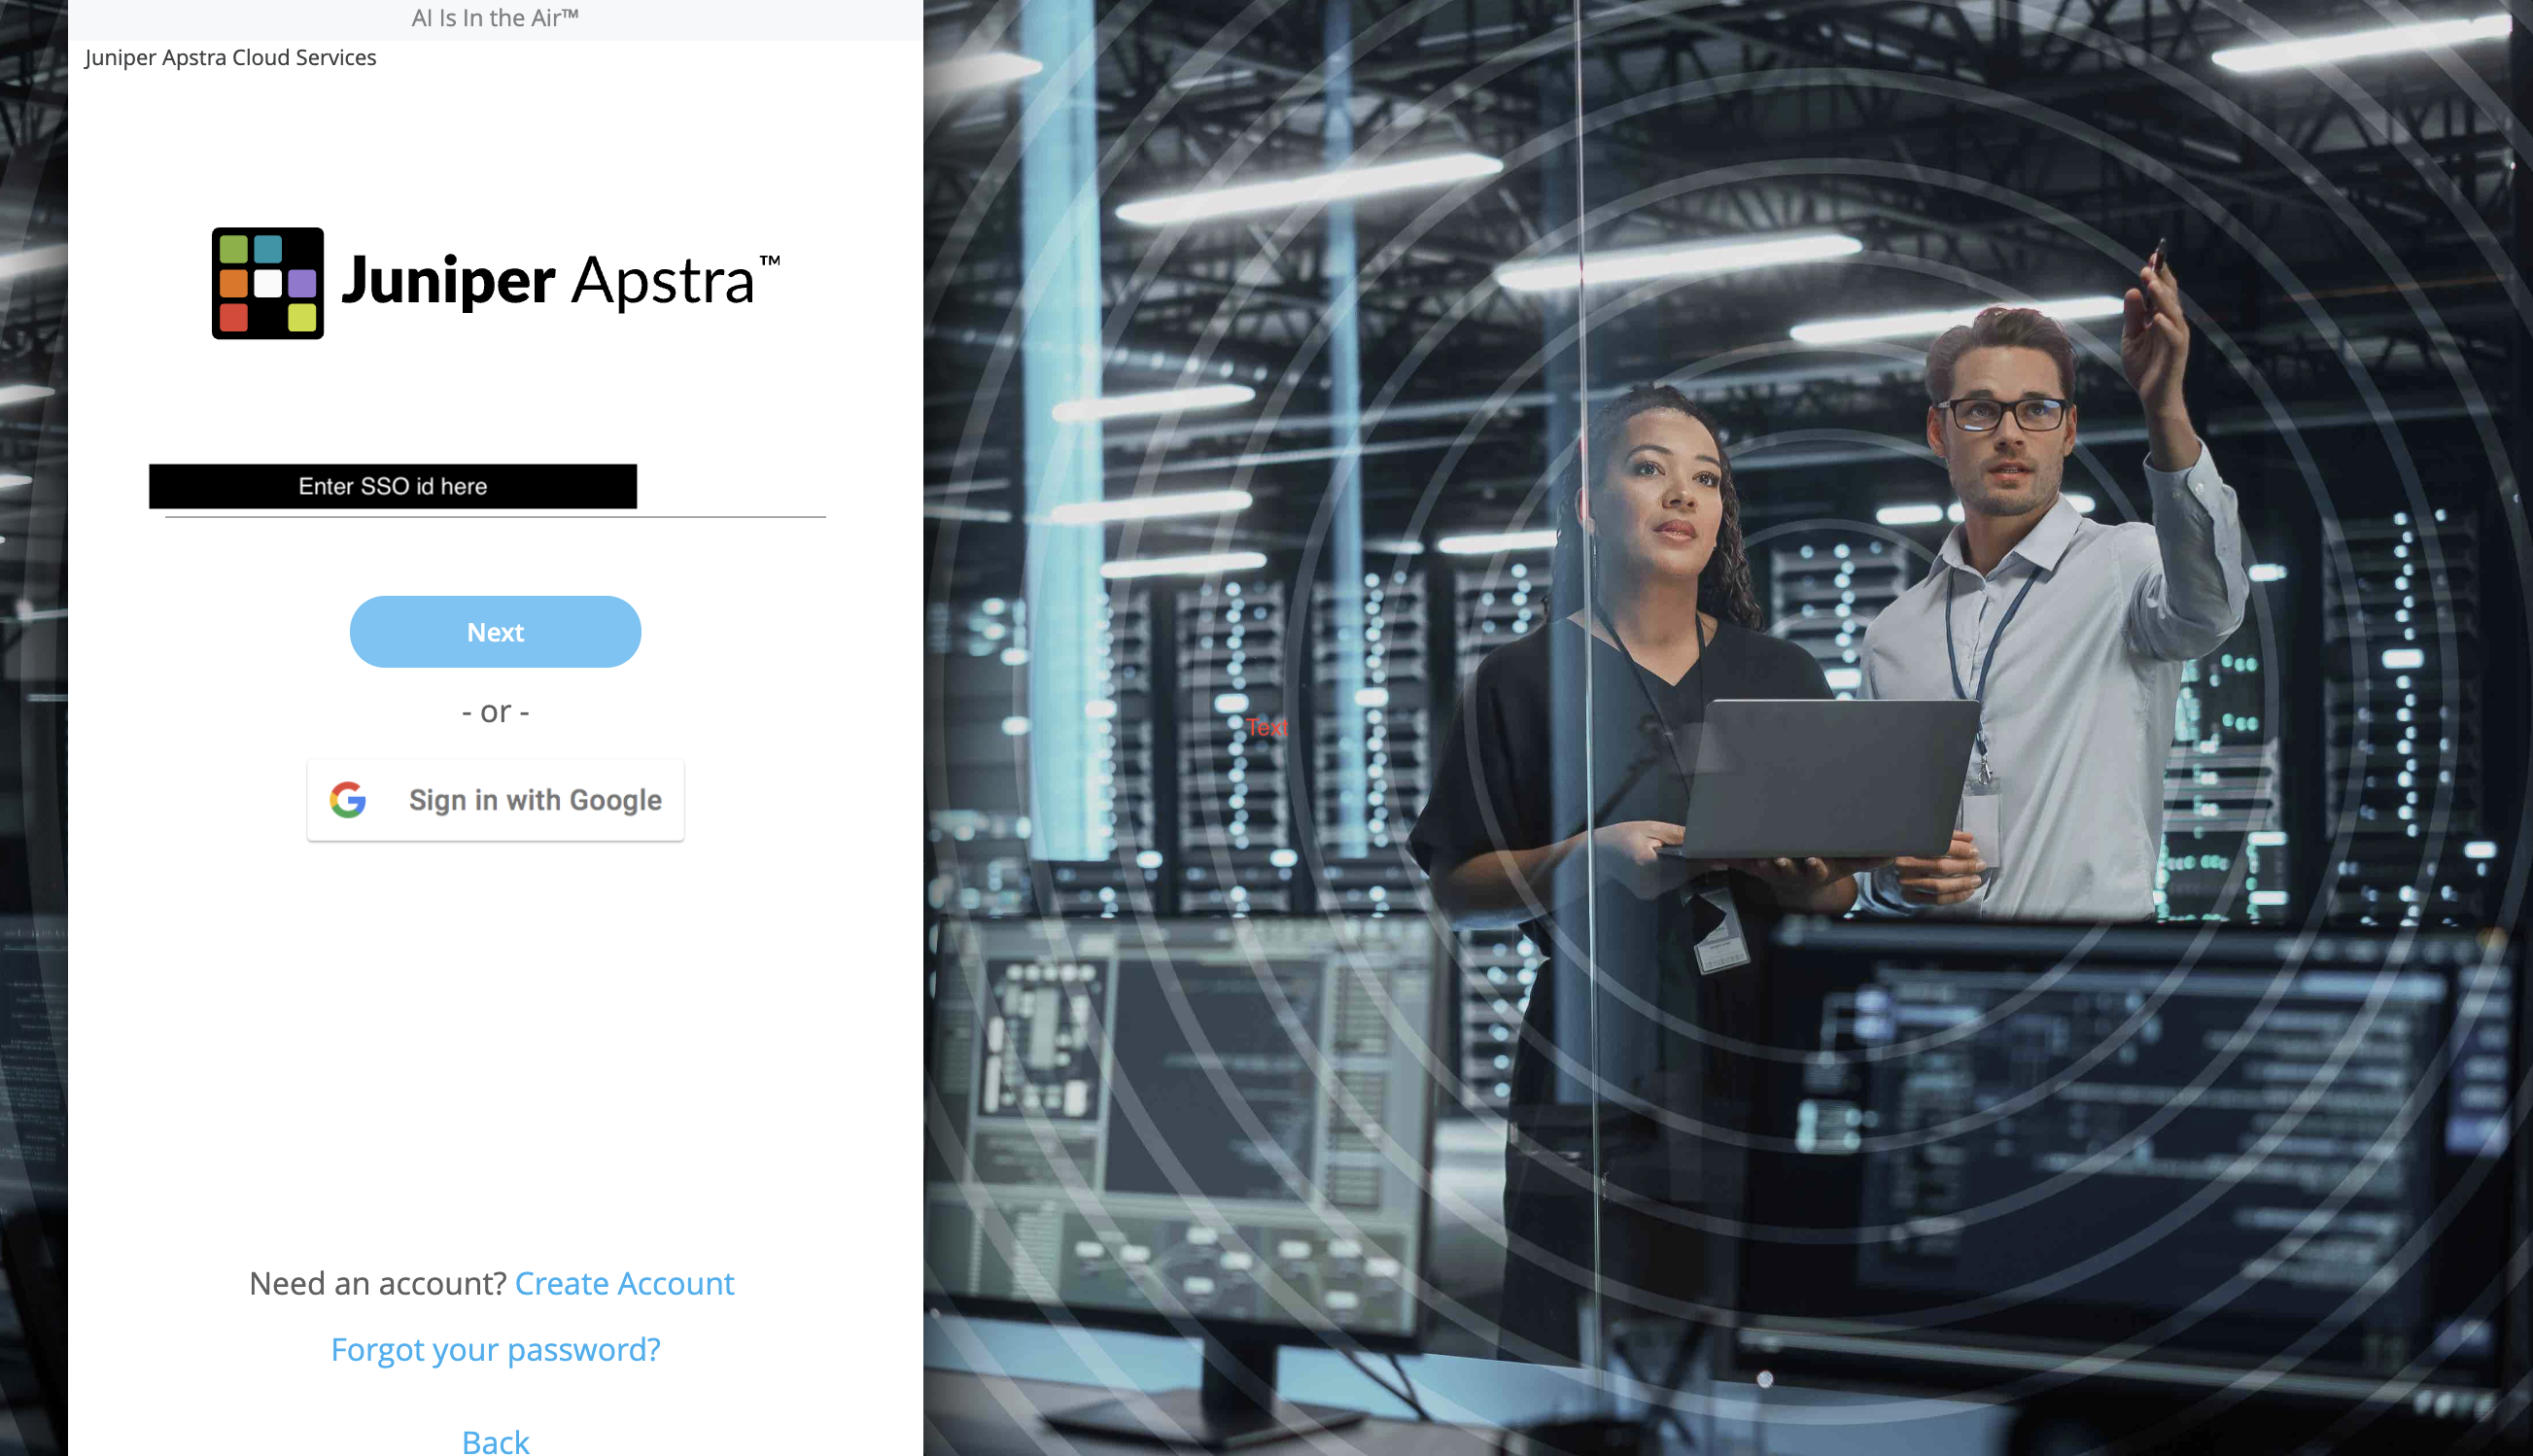
Navigate to https://dc.ai.juniper.net/signin.html#!signin
This will open up Apstra Cloud services JCloud instance. We need to login with our SSO or create account.
Create an organization called JCL.
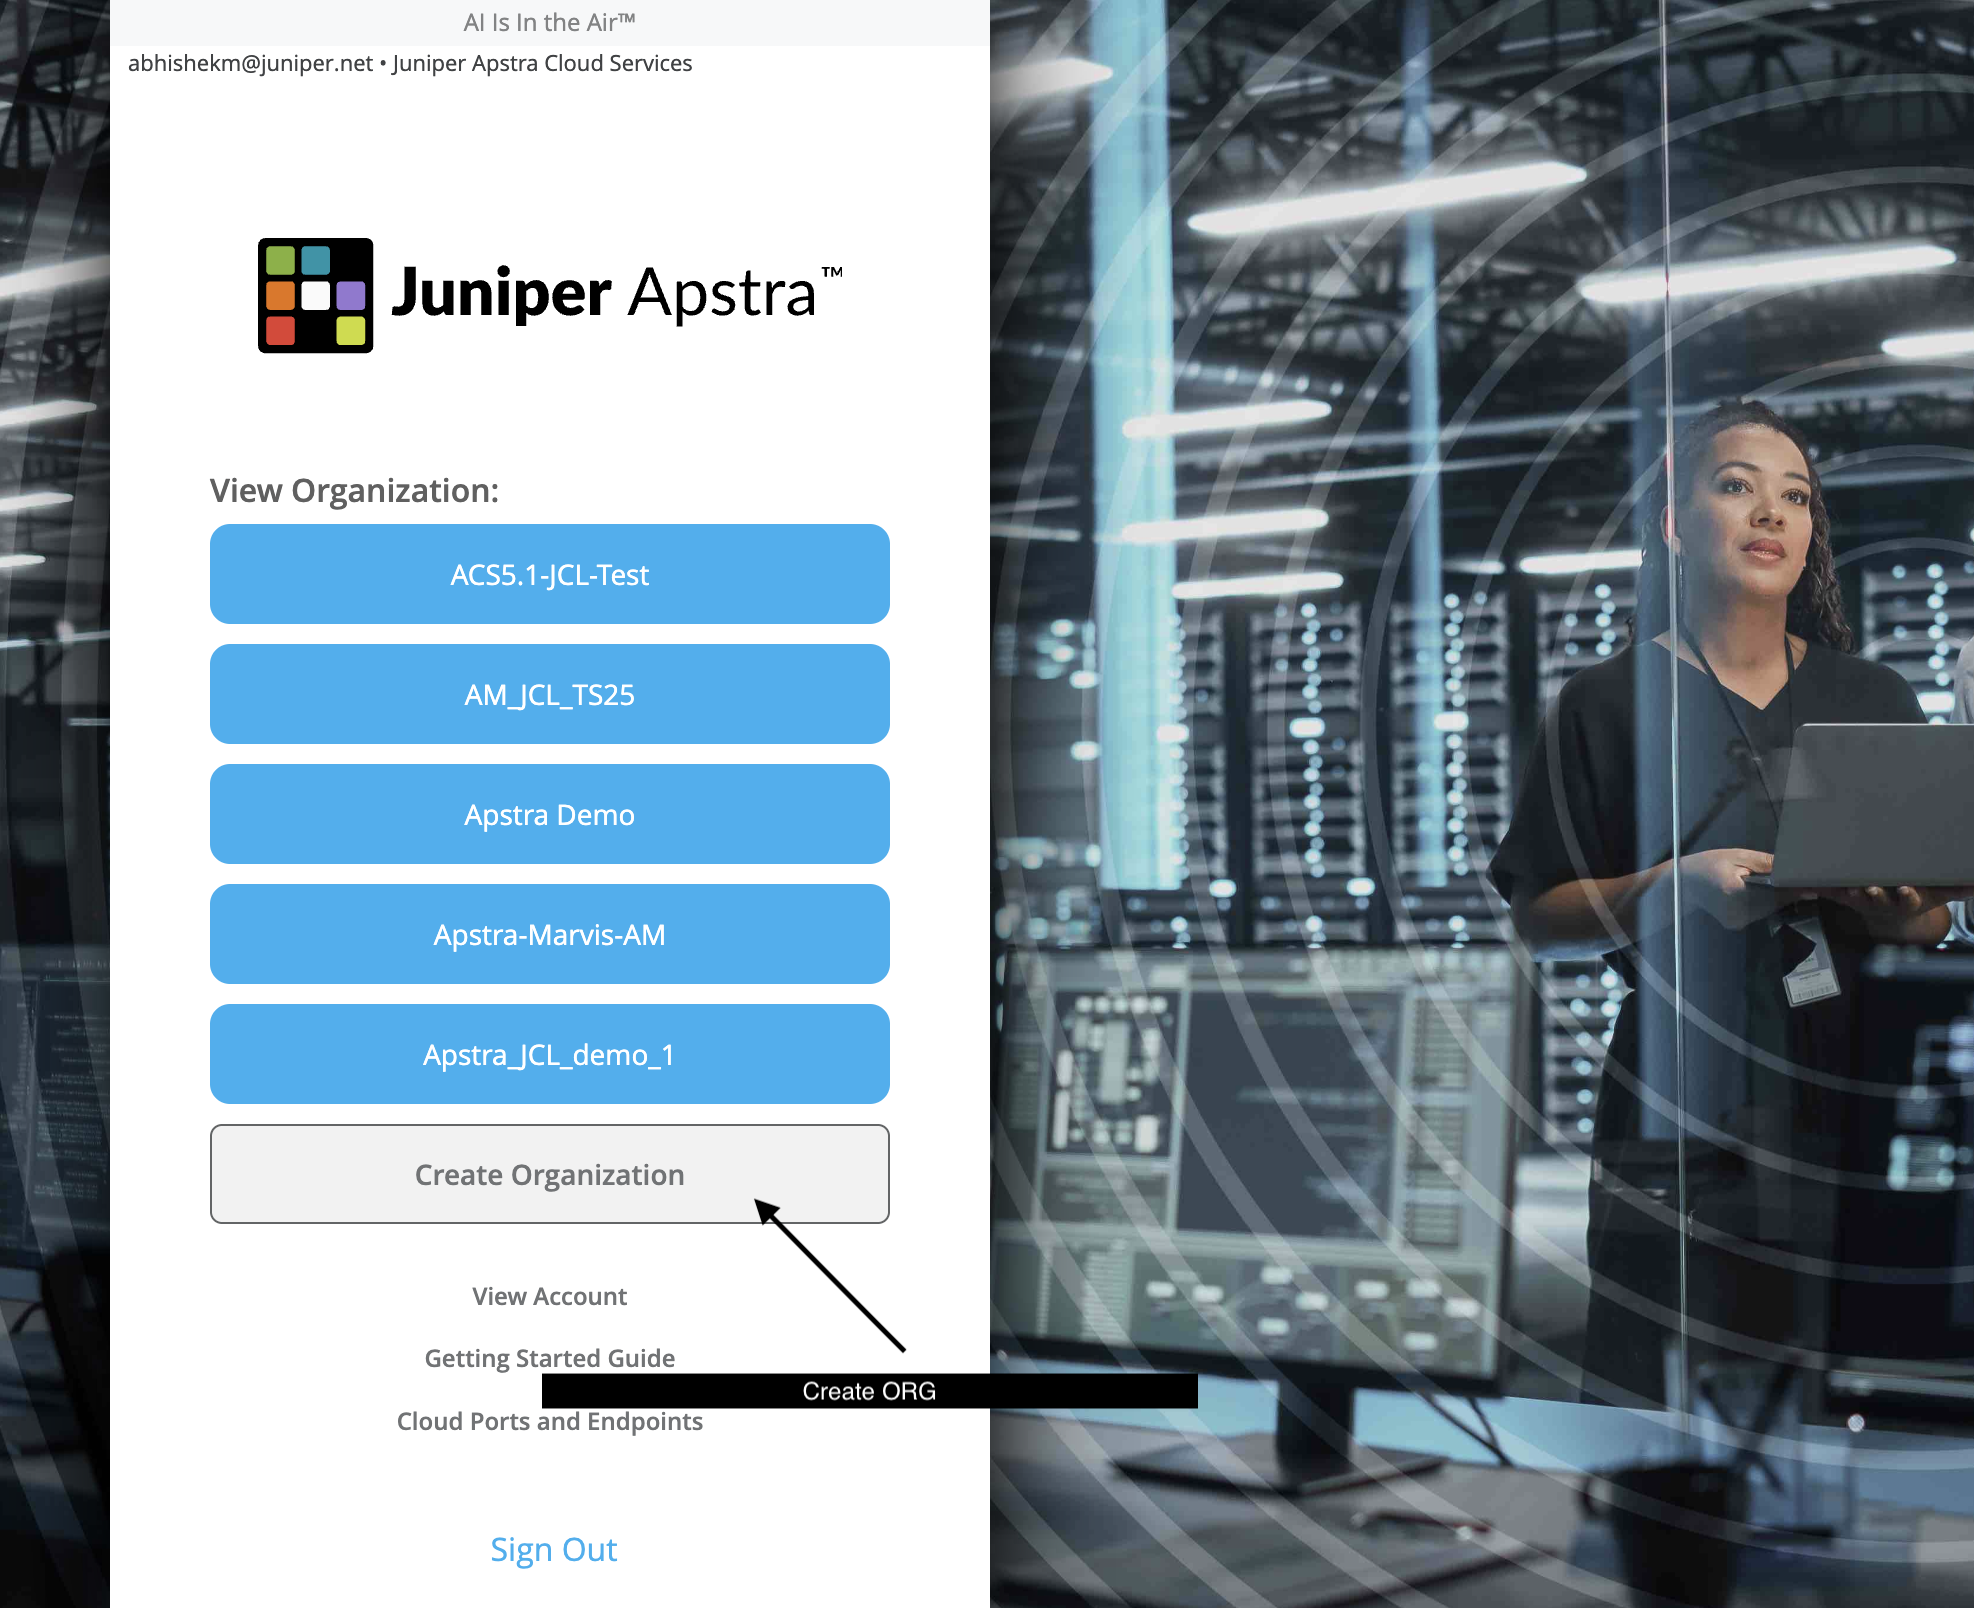
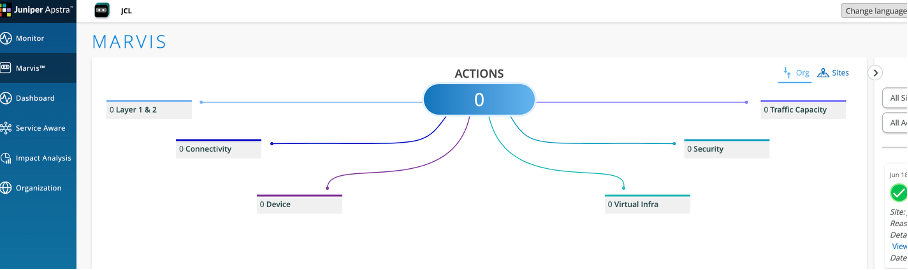
It will open up the Marvis Dashboard.
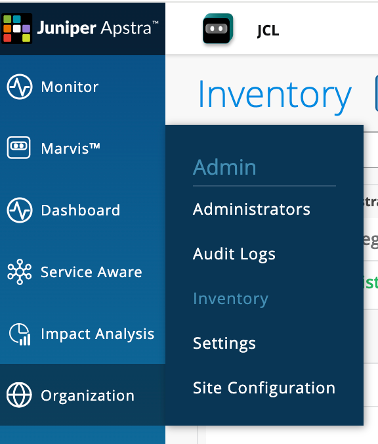
Navigate to Organization – Inventory on JCloud.
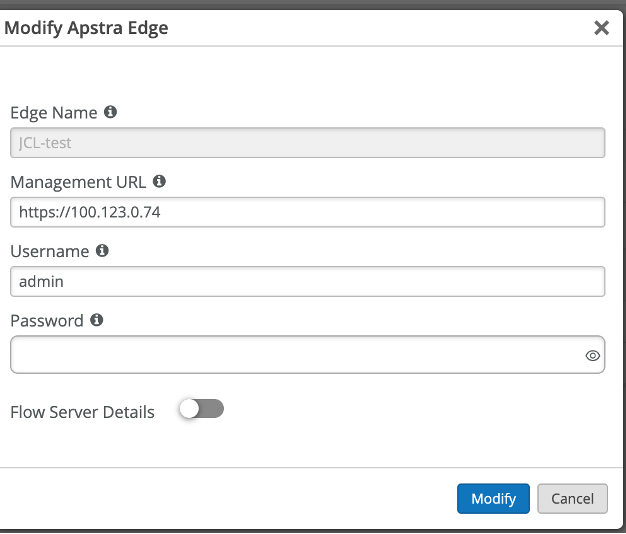
Click on Adopt Apstra Edge to the top right of the screen as shown

Use below values to create the edge
Name - JCL-apstra-edge
Management URL - https://100.123.0.74
Username - admin
Password - Juniper!1
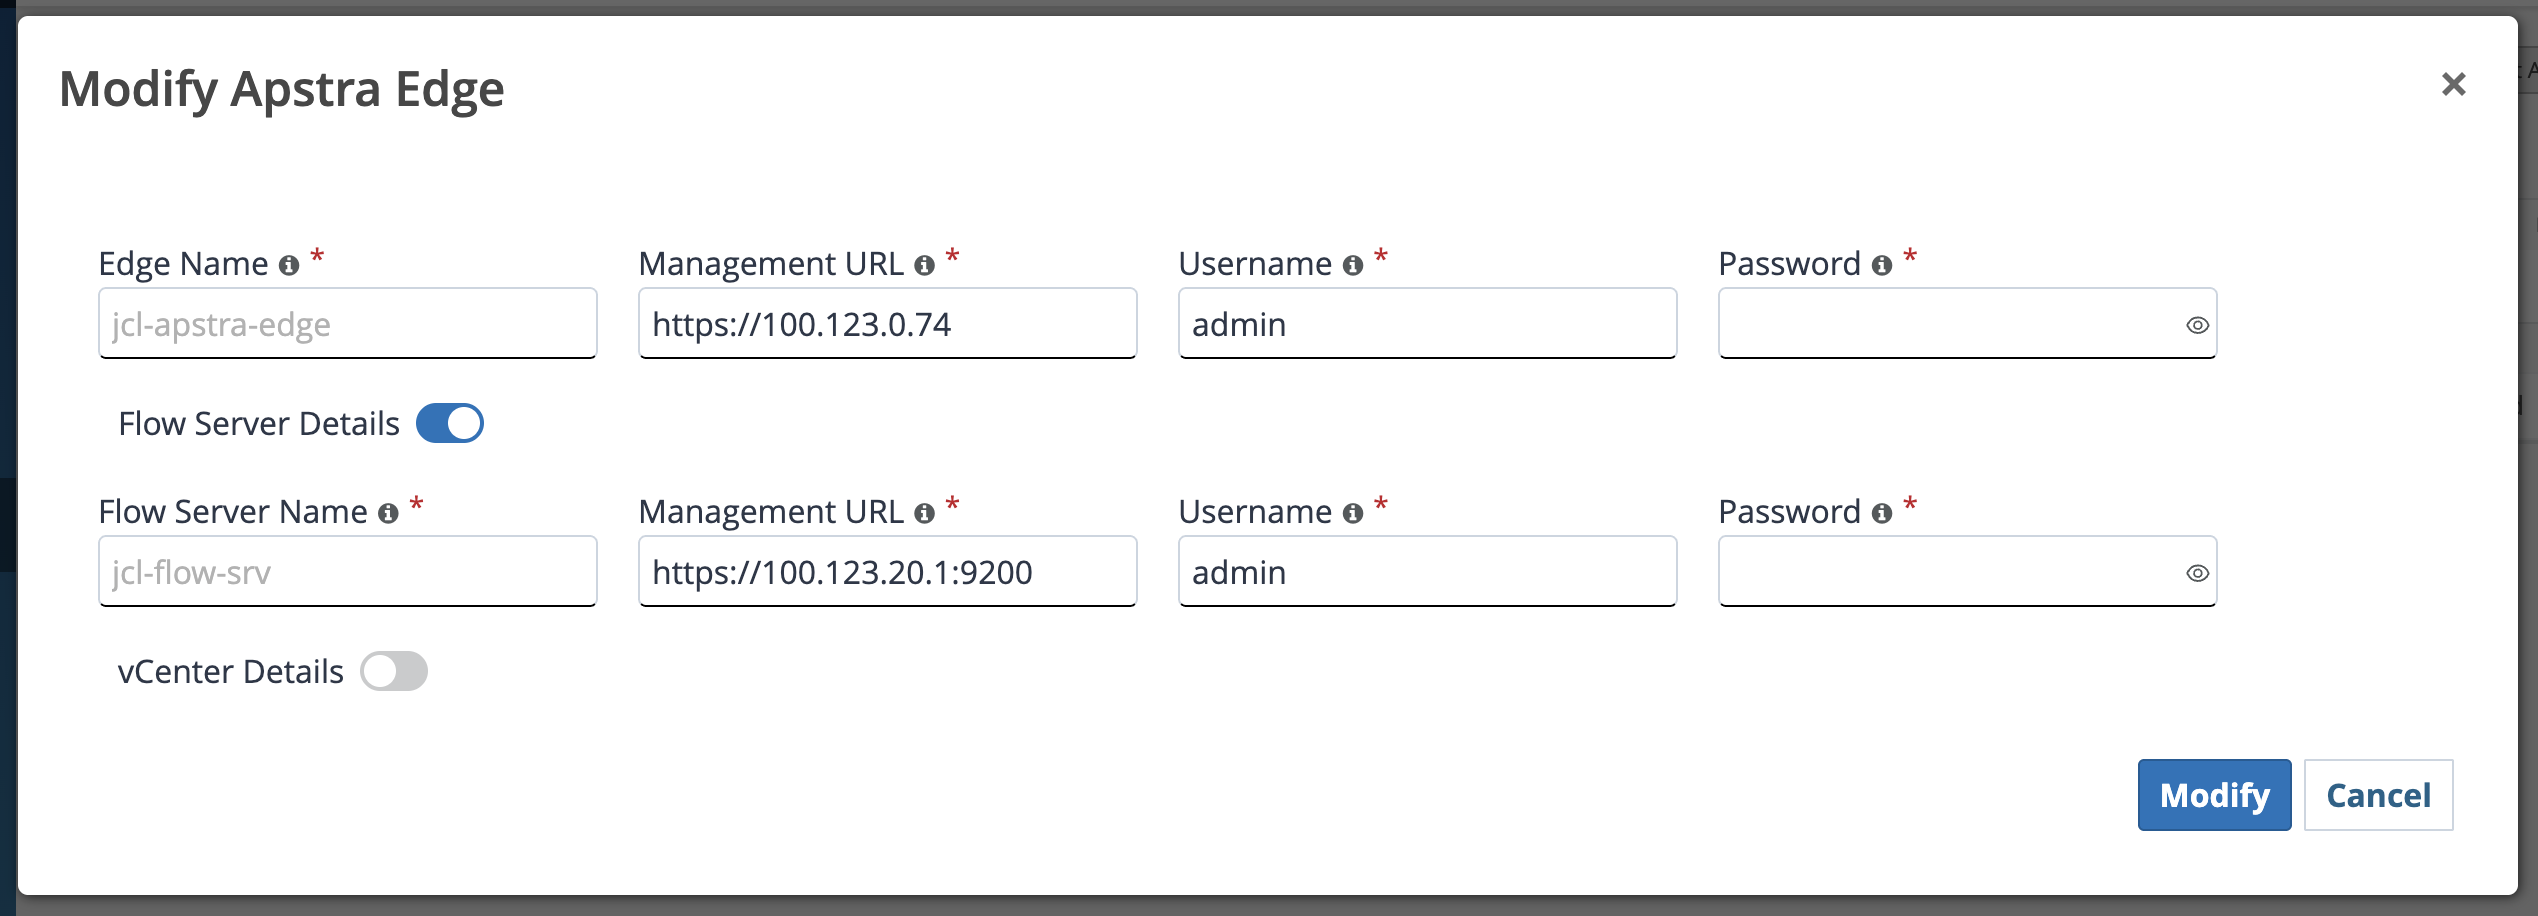
Note: Also enter the flow server details as below
Name - JCL-Flow-SRV
Management URL - https://100.123.20.1:9200
Username - admin
Password - Apstra-Flow5
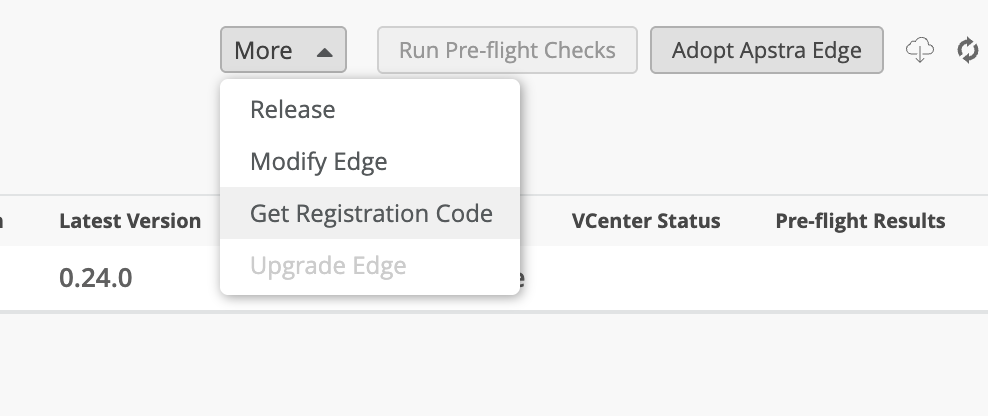
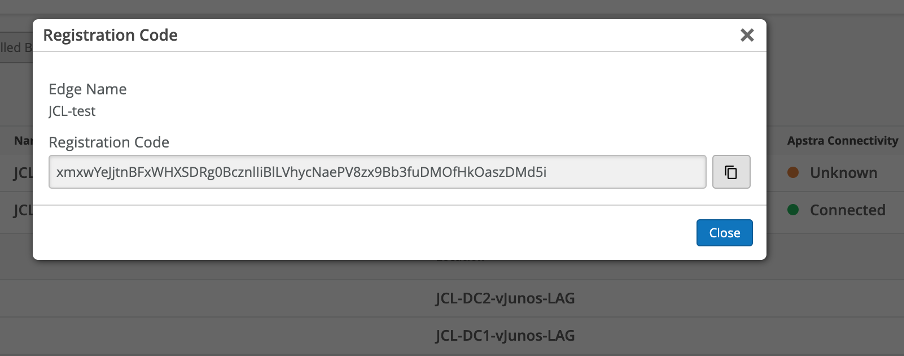
Once created, It will generate a registration code under the More options. Copy the registration code. Registration code –
ON Apstra CLI
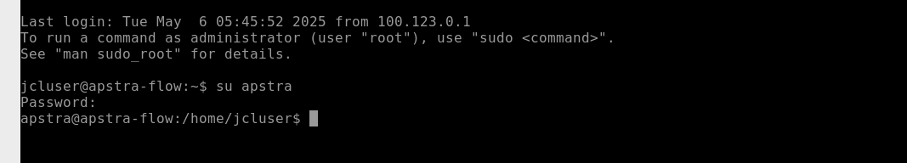
SSH into Apstra VM from within the Jumpstation, using Terminal:
Use below command from the terminal:
ssh admin@100.123.0.74
Credentials: admin/JuniperJuniper!1
Untar the image file tar -xvzf apstra-cloud-services-edge_0.16.5.tar.gz
Then change into the directory containing the docker image file. At this point, you can perform the docker load < apstra-edge-0.13.2.tgz(substitute the proper value, based-on the version you have downloaded).
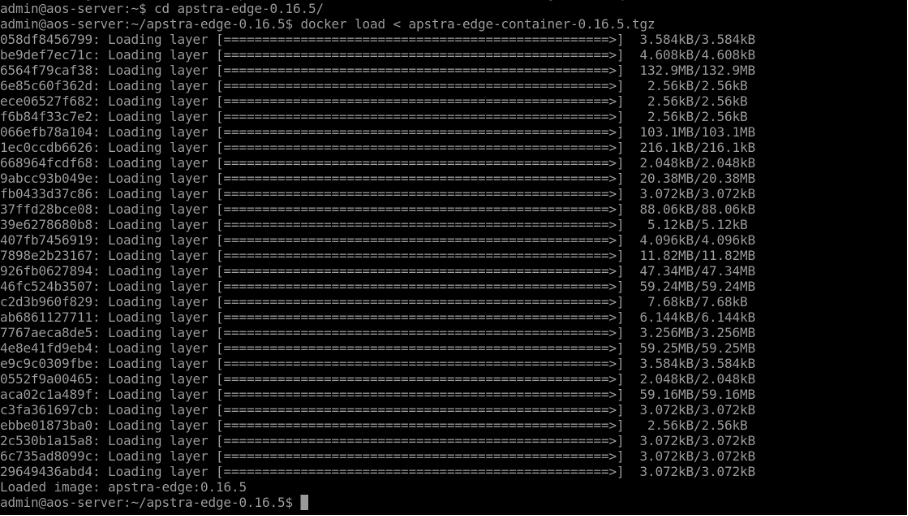
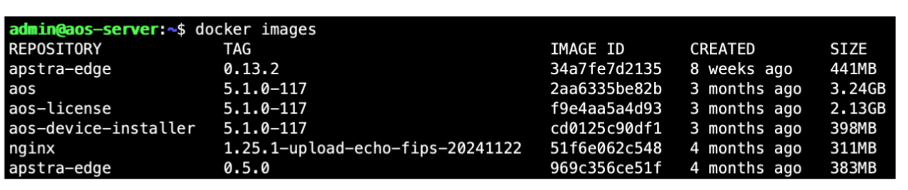
Run the docker images command to verify that the new version has been loaded
Apstra Edge is a hardware-agnostic virtual device that runs within a container in the data center. Apstra Edge functions like a proxy device in an Apstra-managed data center and maintains connectivity with Juniper Apstra Cloud Services. The edge does not process the events that it receives from Apstra, it just forwards all the event information it receives from Apstra to Juniper Apstra Cloud Services.
Now, we need to launch this container, provide the registration ID from Apstra Cloud services and adopt this Apstra Edge in the Apstra Cloud services platform. The step-by -step process for the same is described below -
ON Apstra GUI
Navigate to Platform –> Apstra Edge
Click on Create on the top right
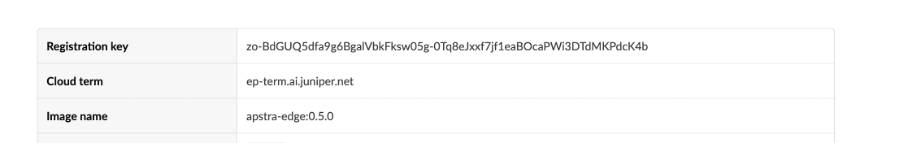
Paste the Registration key and enter the cloud term as shown below
Cloud term: ep-term.ai.junipe.net
NOTE: Leave the image name to default (blank)
Click on create to create the edge
If you notice, this creates apstra-edge with version (0.5.0)
Now on the same Apstra UI page, click on Edit Apstra Edge and set the image name to apstra-edge:0.16.5 (the running version used in this demo). Then click on update for the changes to take effect
By creating the Apstra Edge on the Apstra UI it runs the apstra-edge docker container. You can verify by using “docker ps” The container should be in “up” state.

Now, let’s switch back to JCloud.
Refresh the page and you can see that the Apstra Edge is adopted and connected successfully.
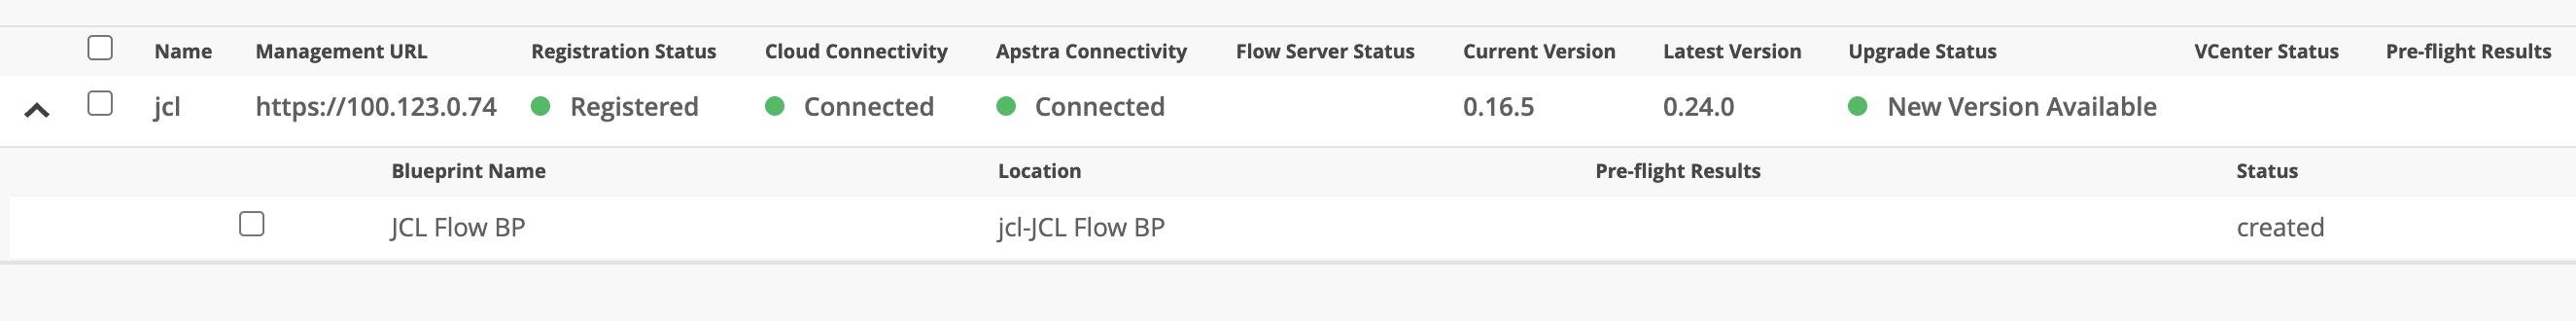
This completes integration of Apstra Edge with Marvis on Apstra cloud services.
Usecases
Usecase 1: Incorrect Cabling
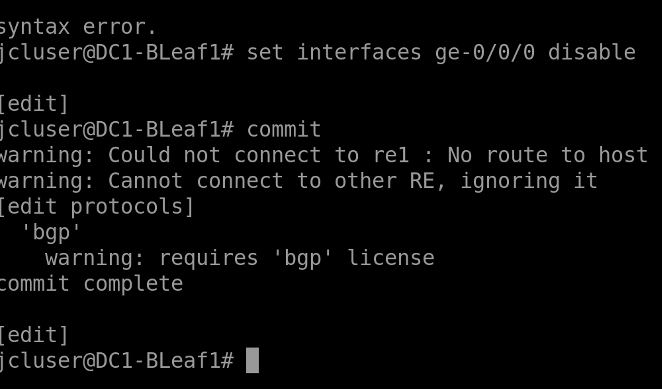
SSH into Leaf 1 by clicking on the leaf1 connection–
Bring down ge-0/0/0 connecting to Spine-1 as follow
set interfaces ge-0/0/0 disable
commit
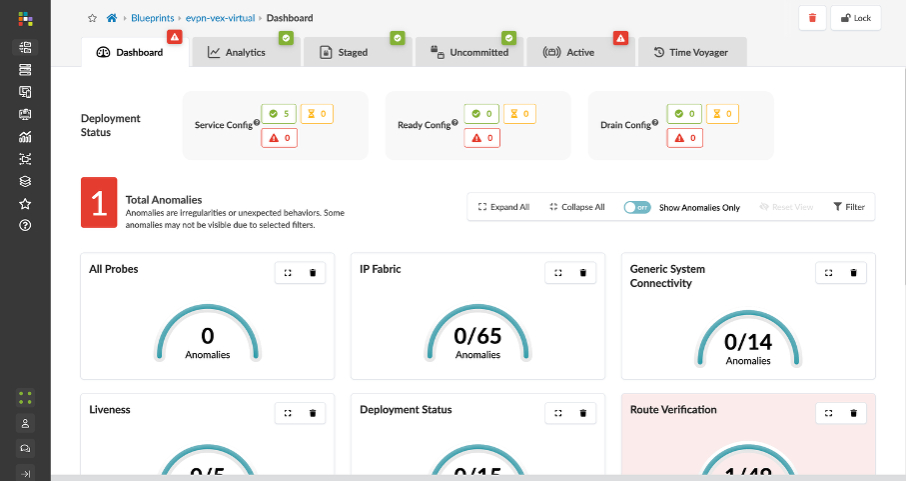
HTTPS into Apstra GUI. Look at the dashboard, as you can see there are anomalies seen in the dashboard.
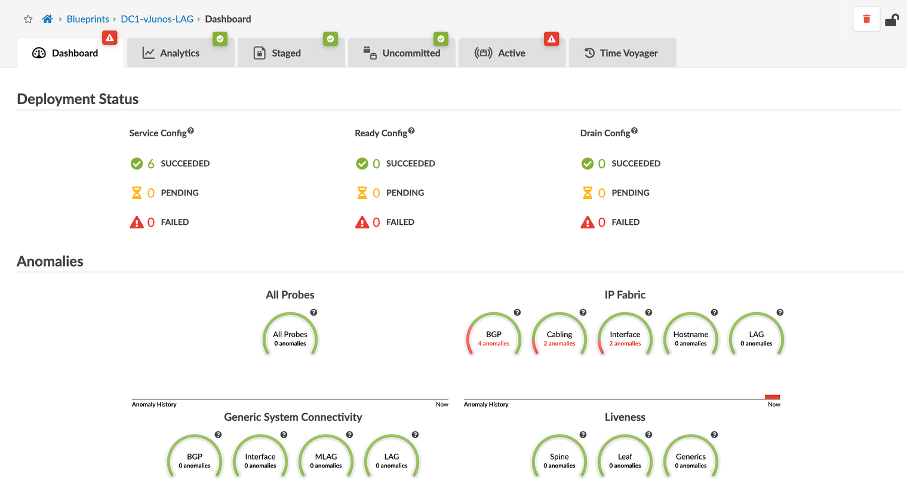
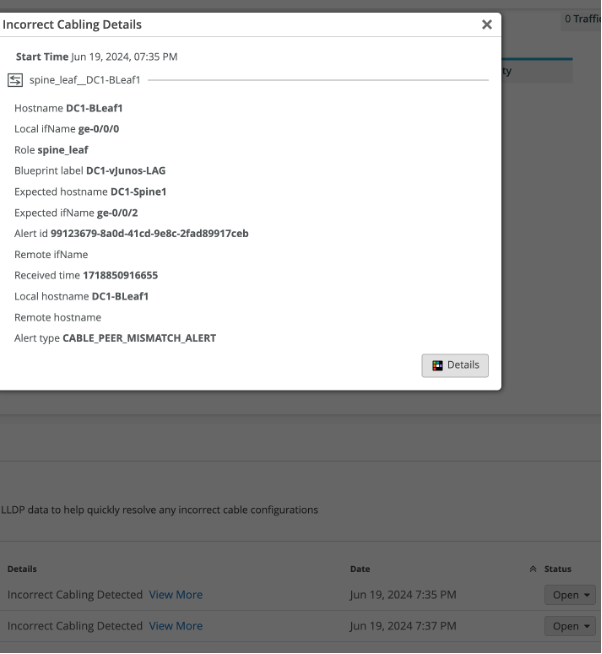
You can see the interface, Cabling and BGP errors indicating ge-0/0/0 interface is down towards Spine-1.
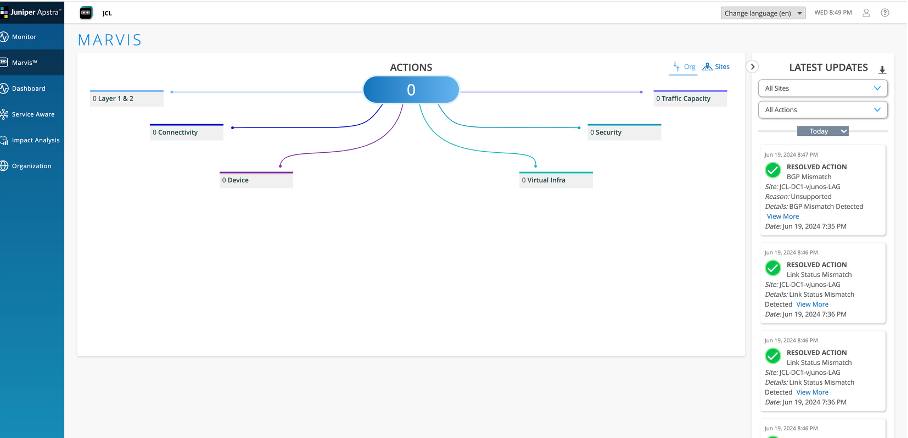
Now, navigate to Marvis Dashboard on JCloud. Check the errors displayed on the dashboard.
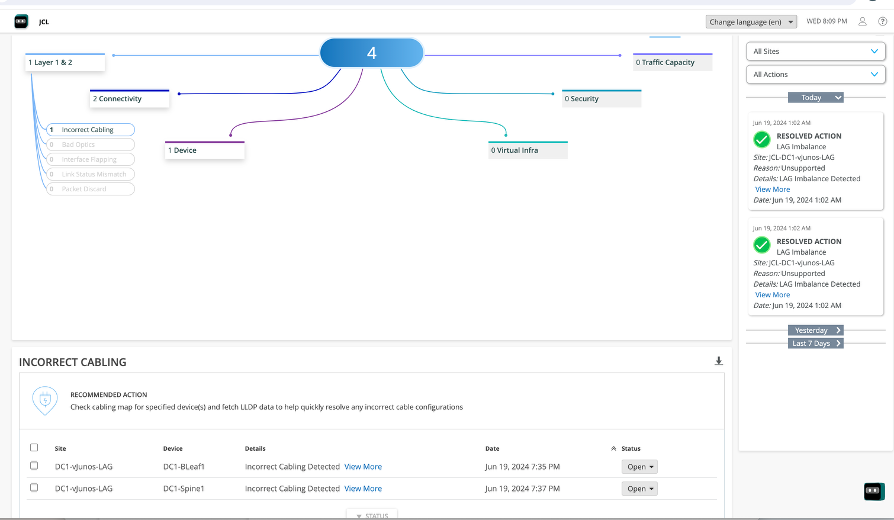
When you click on “View More” under the Incorrect cabling, you will get information regarding which interface is down and what is the reason for the error, blueprint that is affected and alert type.
Usecase 2: Config Dev error
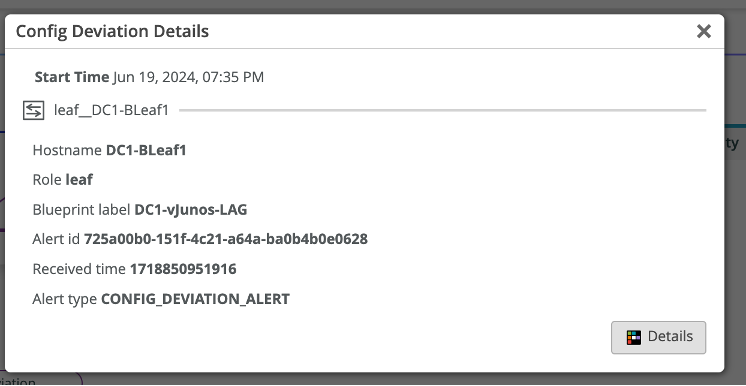
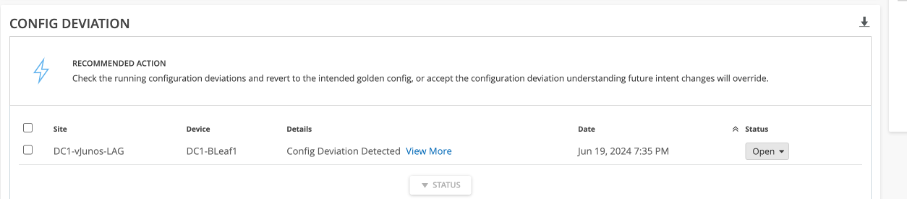
Config Dev Error occurs when there is a manual change in the configuration of the Junos devices. Since we brought the link down manually, it gets reflected as Config dev error. Navigate to Marvis Dashboard and we can check the config dev error.
Under Device, we can see the config dev error along with which device has been affected and what is the recommended action.
Usecase 3: Impact Analysis
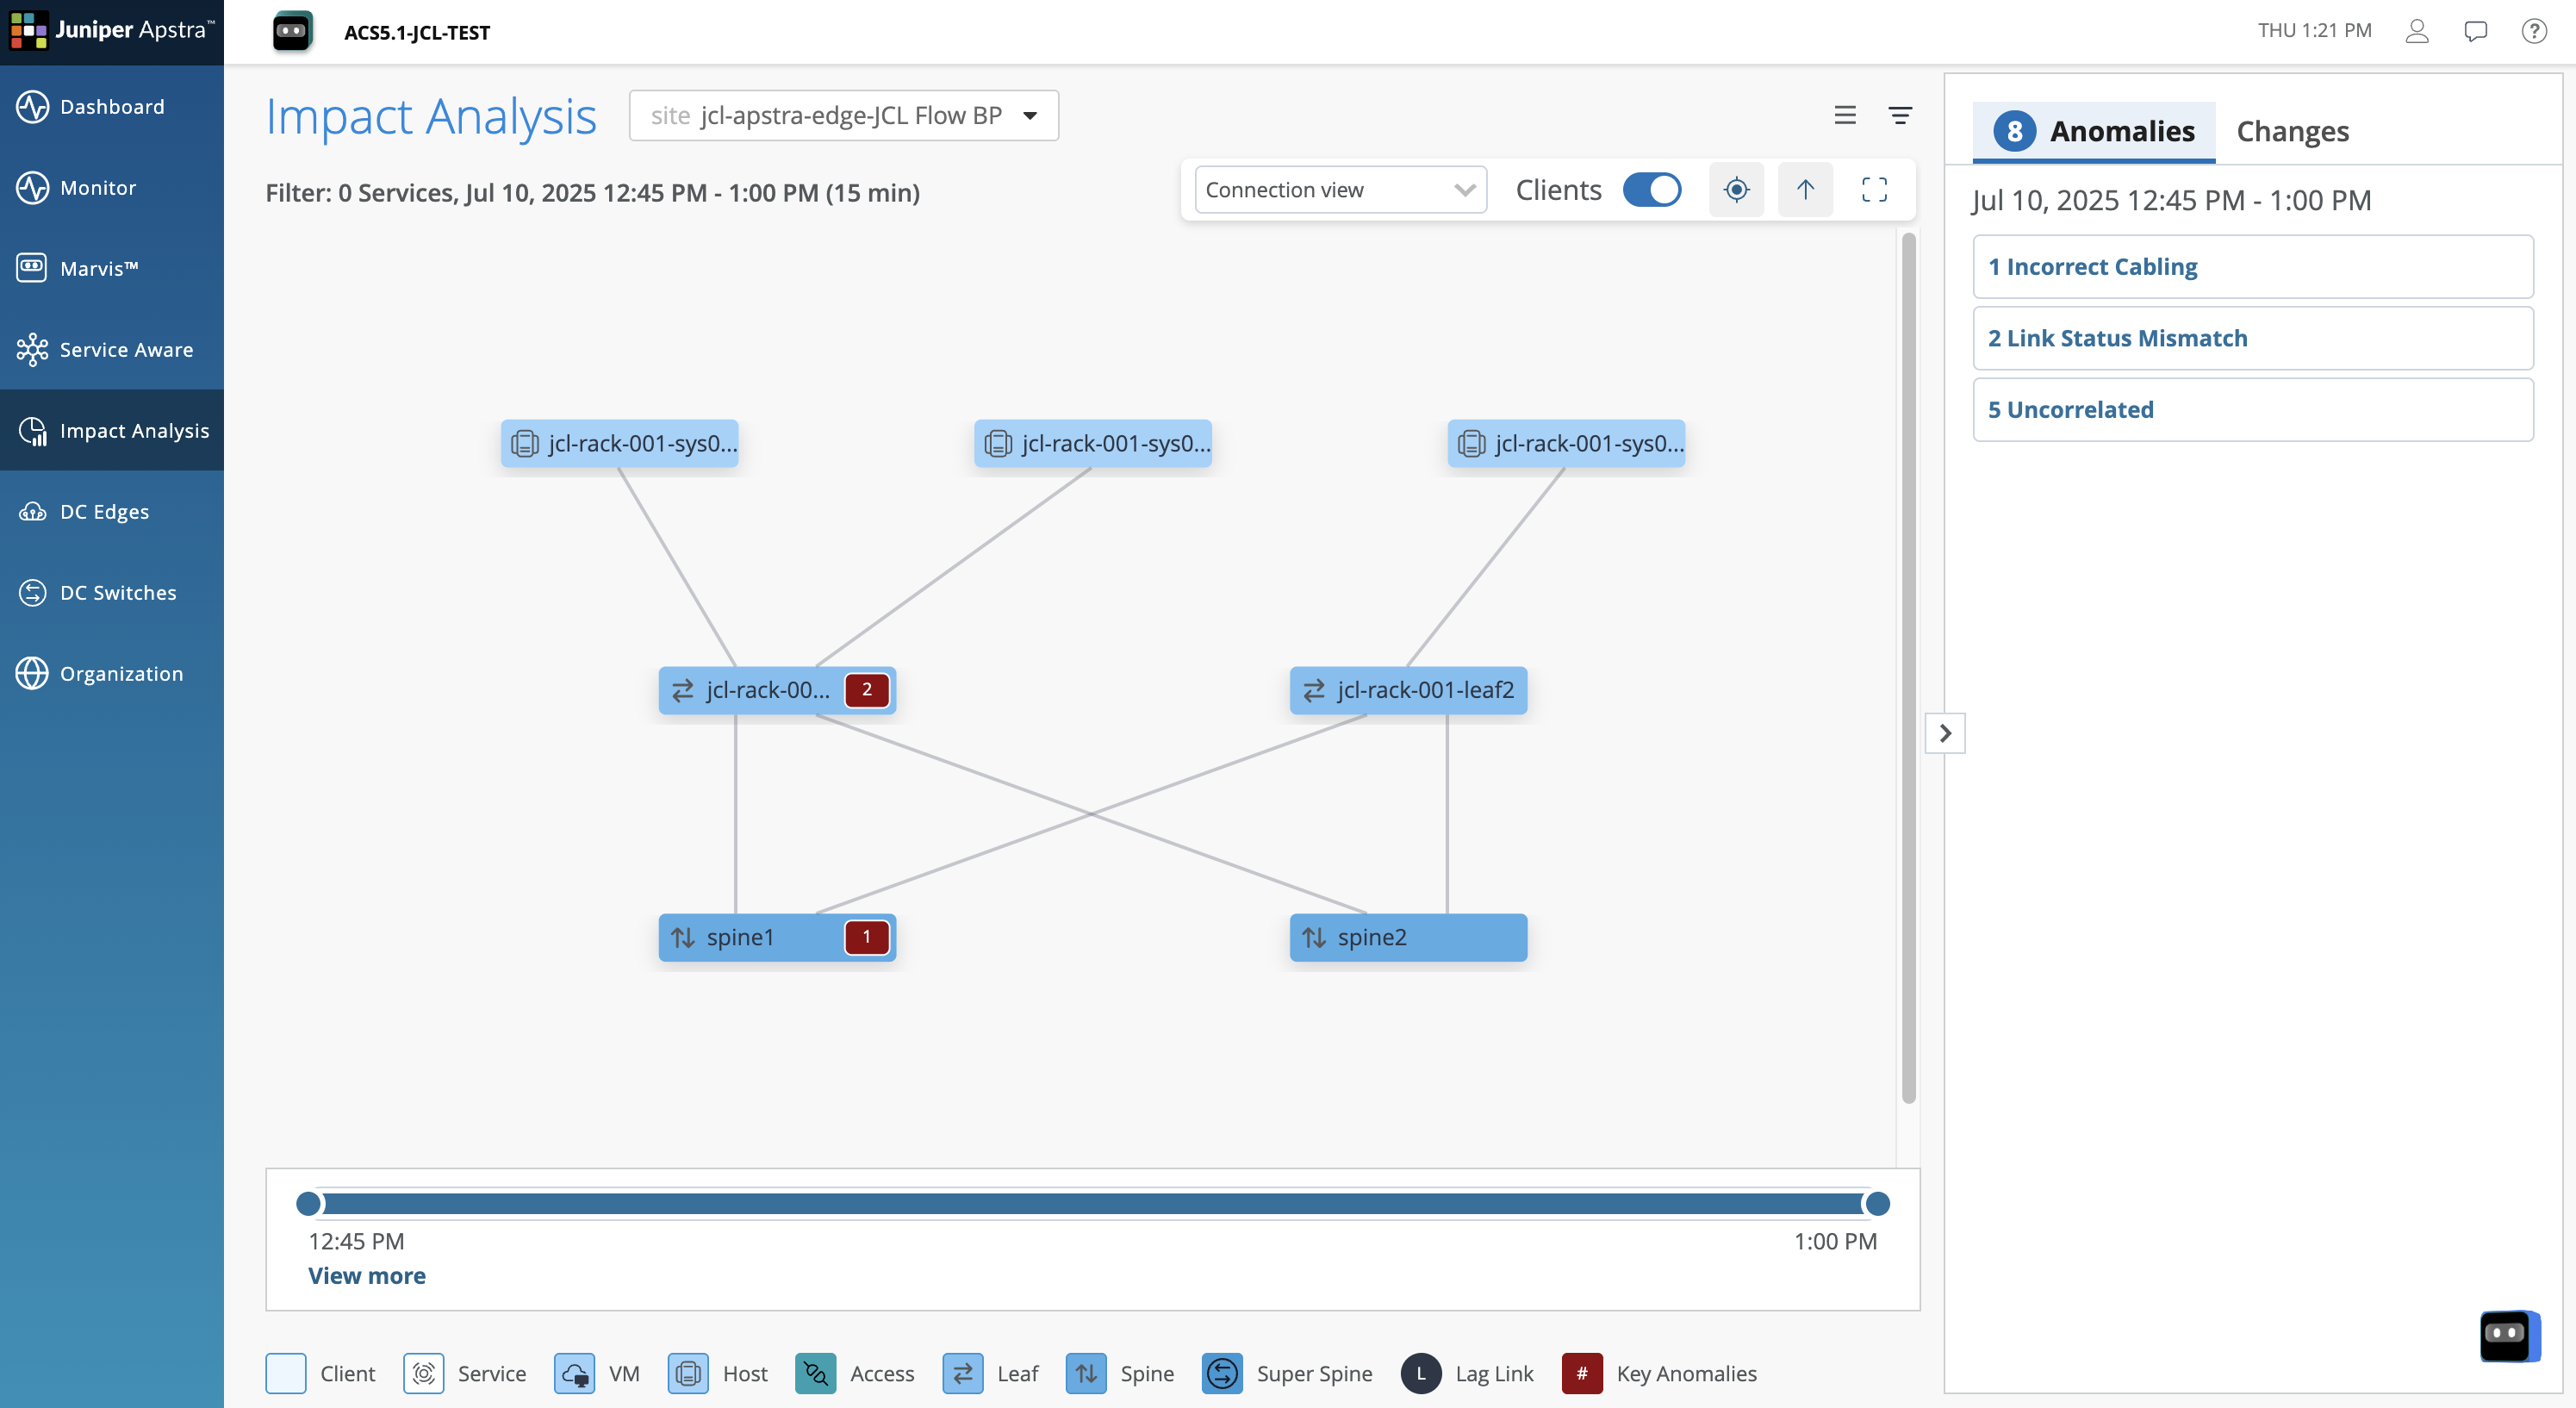
The Impact Analysis feature combines Apstra’s intent-based analytics (IBA) with network service visibility. The Impact Analysis page on Juniper Apstra Cloud Services provides a visual representation of the network infrastructure with the following information
how nodes in the data center are connected to the clients
what path the service traffic takes
how the application traffic is handled
how an anomaly in a node in the data center can impact application traffic
The Impact Analysis feature uses knowledge graphs to correlate events to issues in the data center network and then maps those issues to the potential impact on the applications that are utilizing the network. Instead of displaying several anomalies and causing alert fatigue, the Impact Analysis feature lets you view the key anomaly and the impacted devices in the topology diagram
The Anomalies tab in the right pane of ACS displays the current anomalies that occurred in the network along with their start time. Expand a key anomaly to view the detailed list of associated anomalies, symptoms, affected devices, interfaces, services, Virtual Networks, and VRFs. The tab also displays a list of uncorrelated anomalies. Select an anomaly to highlight the affected node in the topology diagram.
The Changes tab displays the changes in the network topology, such as addition or removal of a device. You can also use the filter on the page to examine how a specific service performed during the selected time period.
The Impact Analysis feature thus enables the administrators to quickly identify the root cause of an issue and resolve it so that the related anomalies also might get resolved. This helps network administrators reduce the mean time to resolution (MTTR), which in turn helps improve application user experience
To read more on Impact analysis use this [link] (https://www.juniper.net/documentation/us/en/software/juniper-apstra-cloud-services/user-guide/topics/topic-map/impact-analysis-overview.html)
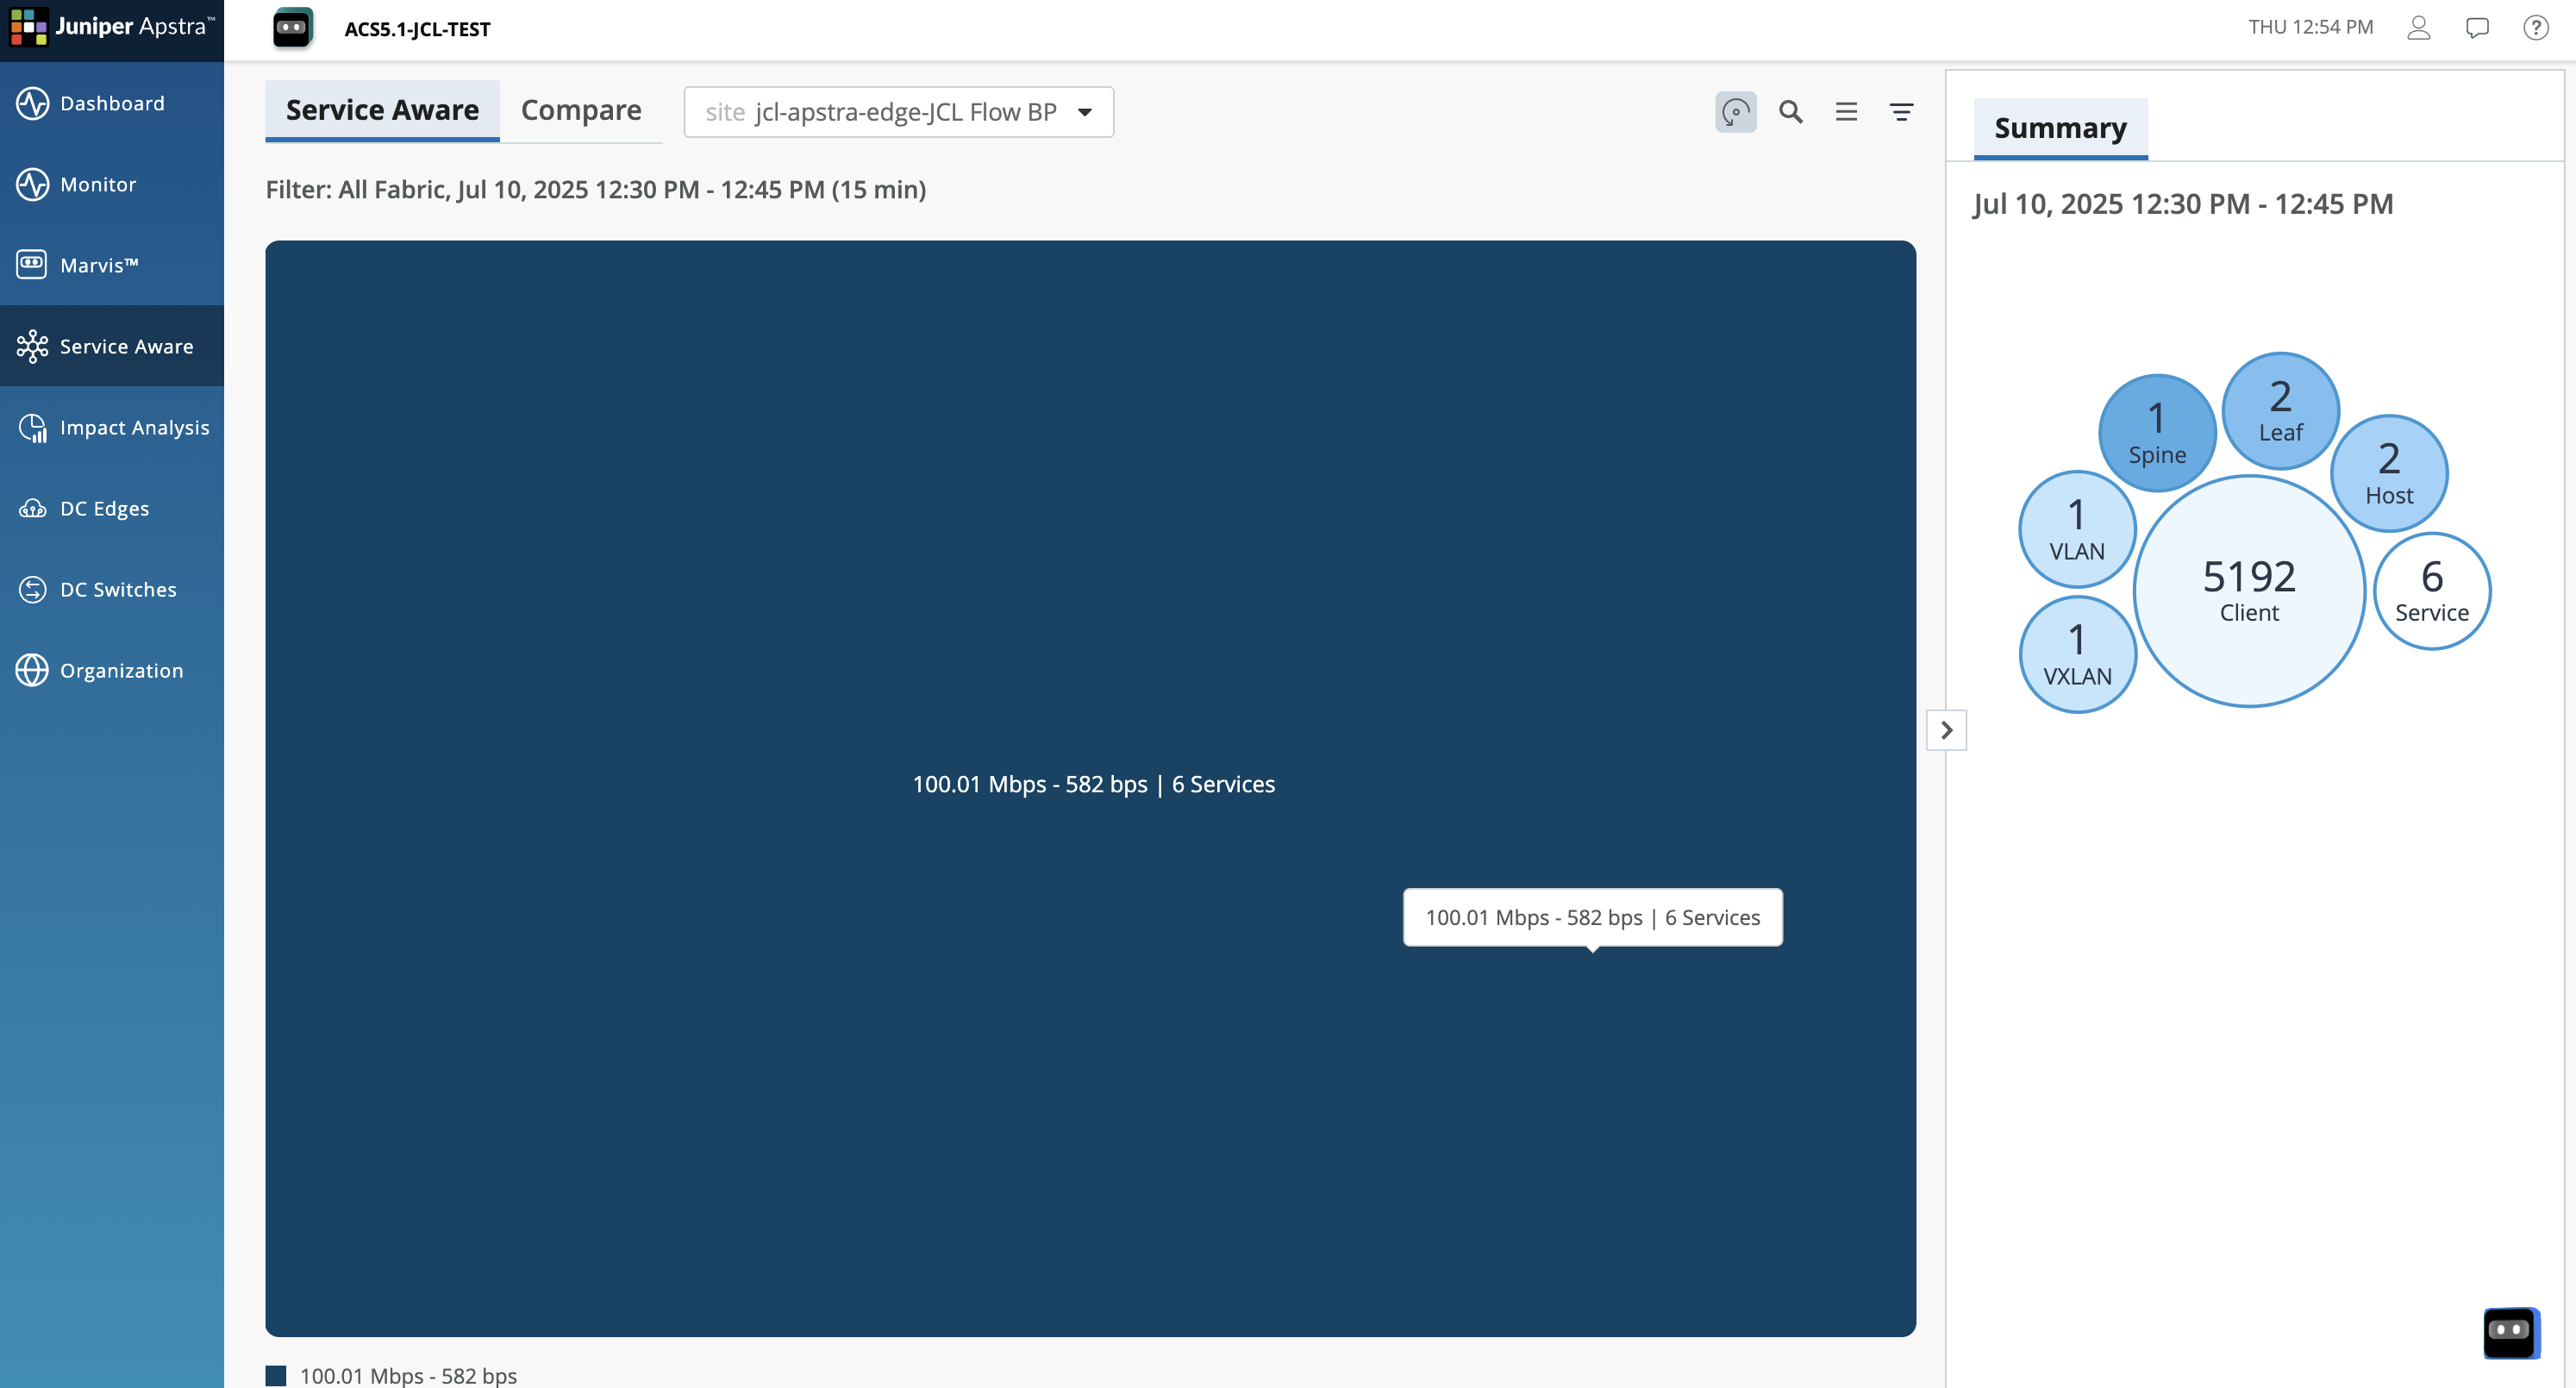
Usecase 4: Service Aware
The Service Aware feature in Juniper Apstra Cloud Services provides a visual representation of the services that are active during a given time period. The visualization also shows how the data center fabric is being utilized by these services. You can select a service and drill down to get detailed information about the traffic flow.
You can drill down and view details of specific services, view the network topology, identify any node that has an anomaly, and the hosts connected to the device, which are impacted by the anomaly.
You can select a set of services and examine how nodes are connected to hosts and how those services traverse through the data center fabric. The total count of events and anomalies affecting the nodes is displayed in the topology diagram.
To read more on Impact analysis use this [link] (https://www.juniper.net/documentation/us/en/software/juniper-apstra-cloud-services/user-guide/topics/concept/service-aware-overview.html)
Remediate the anomalies
Let us now remediate the error. SSH into Leaf 1 and delete the command “set interfaces ge-0/0/0 disable” using “delete interfaces ge-0/0/0 disable” and “commit”.
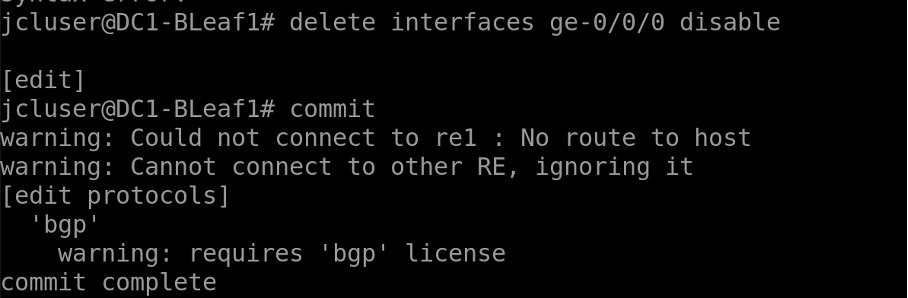
Refresh the Marvis Dashboard. The errors should go away on both Apstra as well as Marvis dashboard on JCloud
And you can see the status of the action – Resolved action
You have successfully completed this Hands-On Lab!
Try it later ?
You can find this lab and try it out on-demand in JCL at the below link, the below on-demand lab contains more use-cases:
Apstra Marvis Integration this lab is available in Demonstration-US1 domain
Lab Survey
Please take 2 minutes and complet the Apstra 6.0 Hands-On Lab Survey
