Juniper Routing Assurance
Welcome to Juniper Routing Assurance Lab
This lab is designed to provide hands-on experience with Juniper’s AI-driven Routing Assurance platform. You’ll begin with a brief overview of the solution, followed by a guided walkthrough of the user interface. Through practical exercises, you’ll explore key features and learn how to monitor, troubleshoot, and optimize network routing with real-time insights and automation.
Whether you’re looking to enhance routing reliability, reduce operational overhead, or improve end-user experience, this lab will equip you with the foundational skills to get started.
Overview
Juniper Routing Assurance (JRA) is an AI-driven, cloud-based observability platform that seamlessly integrates Mist AI with Juniper’s routing infrastructure. Purpose-built to enhance network visibility, automate operations, and proactively manage the WAN edge, JRA leverages powerful AIOps capabilities to deliver real-time, actionable insights.
By simplifying troubleshooting, accelerating root cause analysis, and minimizing manual intervention, JRA helps reduce operational overhead and downtime. The result is improved network performance, enhanced reliability, and a better user experience—all from a single intuitive interface.
Lab Objectives:
In this hands-on lab, participants will:
Router Onboarding and Built-In Tools
As the Administrator of your enterprise network infrastructure, you’ll learn how to effortlessly onboard routers into the Juniper Routing Assurance (JRA) platform, enabling AI-driven observability from day one.
As part of the onboarding process, you’ll configure routers using the intuitive Remote Shell and leverage built-in tools like Ping and Traceroute to swiftly diagnose and resolve connectivity issues.
Set up real-time router alerts to stay informed about outages or anomalies as they occur.
Dive into the Router Insights dashboard for deep visibility into device health and performance, and utilize Service Level Expectation (SLE) metrics to proactively manage and optimize your network before problems impact end users.
Network Failure Root Cause Analysis (RCA)
In this scenario, you’ll explore how to leverage Juniper Mist Routing Assurance (JRA) and its Router Insights to efficiently investigate and resolve network faults.
The goal is to quickly identify root causes, assess impacted services, and reduce Mean Time to Resolution (MTTR) through AI-driven analytics and an intuitive user interface.
As the Administrator of an enterprise network, you’ve received reports of intermittent WAN connectivity issues. The instability is observed on the WAN interface that serves as the primary link between your router and the Provider Edge (PE) router.
Symptoms include:
Periodic link flaps
BGP neighbor session resets
Application performance degradation
These disruptions may stem from various causes, such as:
Faulty physical cabling or optics
Interface configuration mismatches
CRC/input errors or excessive retransmissions
Using JRA, you can visualize real-time and historical performance data, correlate events across timelines, and isolate the root cause—all without manually parsing CLI outputs. This empowers faster troubleshooting, effective collaboration with the service provider, and ultimately, a more resilient and high-performing network.
Compliance Assessment and Audit Readiness
As the Administrator of an enterprise network, you are responsible for ensuring both compliance and operational stability across your infrastructure.
The Juniper Mist Routing Assurance (JRA) platform empowers you to achieve this through its AI-driven insights and intuitive user interface.
Using JRA, you can seamlessly perform compliance assessments by auditing router configurations, OS versions, software advisories, and lifecycle states (EOL/EOS). The platform flags non-compliant devices, enabling proactive remediation well before audits occur. This ensures your network remains secure, standards-compliant, and audit-ready at all times.
This data can be compiled into a detailed report and shared with the Service Provider, expediting resolution and reducing downtime.
Starting Lab
This lab allows 1 person per Sandbox. If you would like to do this lab raise your hand to get Lab User information.
Lab Blueprint Topology
Let us have a look at the physical topology with devices and links.
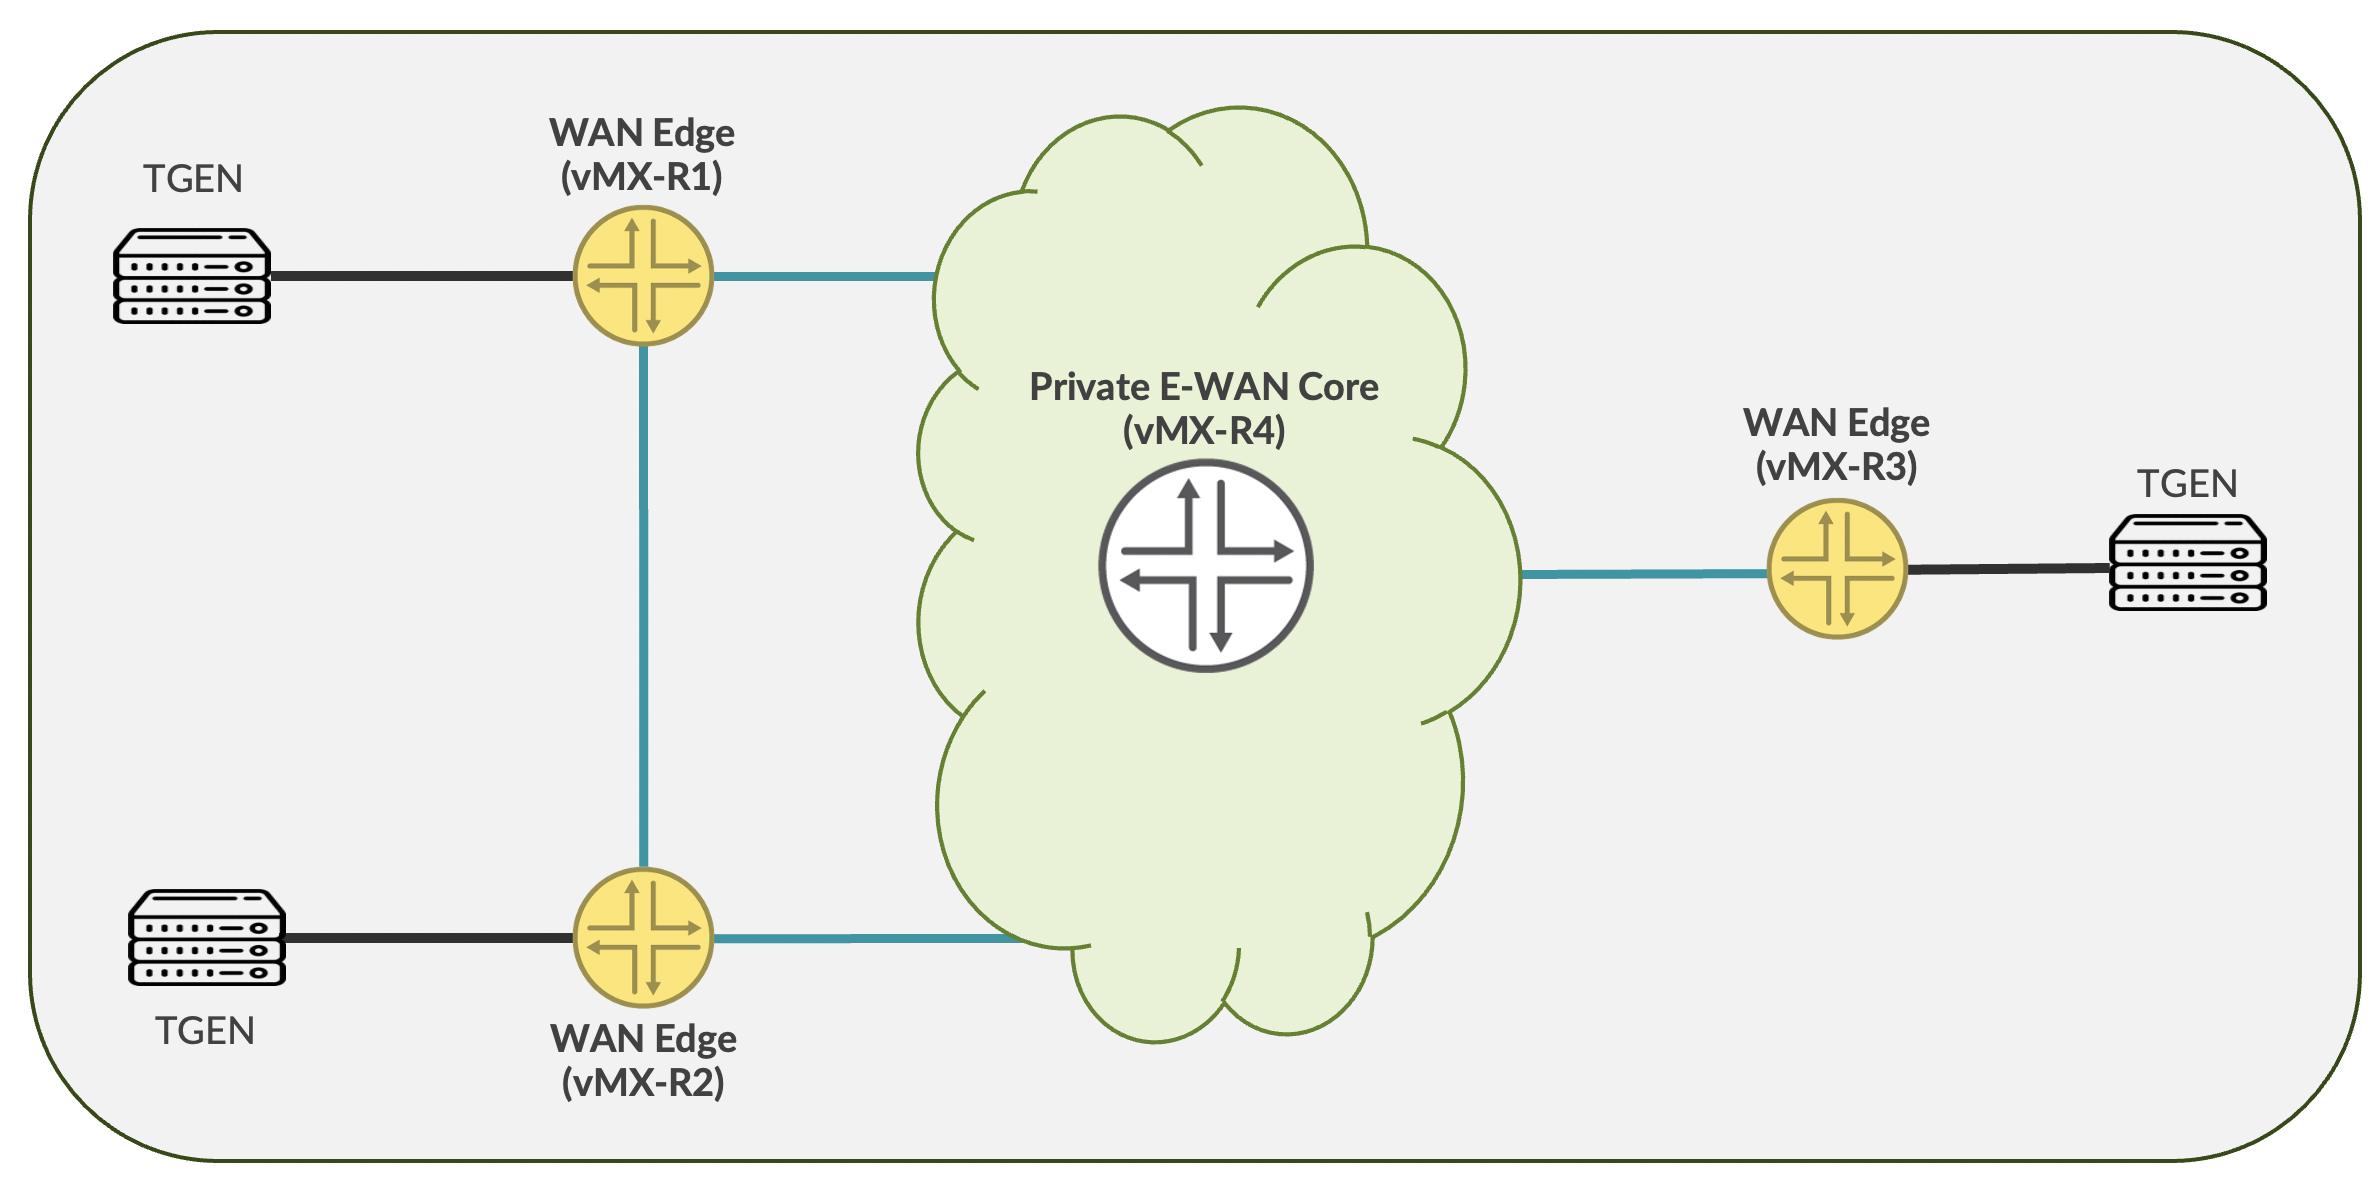
Topology Explanation
The lab environment consists of four Juniper vMX routers and a pre-configured Juniper Routing Assurance (JRA) platform. The JRA platform includes an existing Organization and Site configuration.
Routers in the Topology:
vMX-R1: Enterprise Branch WAN Router (initial configuration only)
vMX-R2: Enterprise Branch WAN Router
vMX-R3: Enterprise Branch WAN Router
vMX-R4: Enterprise WAN Core Router
The edge router (vMX-R4) is included in the topology solely to simulate WAN interface link issues for testing purposes.
BGP Configuration:
eBGP is configured between:
vMX-R2 and vMX-R4
vMX-R3 and vMX-R4
vMX-R1 has not yet been fully configured and will be the primary focus for the configuration and onboarding tasks in the lab.
Devices Connections
Branch |
Interface |
IP Address |
ISP |
IP Address (vMX-R4) |
|---|---|---|---|---|
vMX-R1 |
ge-0/0/0 |
10.10.1.2/24 |
ge-0/0/0 |
10.10.1.1/24 |
vMX-R2 |
ge-0/0/0 |
10.10.2.2/24 |
ge-0/0/1 |
10.10.2.1/24 |
vMX-R3 |
ge-0/0/0 |
10.10.3.2/24 |
ge-0/0/2 |
10.10.3.1/24 |
Routing Assurance Login
Open Chrome and navigate to https://routing.ai.juniper.net/, you should see the login page to Juniper Routing Assurance GUI.
Login using your Lab User credentials
Username - Use Username Provided
Password - Use Password Provided
Once logged in, user will see the following page.
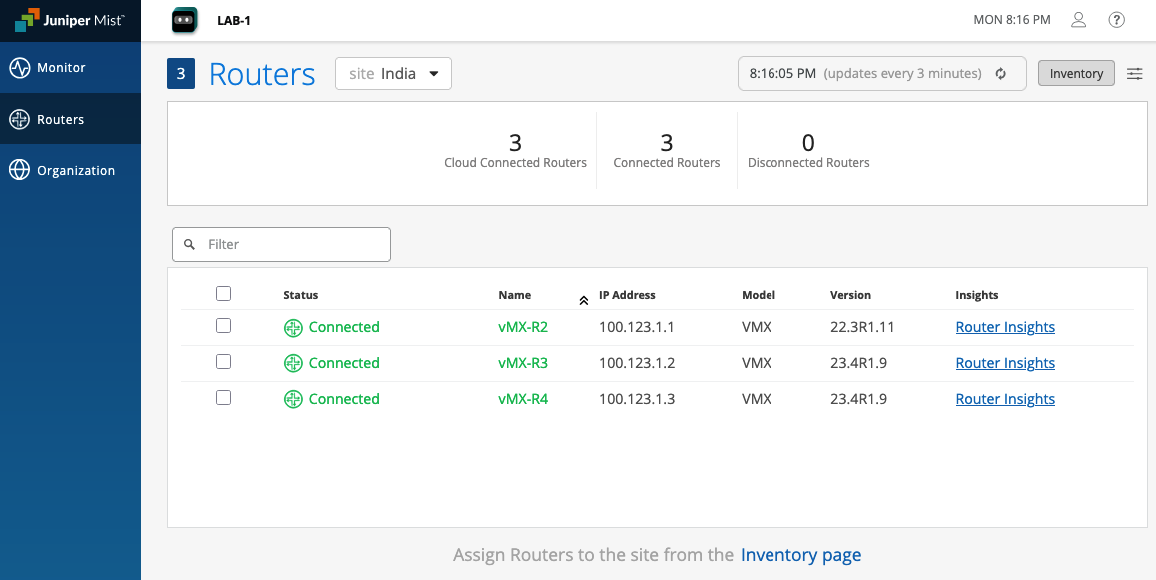
UI Navigation
We have already onboarded some of the routers and assigned them to a site for you to play around.
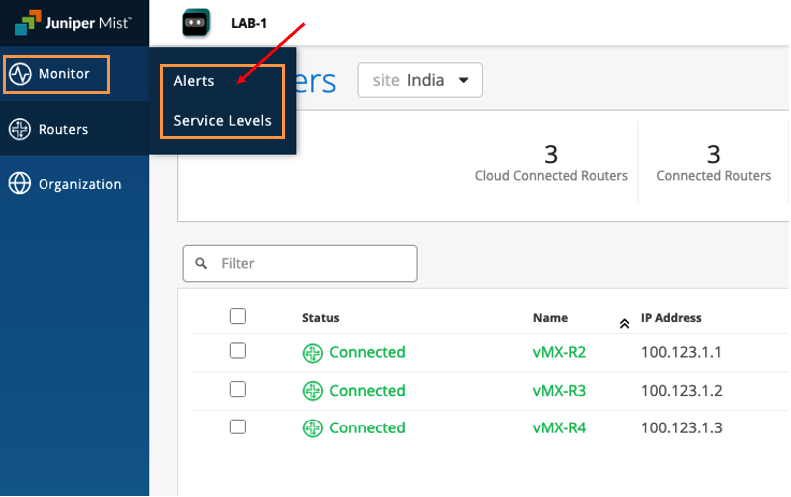
Monitor section provides information about router Alerts and Service Level Expectations
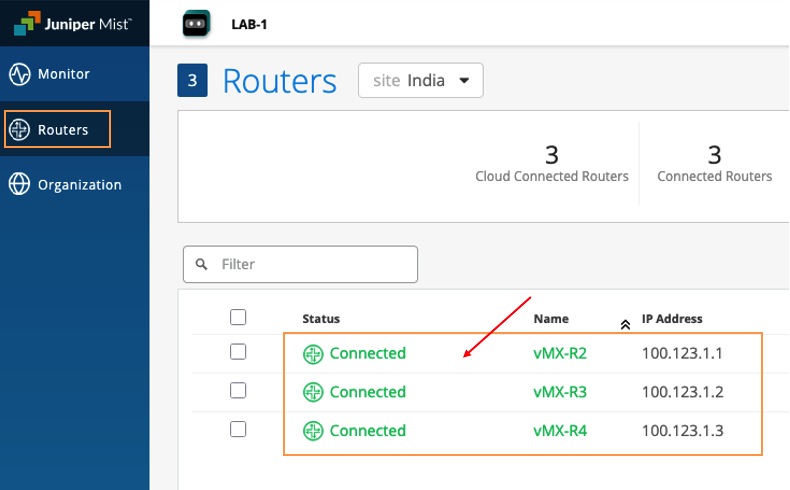
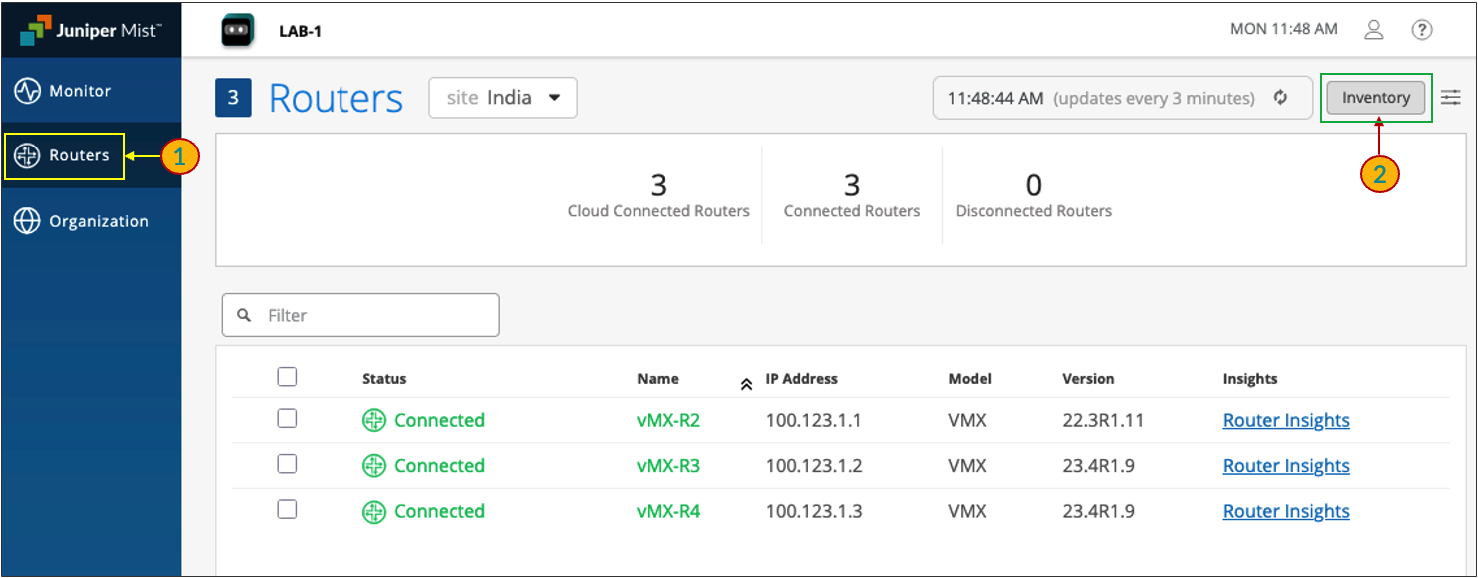
Routers section shows information about all the routers onboarded on JRA
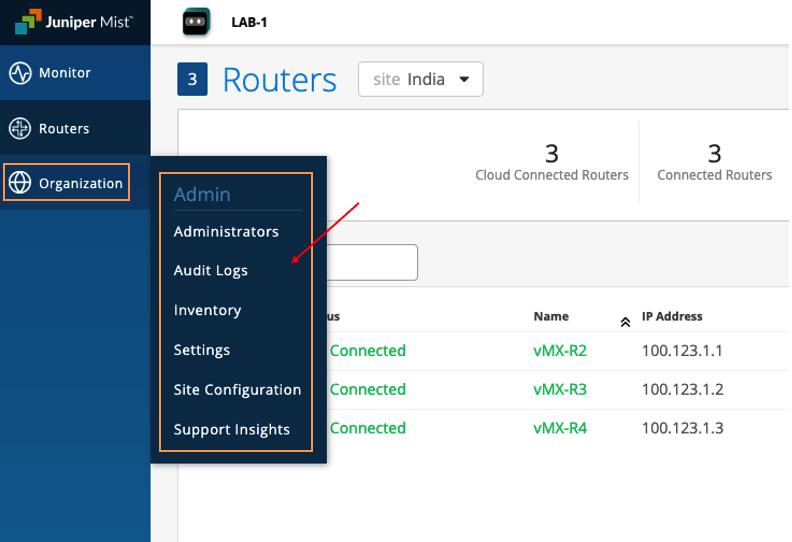
Organization section provides various options like:
Administrators - to manage users’ access
Site Configuration - to create / manage sites
Router Onboarding and Built-In Tools
Router Onboarding
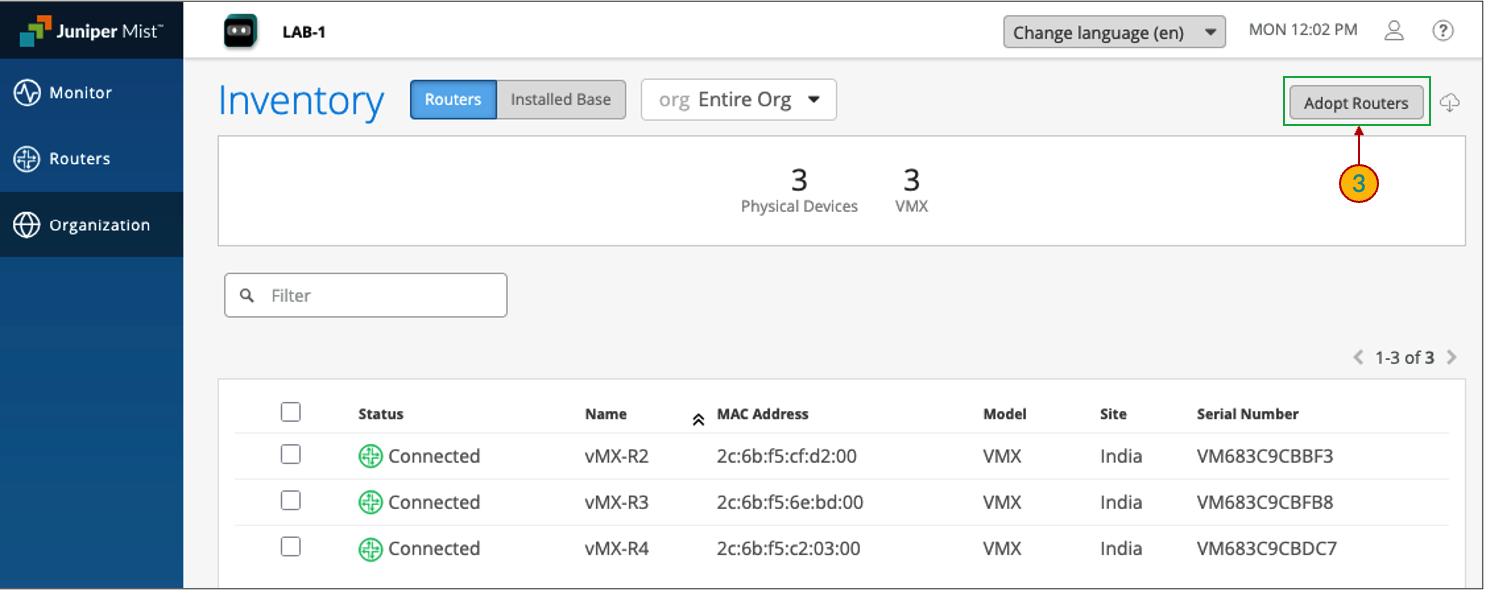
Navigate to Routers section, then click on Inventory > Adopt Routers
Click Copy to Clipboard option to copy the CLI commands, and then paste them into the router’s command-line interface to apply the configuration
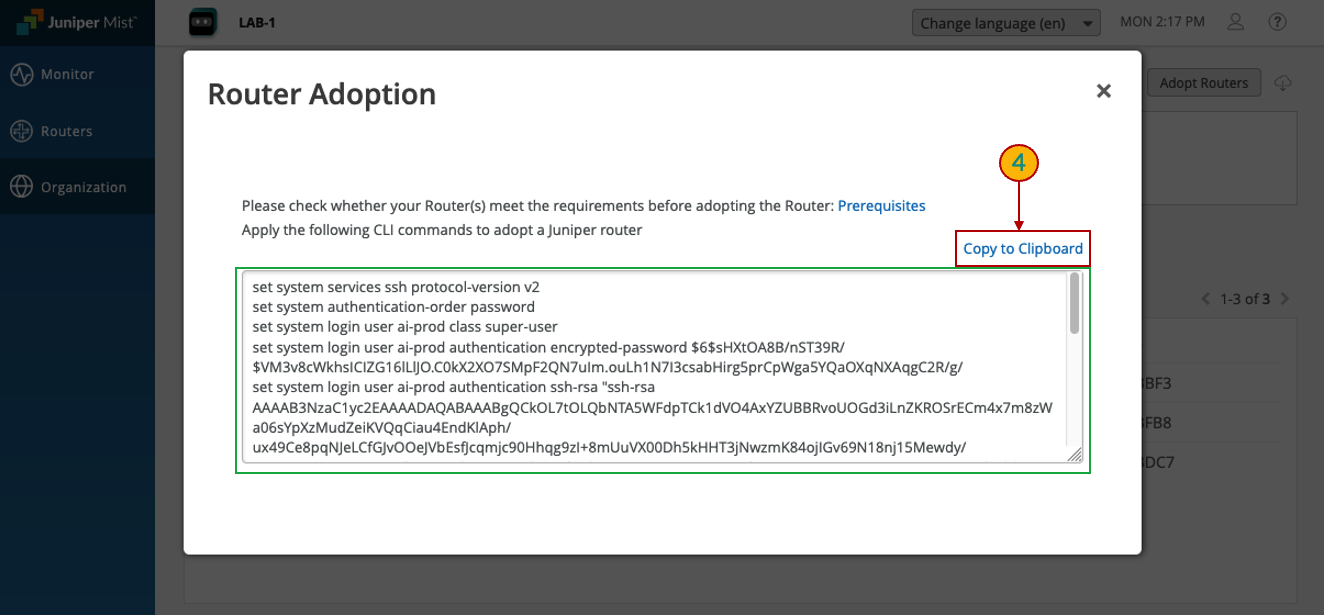
Enter configuration (edit) mode, paste the copied commands into the CLI, and then commit the changes to apply the configuration
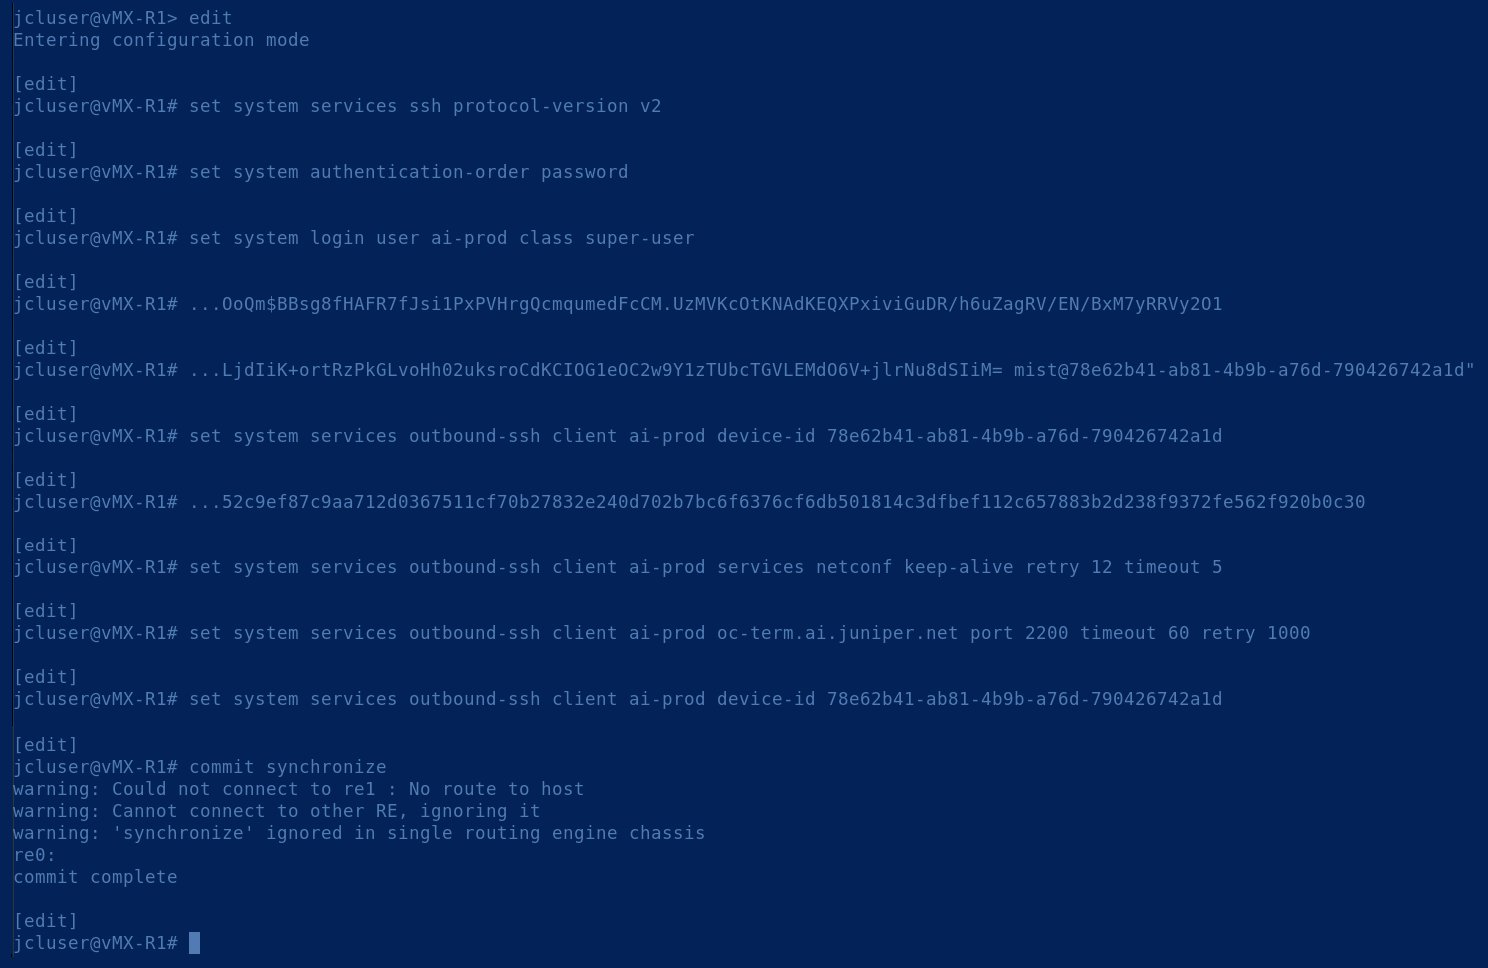
After applying the changes, navigate to Inventory page. The router will appear in the Unassigned state.
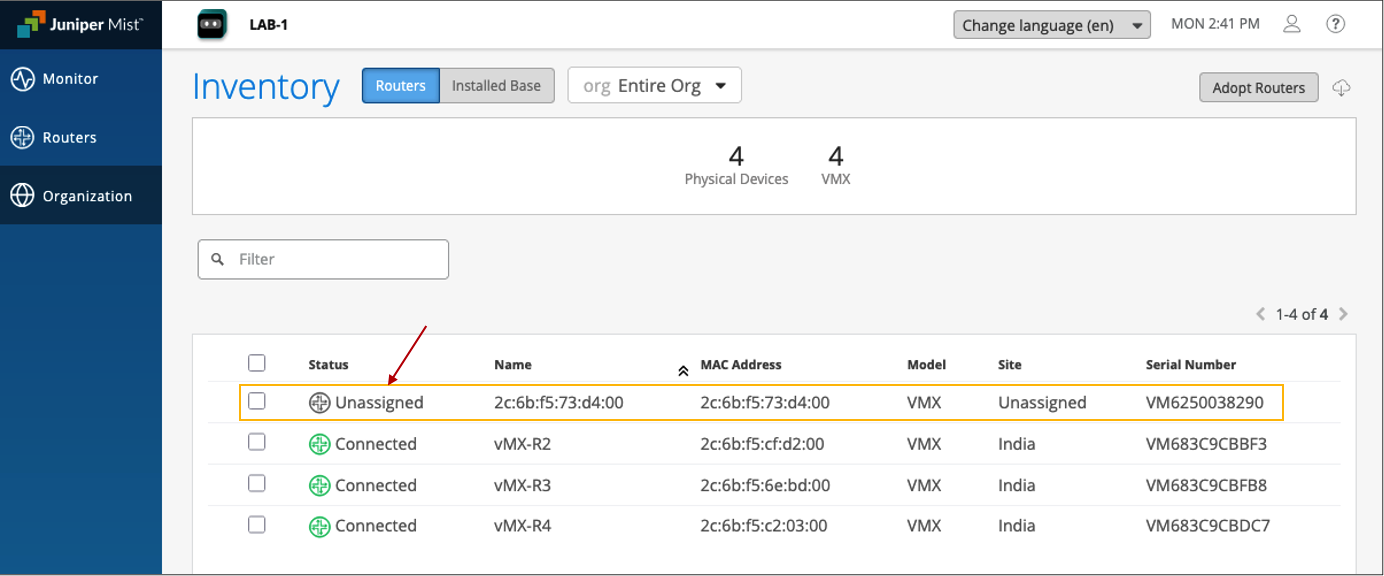
Now lets assign the router to a Site
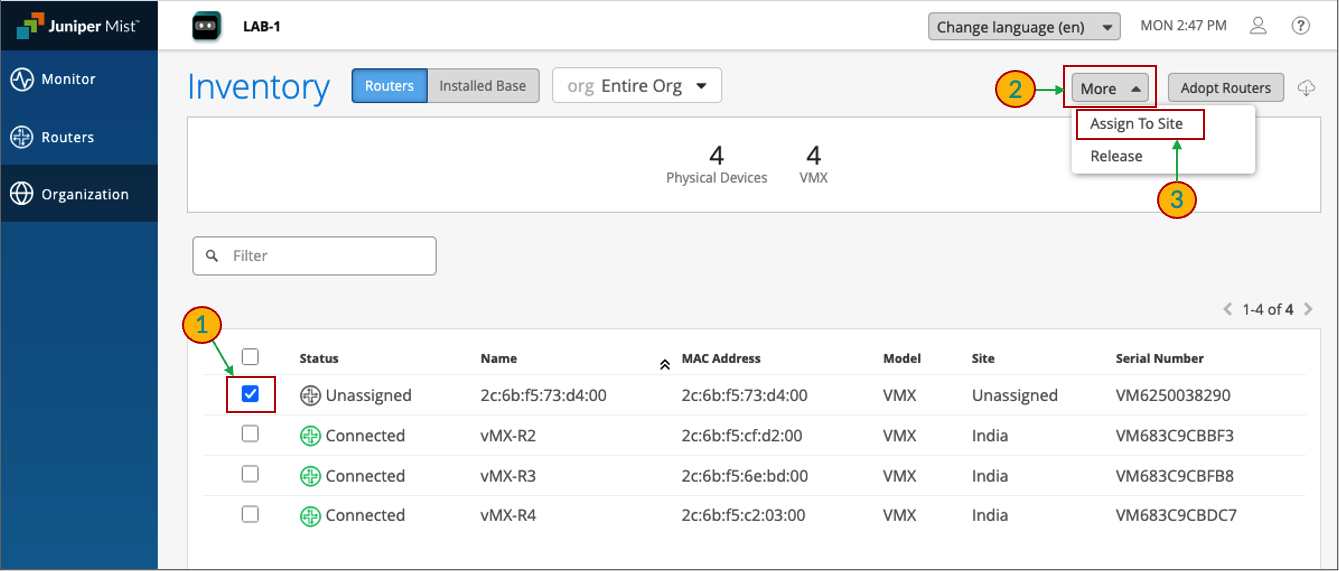
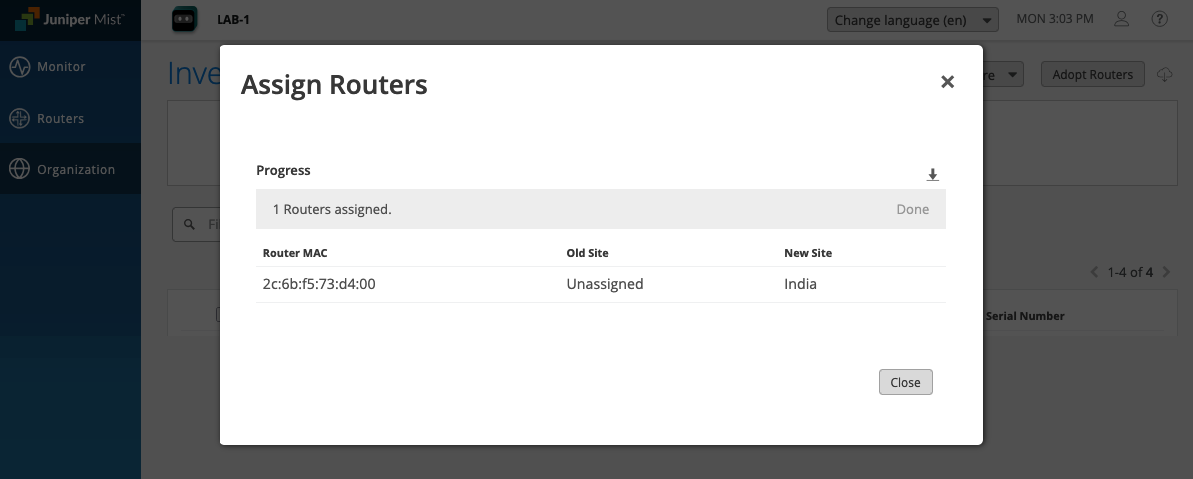
Select the Unassigned router, then click on More > Assign to Site
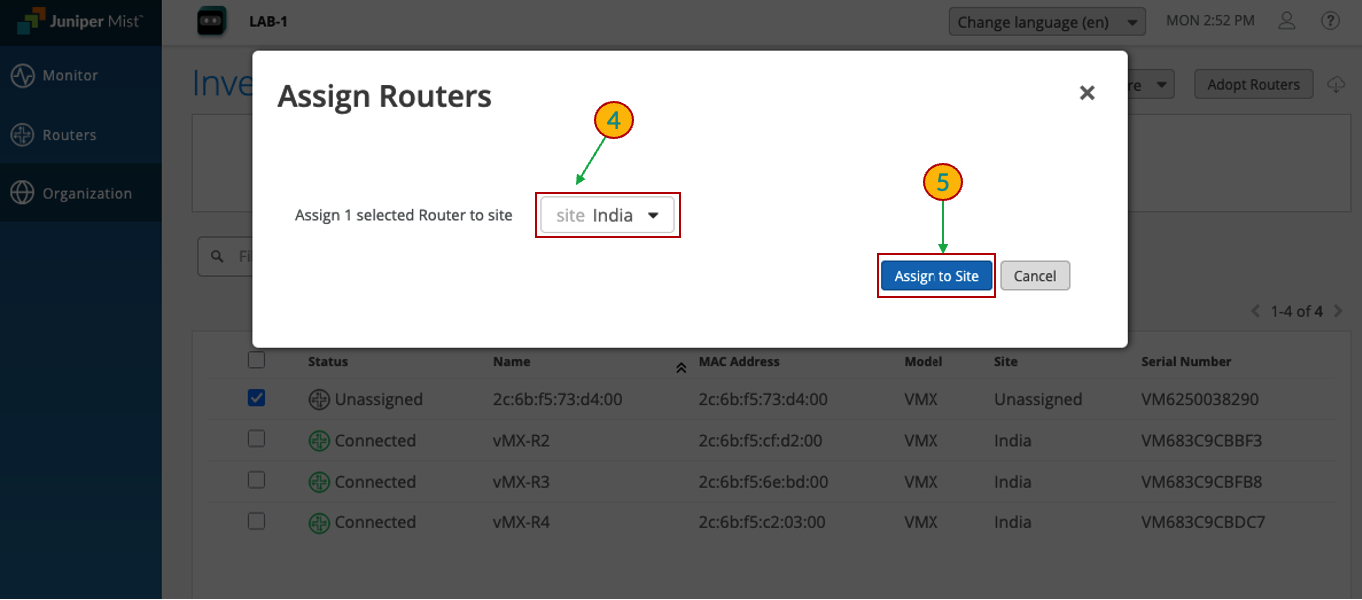
Select the Site to which the Router needs to be added, in this case it’s Site: India
Click on Assign to Site
A pop-up will appear confirming: 1 Routers assigned.
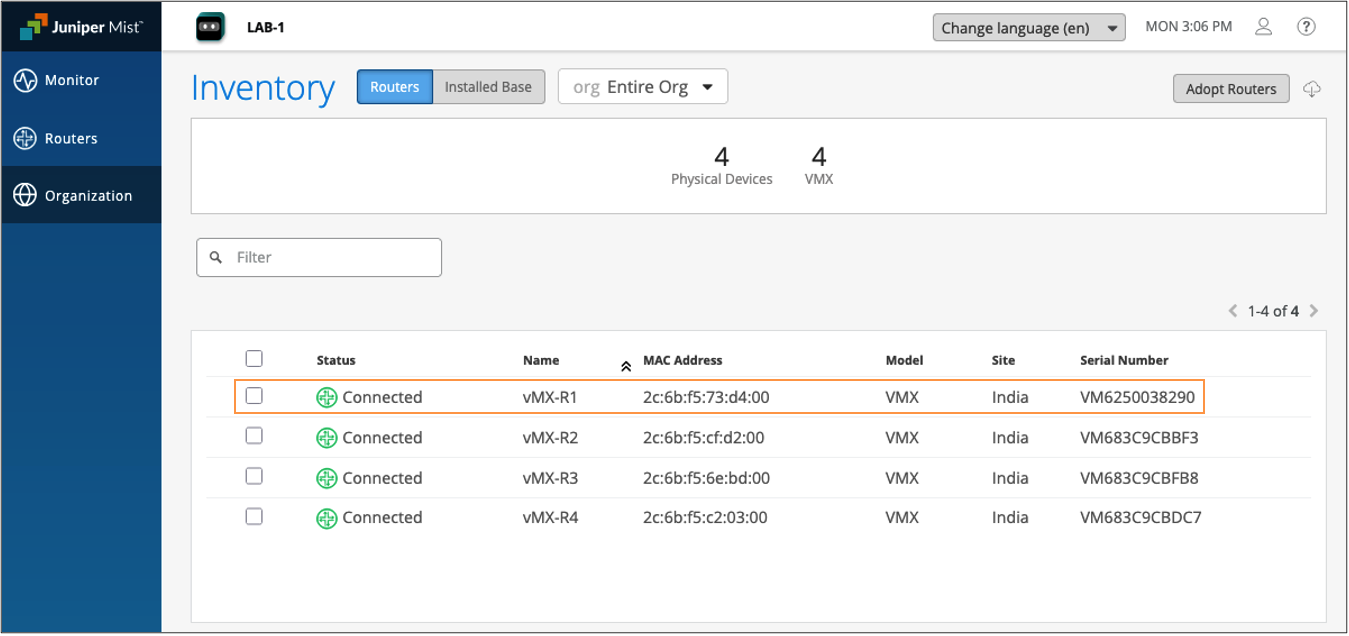
Navigate to the Inventory page, the new device will now show as Connected
Router Configuration
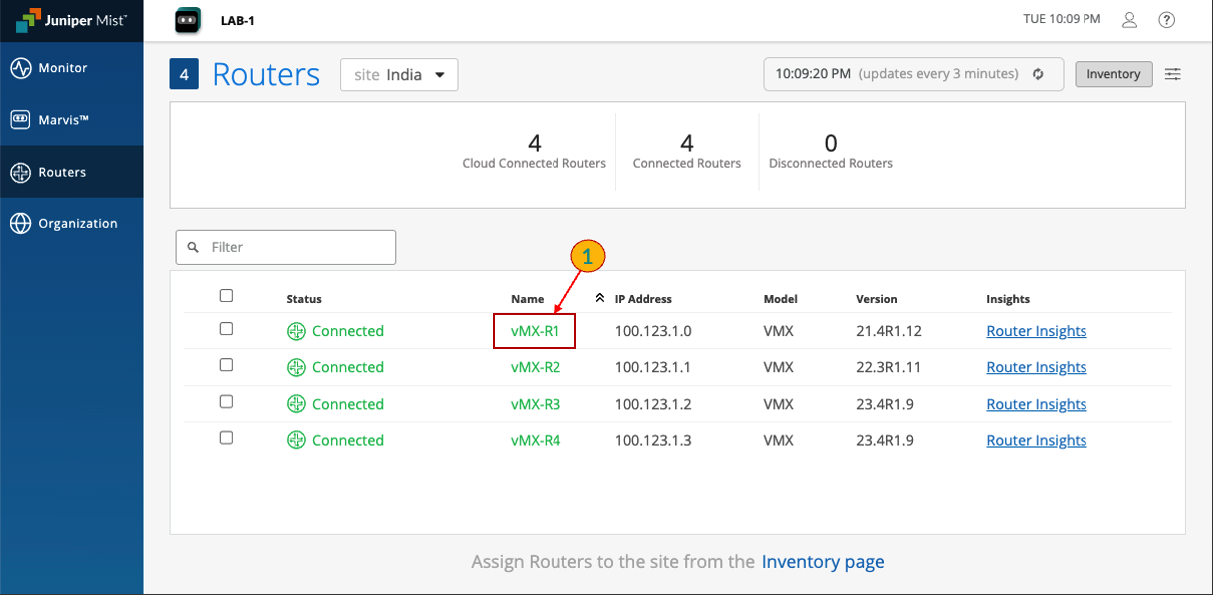
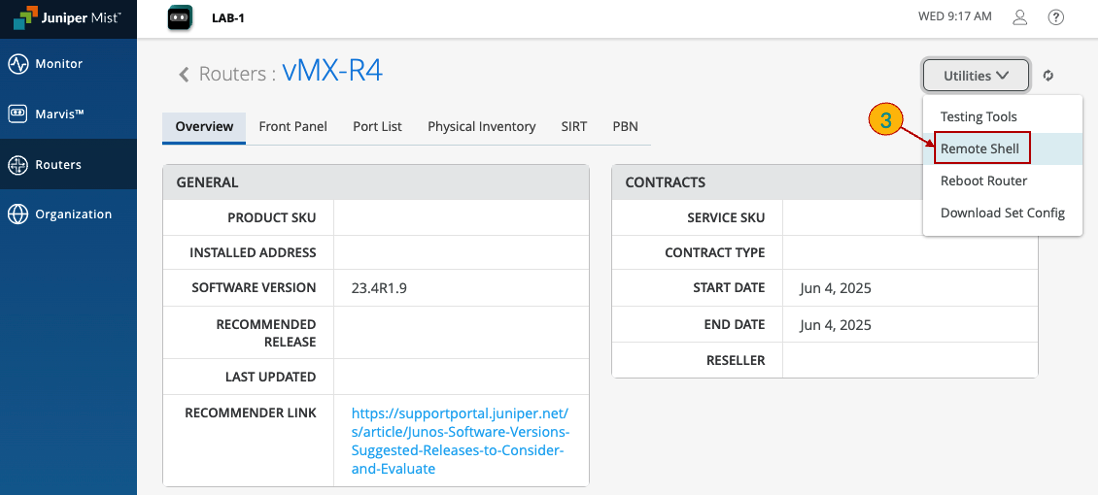
Navigate to the Routers section
Click on vMX-R1, the Router which needs to be configured.
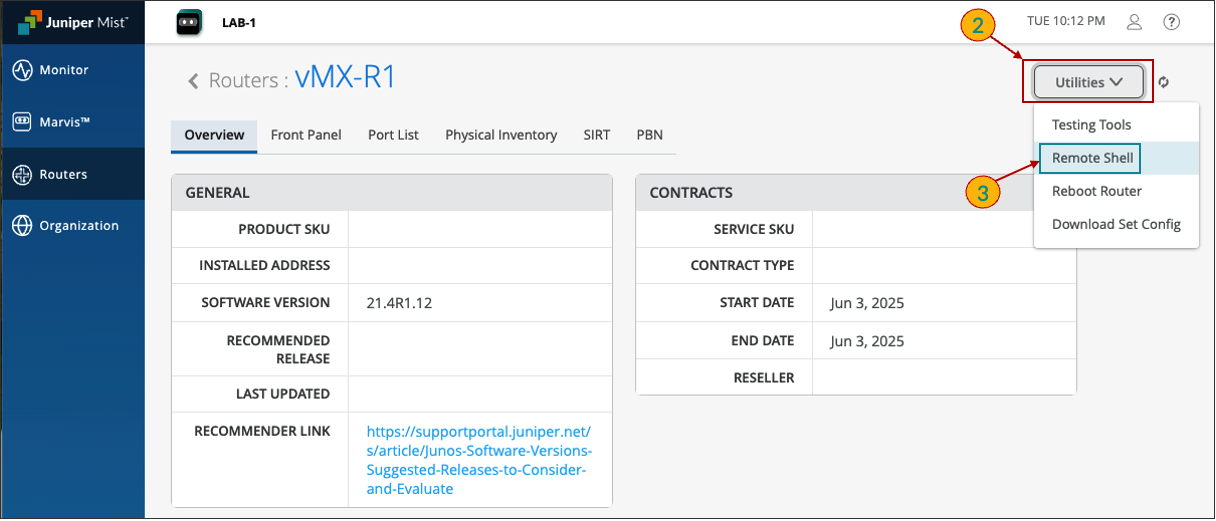
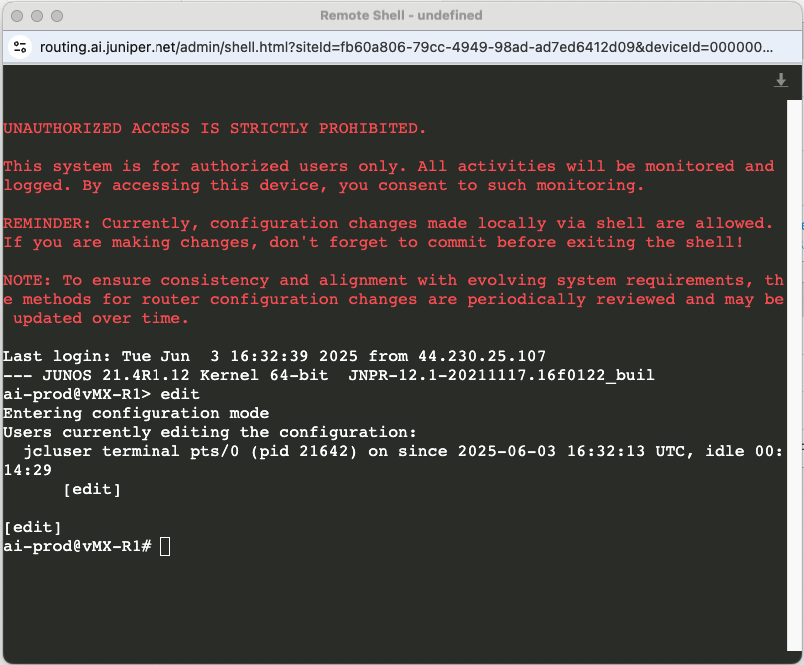
Click on Utilities > Remote Shell
A new shell window will open, enter edit mode.
edit
To configure BGP on your device, enter the following commands (Copy the below bgp configuration and paste it on the shell):
set interfaces lo0 unit 0 family inet address 1.1.1.1/32
set routing-options autonomous-system 65001
set protocols bgp group EBGP_PEERS type external
set protocols bgp group EBGP_PEERS peer-as 65000
set protocols bgp group EBGP_PEERS log-updown
set protocols bgp group EBGP_PEERS local-address 10.10.1.2
set protocols bgp group EBGP_PEERS neighbor 10.10.1.1
set protocols bgp group EBGP_PEERS export EXPORT-BGP
set policy-options policy-statement EXPORT-BGP term 1 from route-filter 1.1.1.1/32 exact
set policy-options policy-statement EXPORT-BGP term 1 then accept
set policy-options policy-statement EXPORT-BGP then reject
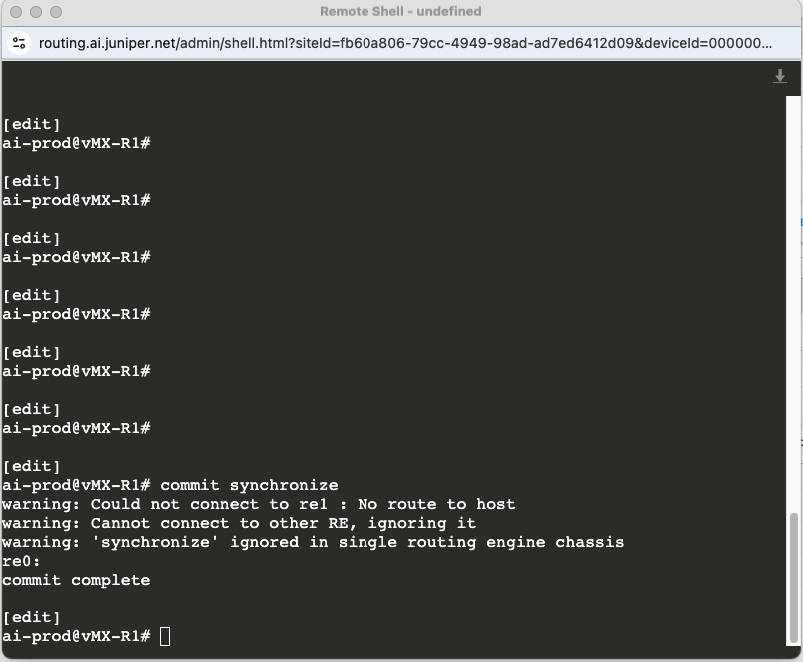
Commit the changes:
commit synchronize
Verification
Navigate to Routers section, click on Utilities > Testing Tools
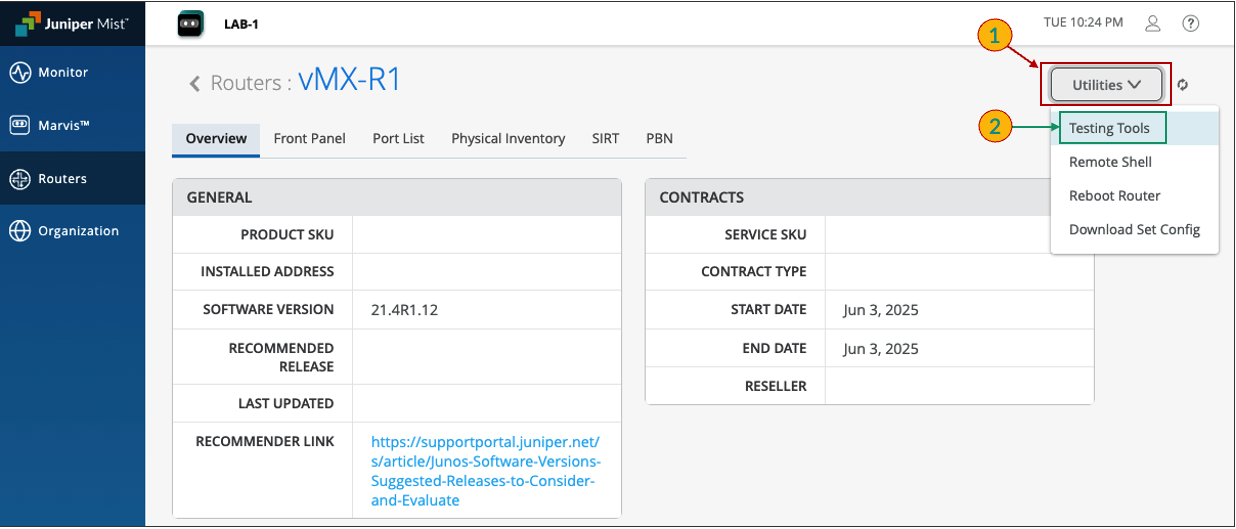
Select Ping, then enter the ip address and initiate a ping
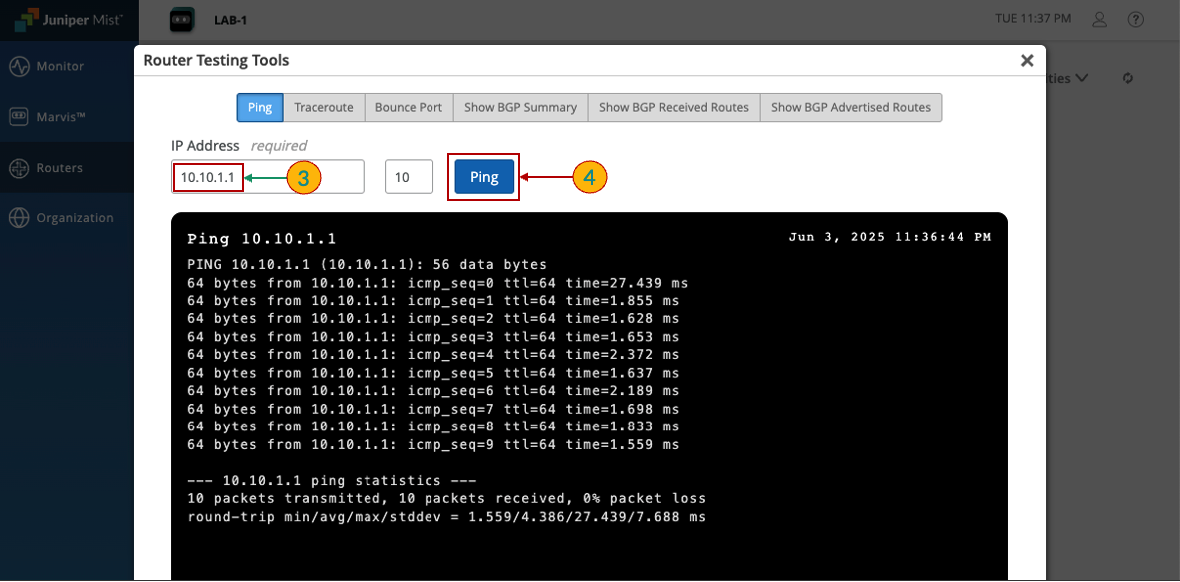
The output confirms that the ping was successful. Similarly, we can use other options to gather more detailed information.
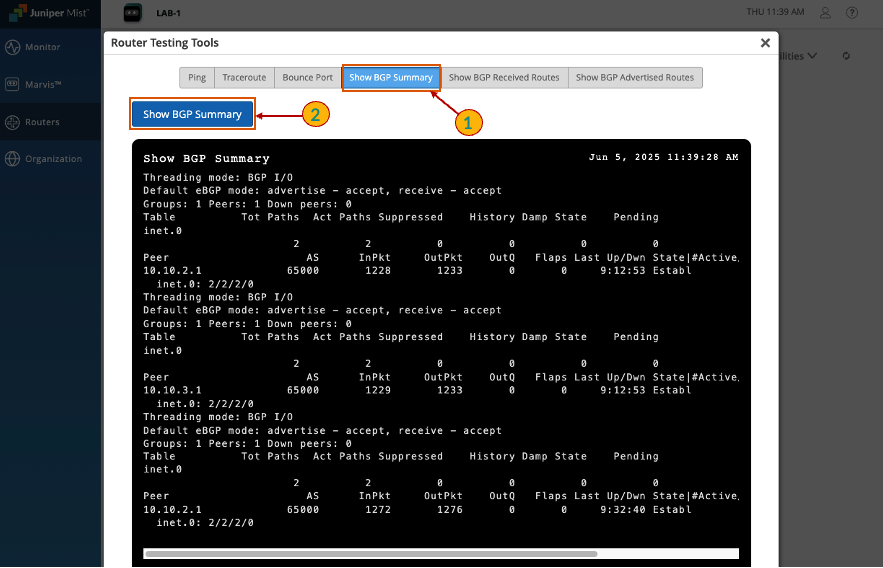
BGP Peering - verify bgp neighborship
Select Show BGP Summary section, then Show BGP Summary option
The output shows that BGP neighborship has been successfully established
Configure Alerts
Navigate to Monitor section, click on Alerts > Alerts Configuration
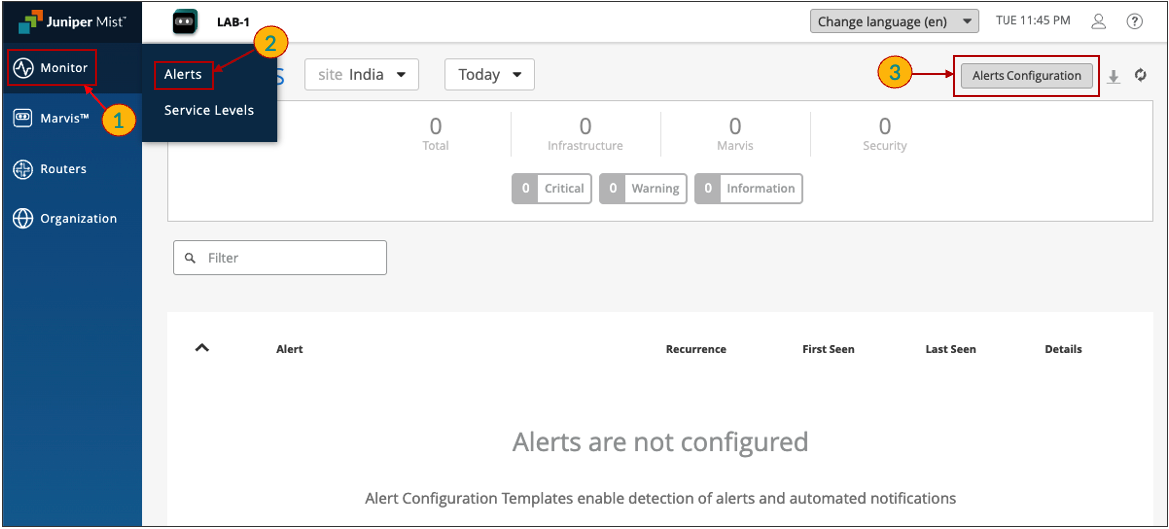
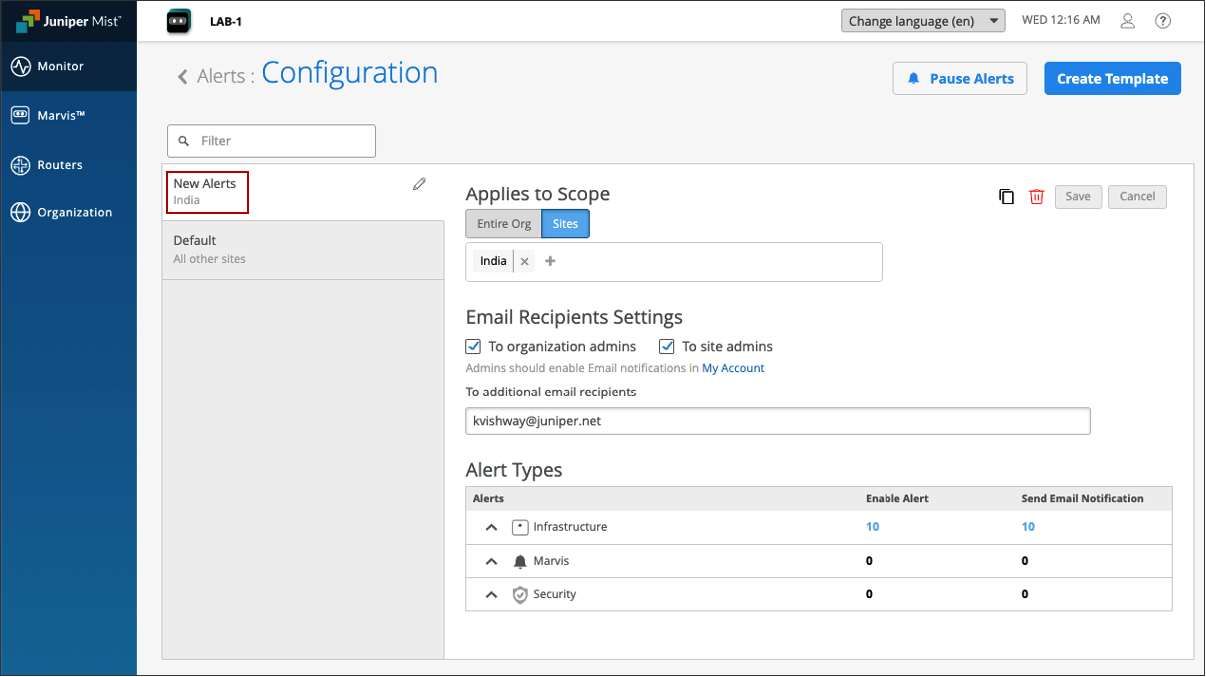
Click on Create Template, and enter the following:
Name - New Alerts
Applies to Scope - Site
India
Email Recipients Settings
To organization admins - Checked
To site admins - Checked
To additional email recipients - Add any additional emails you would like
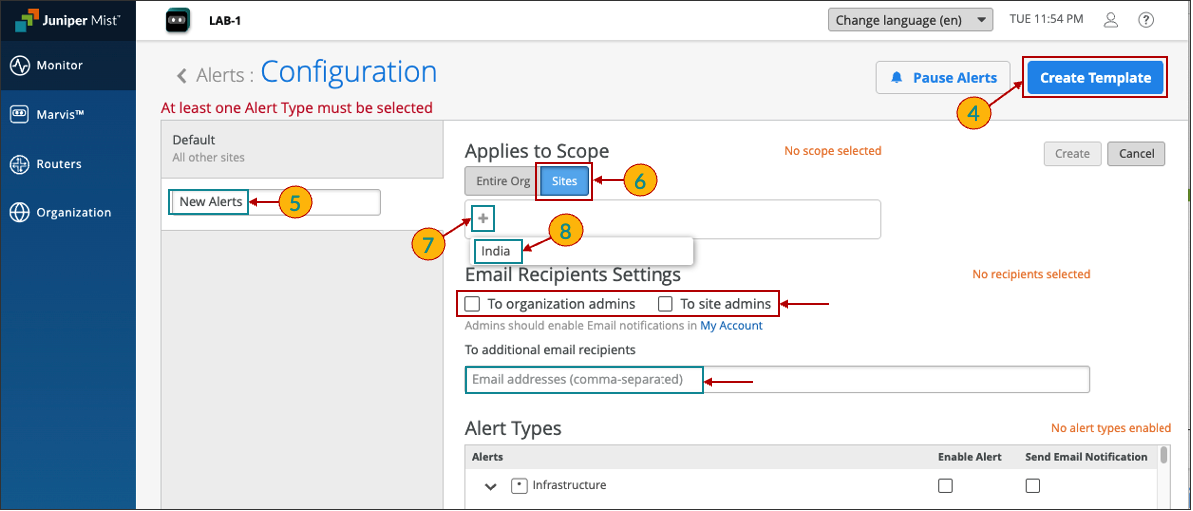
Select the Port (interface) and BGP status Alerts available under Infrastructure and click on Create
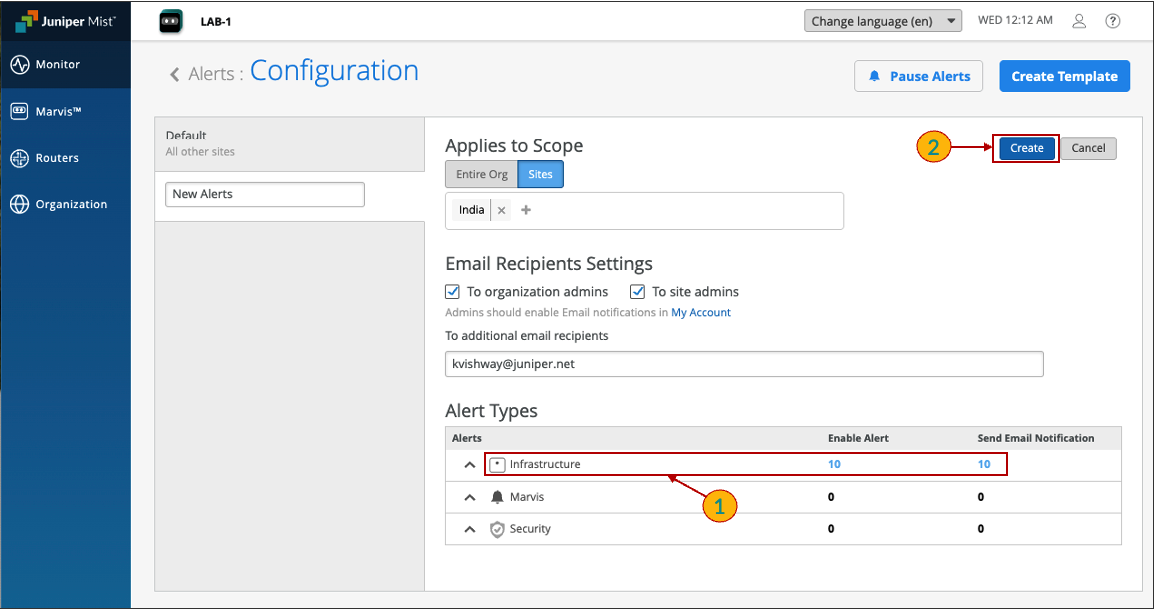
Then click Save
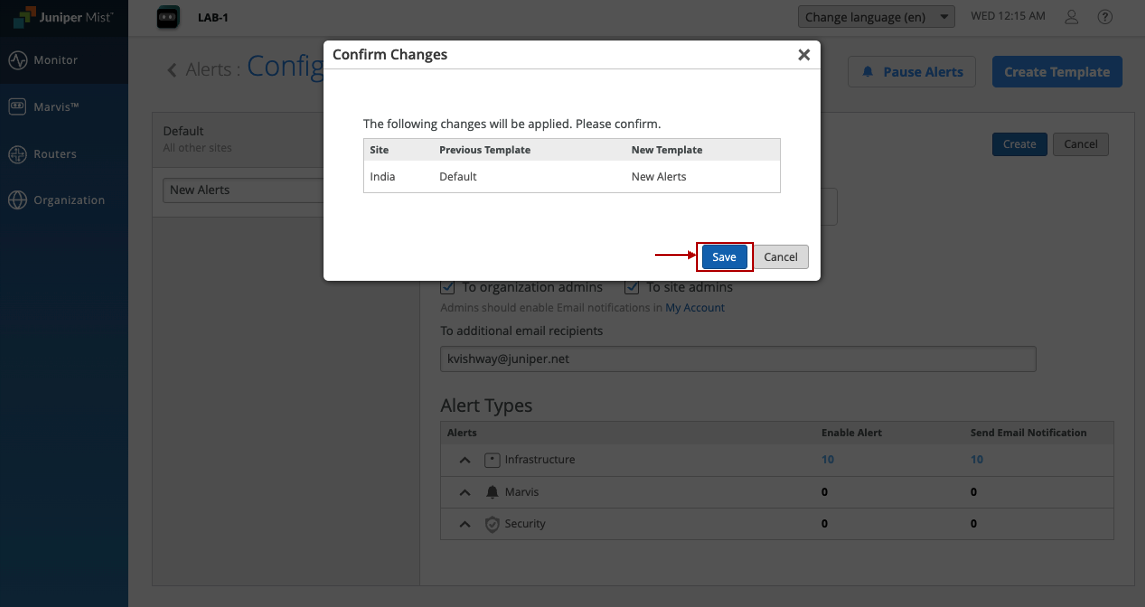
An Alert has been created, if required you can now edit or delete it
Router Insights & Events
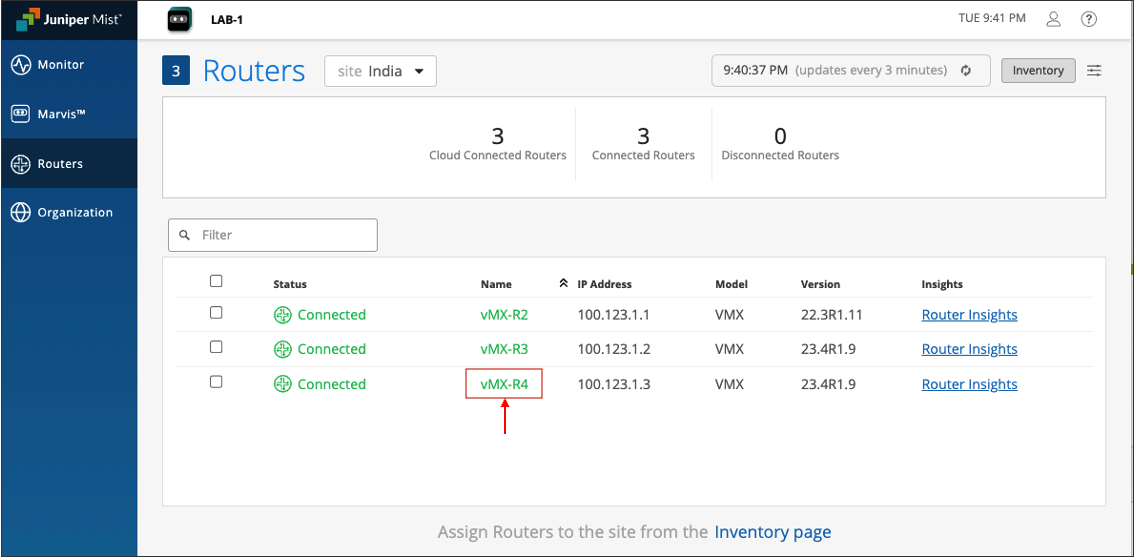
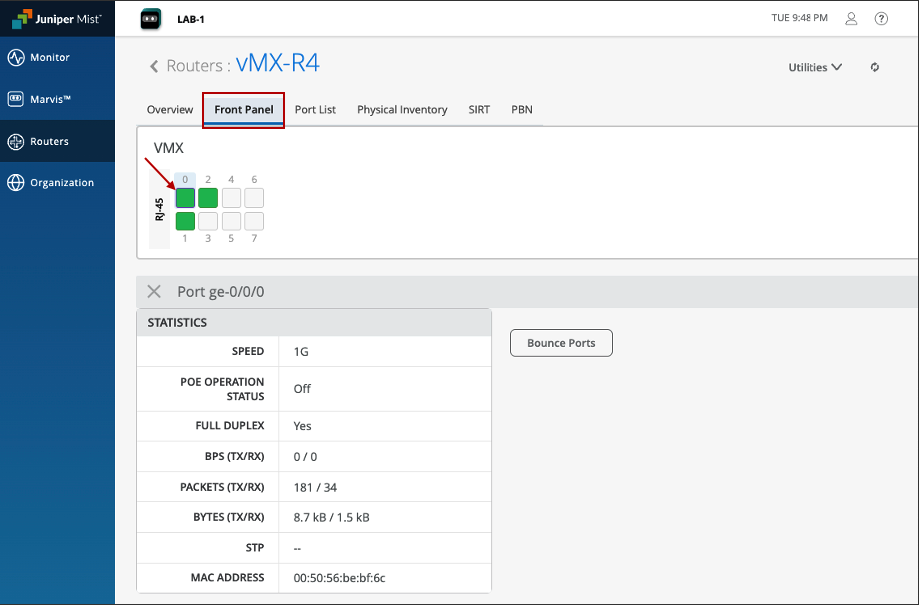
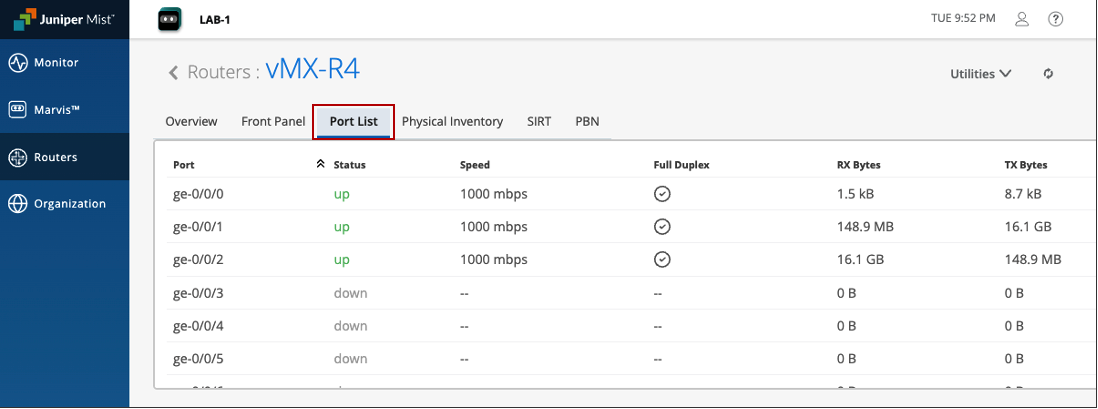
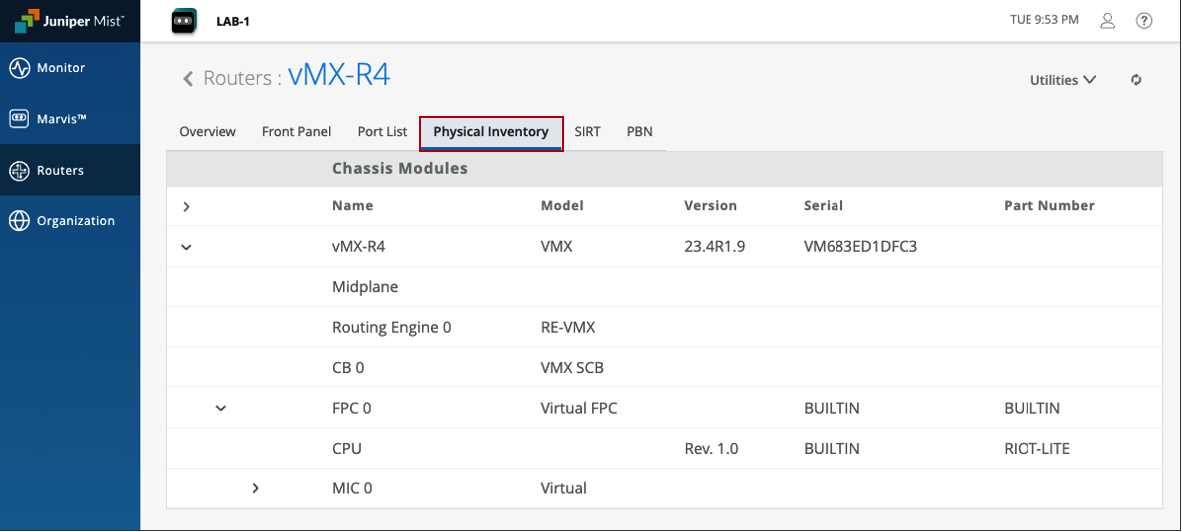
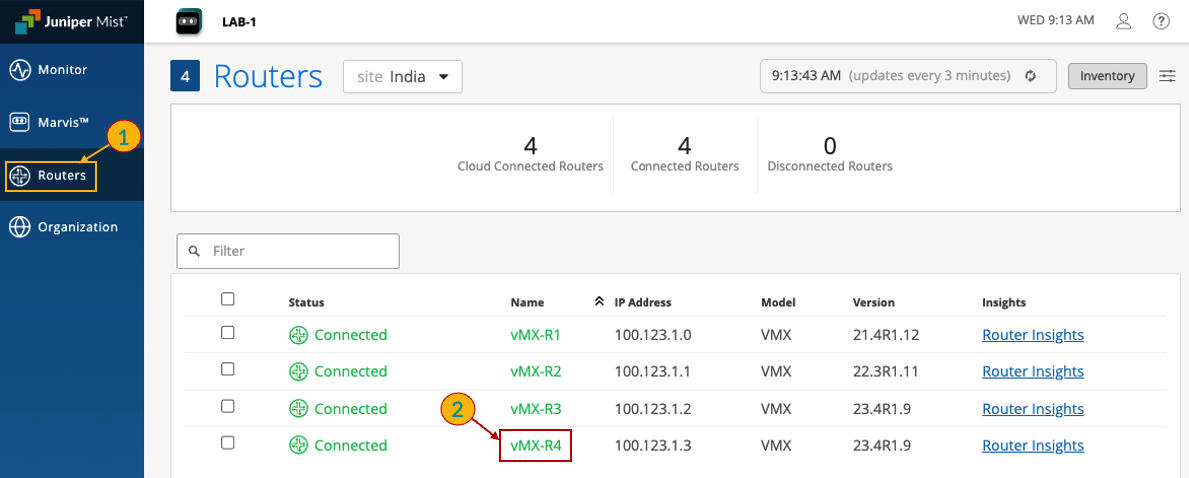
Navigate to the Routers section, and click on vMX-R4
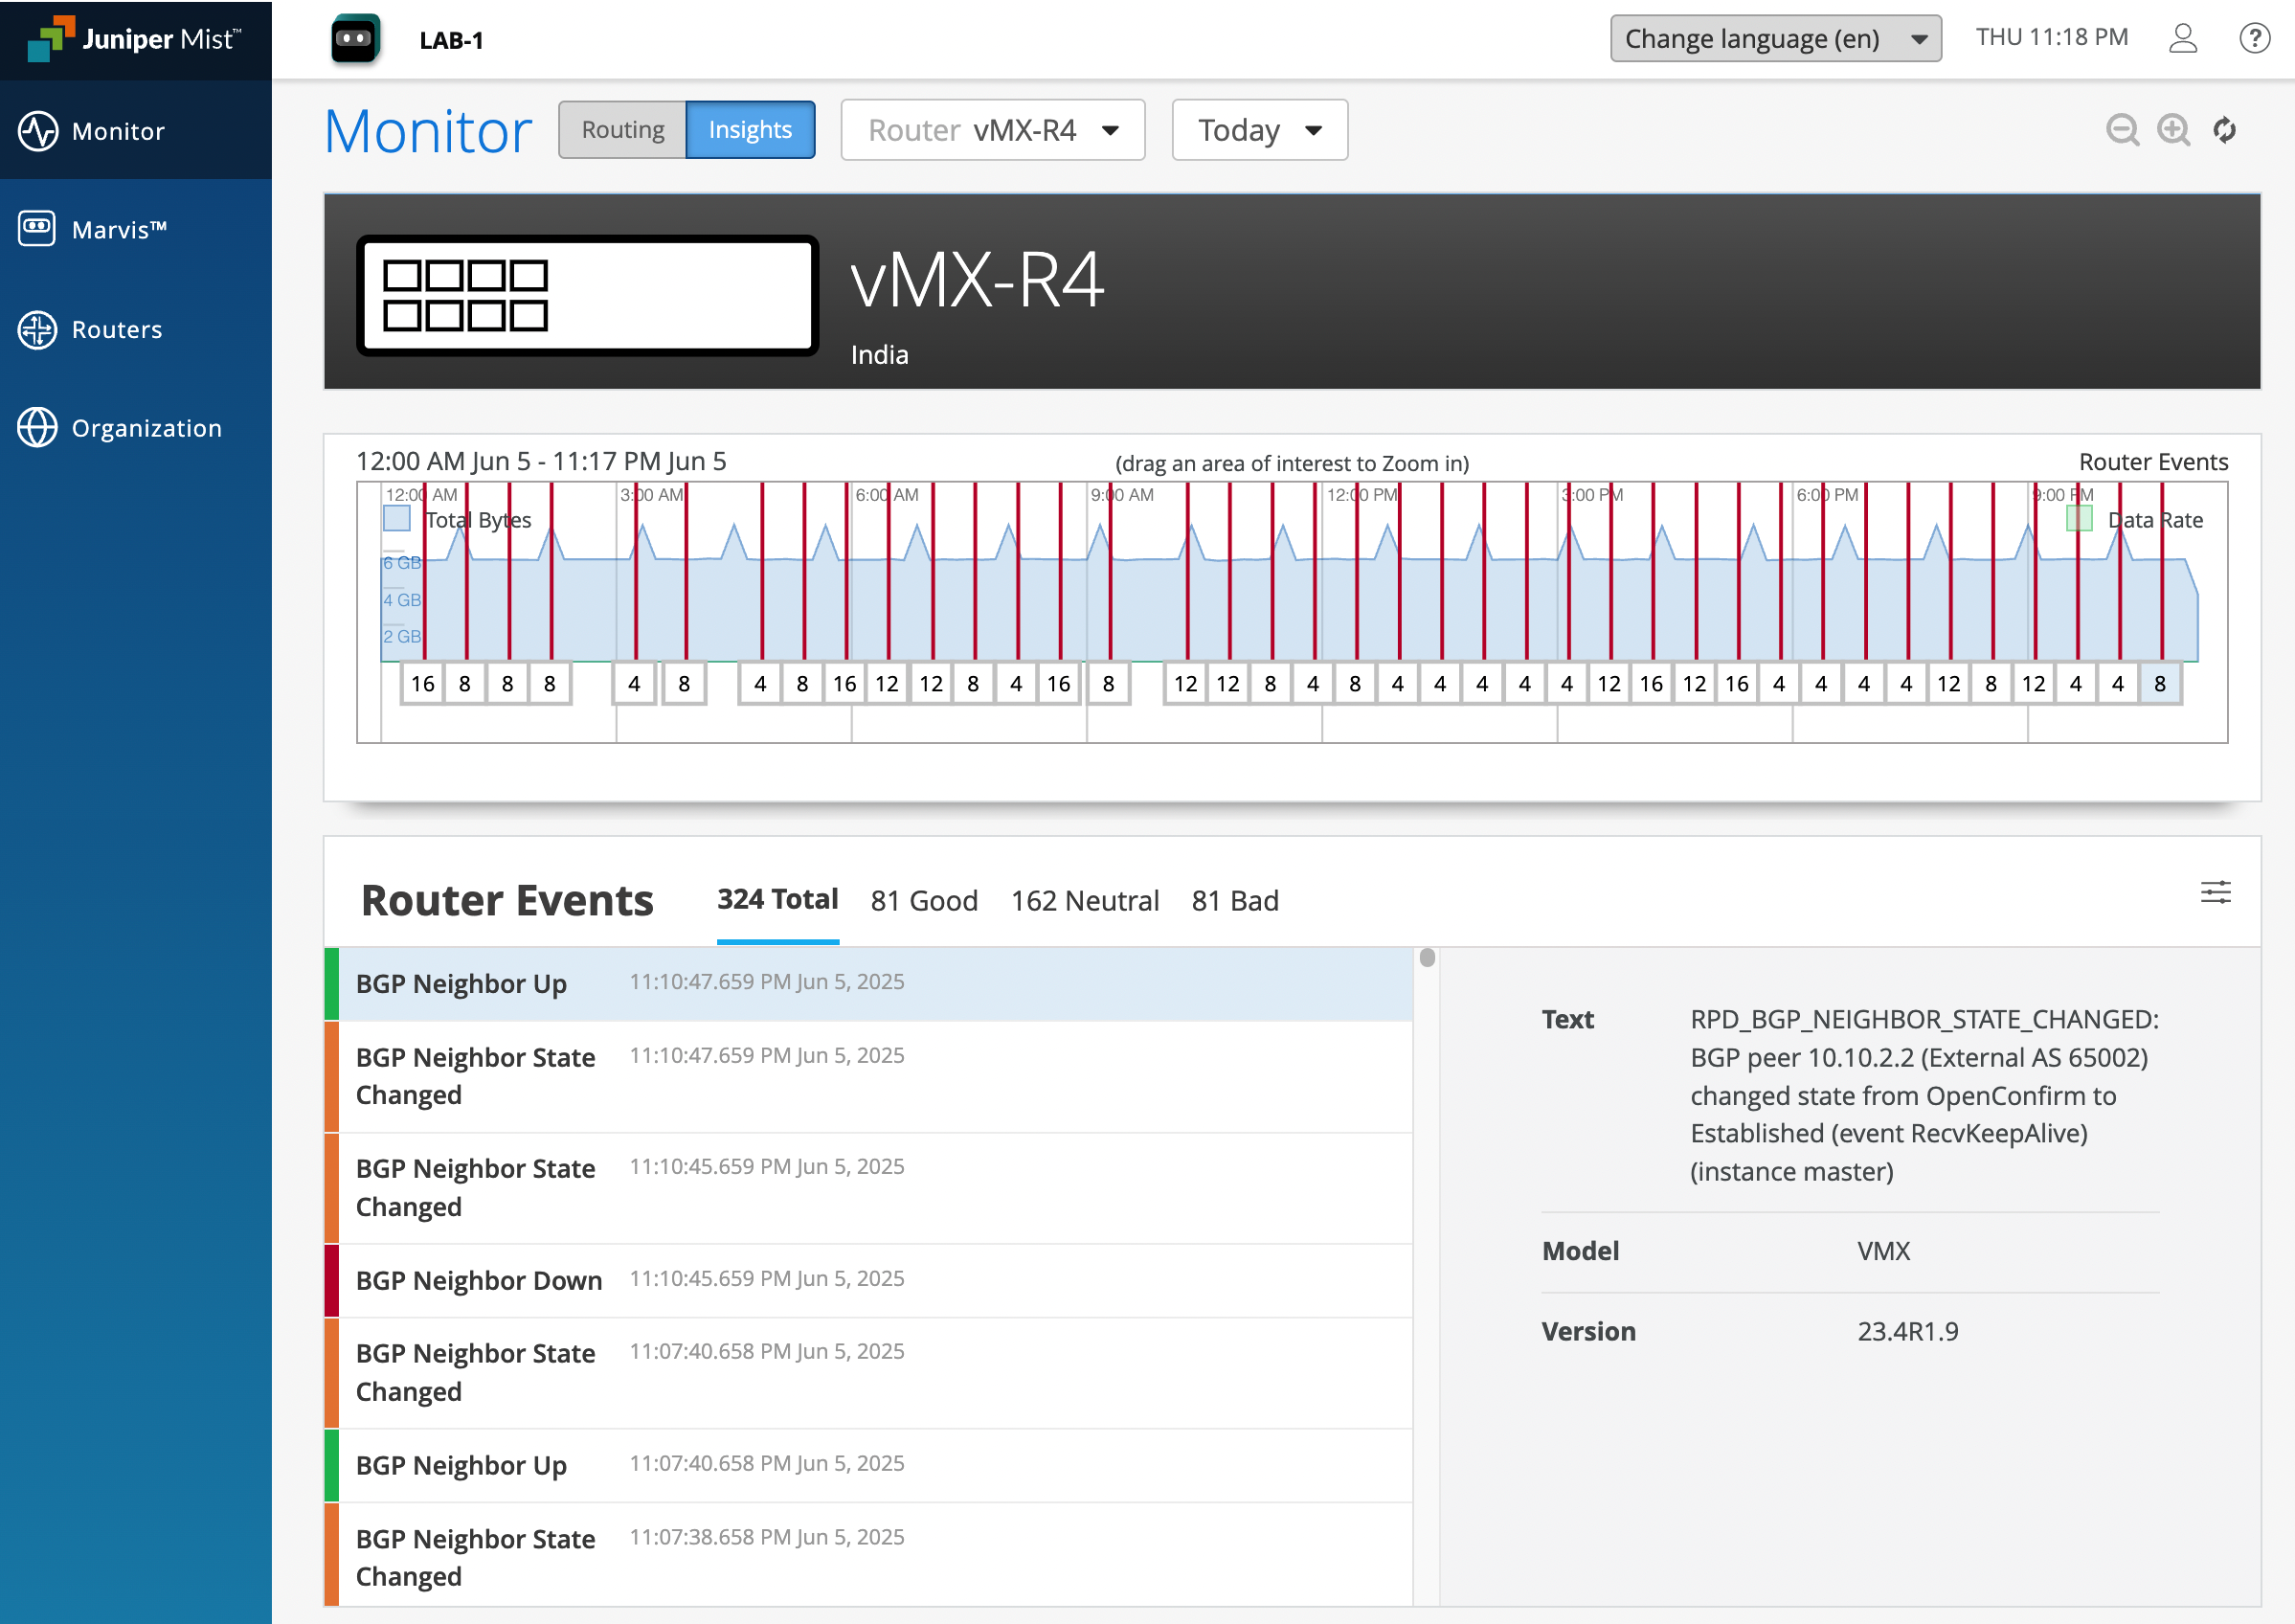
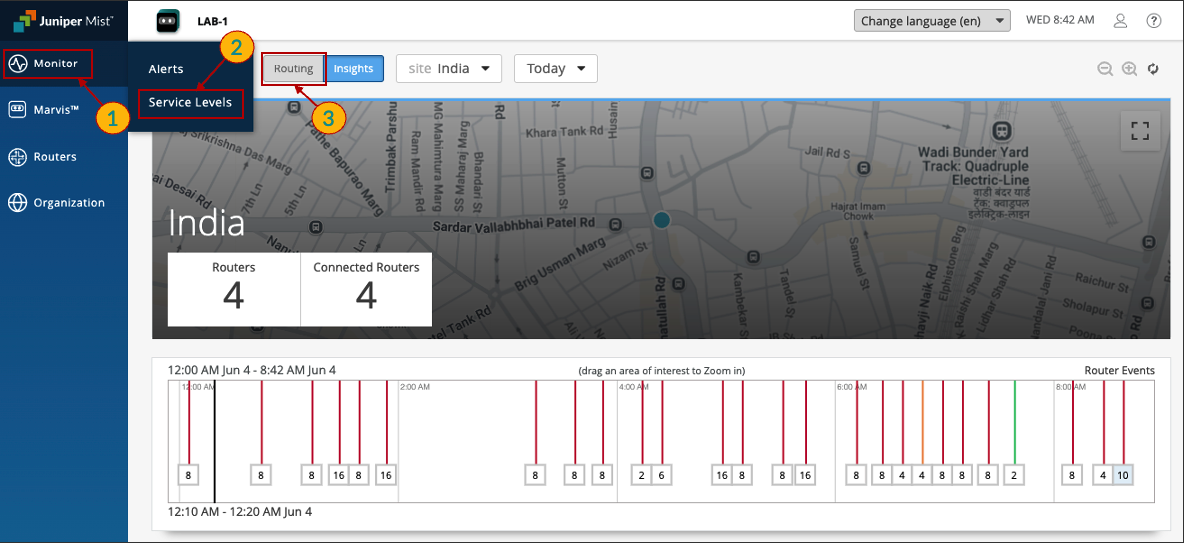
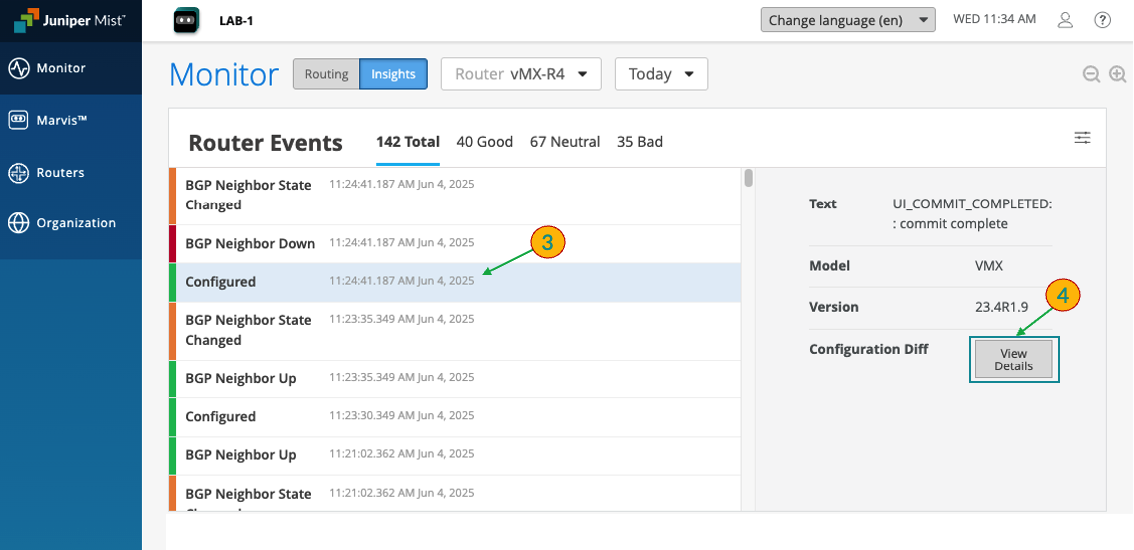
Lets look at Router Events, Navigate to Monitor section
Click Service Levels > Insights, then select vMX-R4
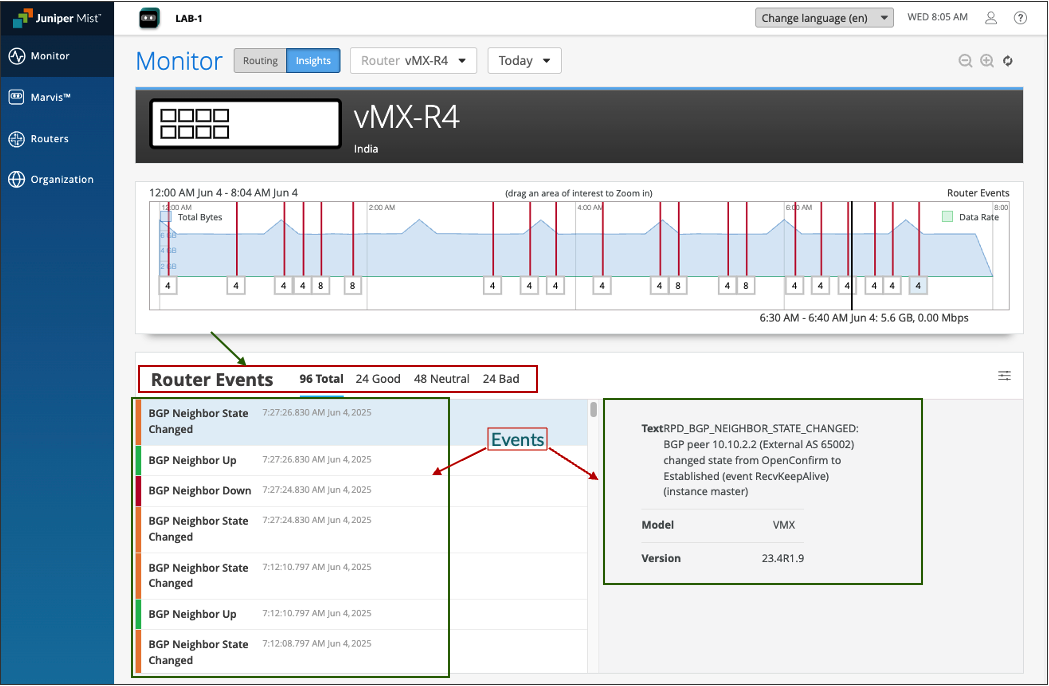
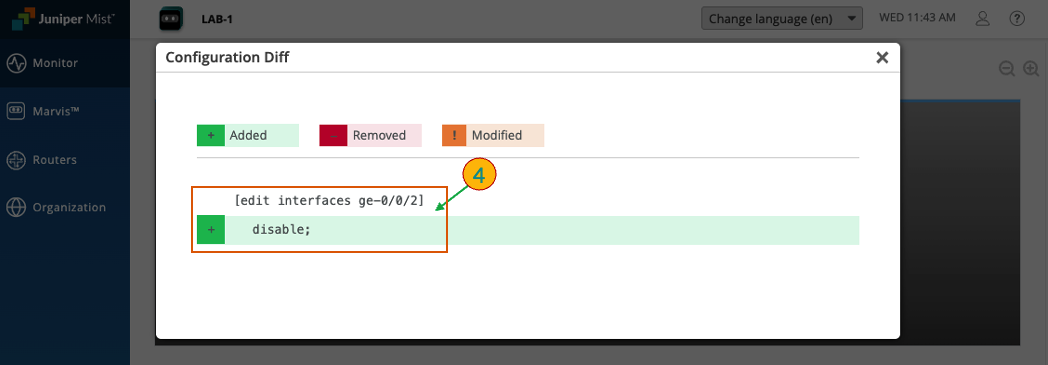
To view configuration change, click a Configured event, then click View Details
Configuration Diff page appears displaying the configuration changes. Newly added configurations are highlighted in green, removed configurations are highlighted in red and modified configurations are highlighted in amber.
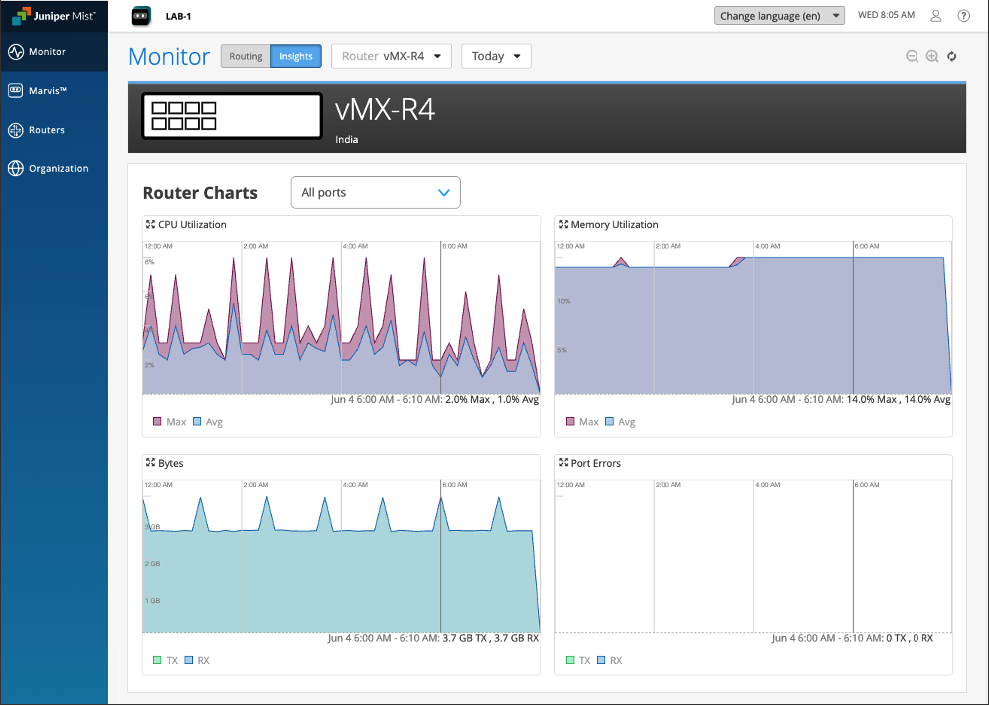
Looking at Router Performance, the following graphs shows CPU Utilization, Memory Utilization, Bytes transmitted and received, Port errors.
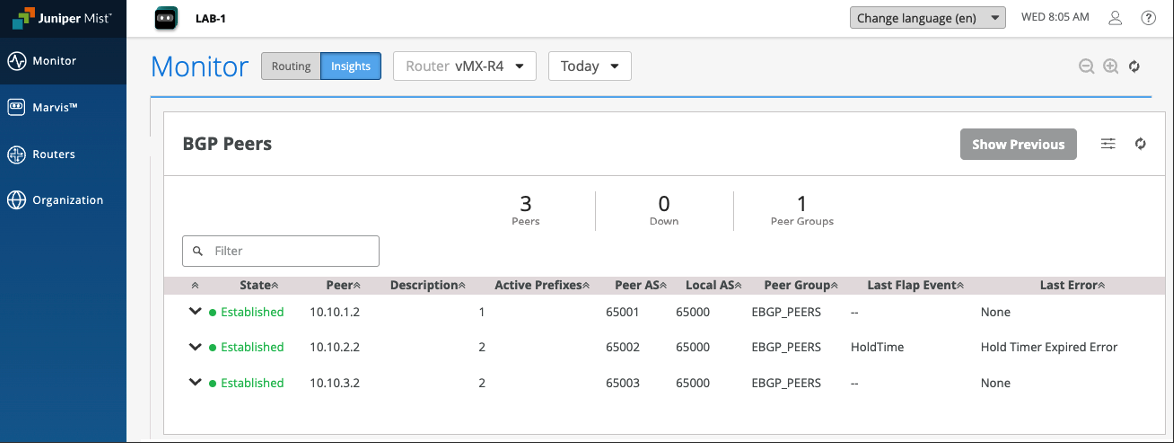
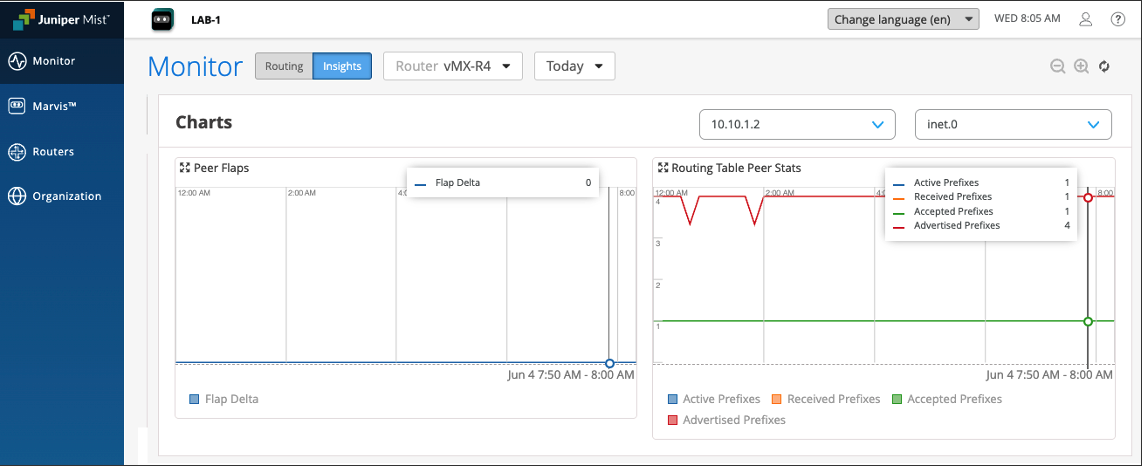
BGP Summary
BGP Peers Summary: BGP Peers widget displays BGP peer information table with details such as BGP peer state, last flap event, last error and so on.
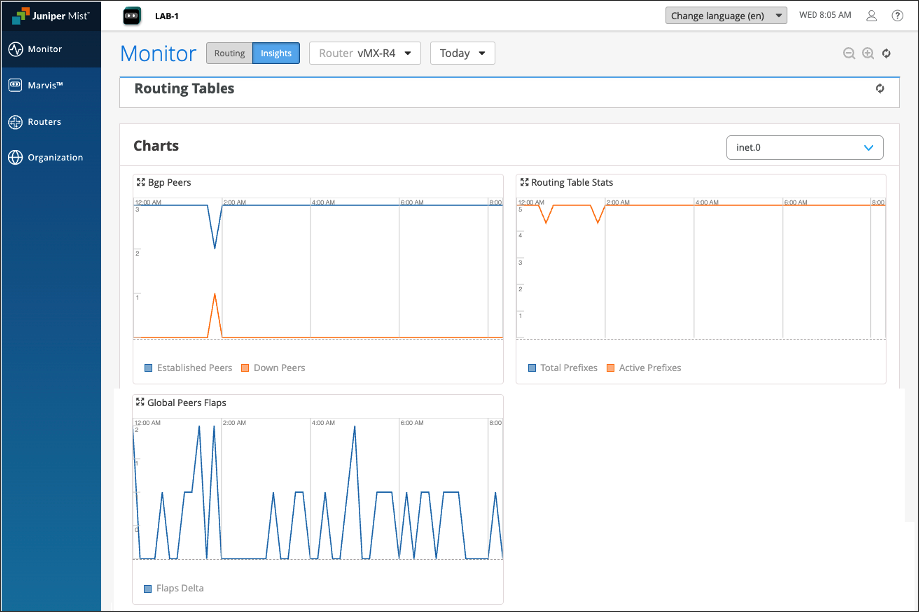
Select a BGP peer from the peer drop-down list.
Then select a routing table from the routing table drop-down list.
The Peer Flaps graph shows the peer flaps delta for a selected BGP peer.
The Routing Table Peer Stats graph shows the routing table’s prefixes (Active, Received, Accepted, Advertised) for the selected peer.
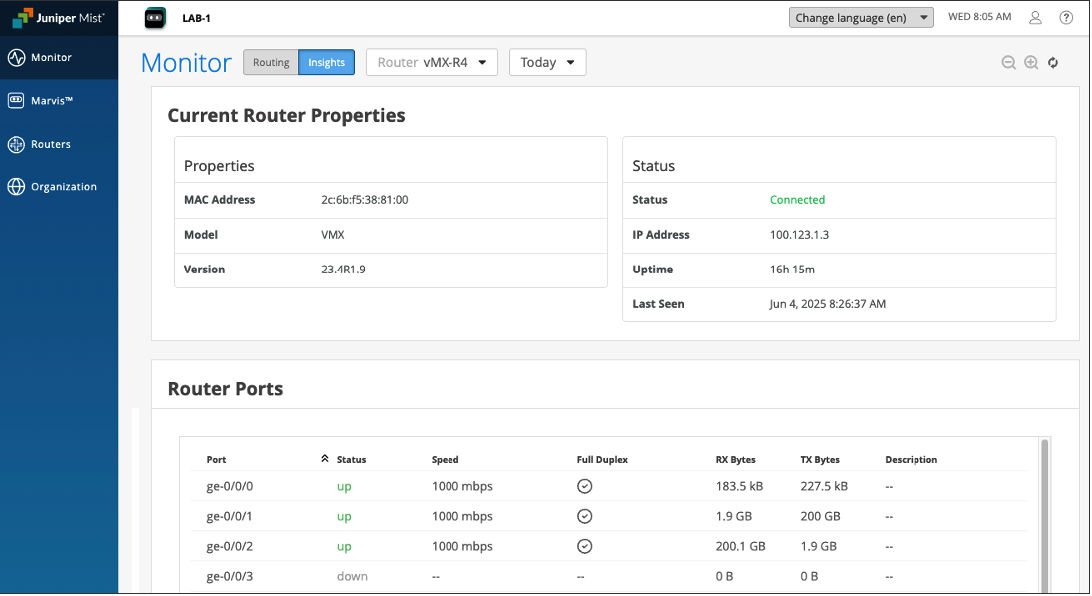
Current Router Properties
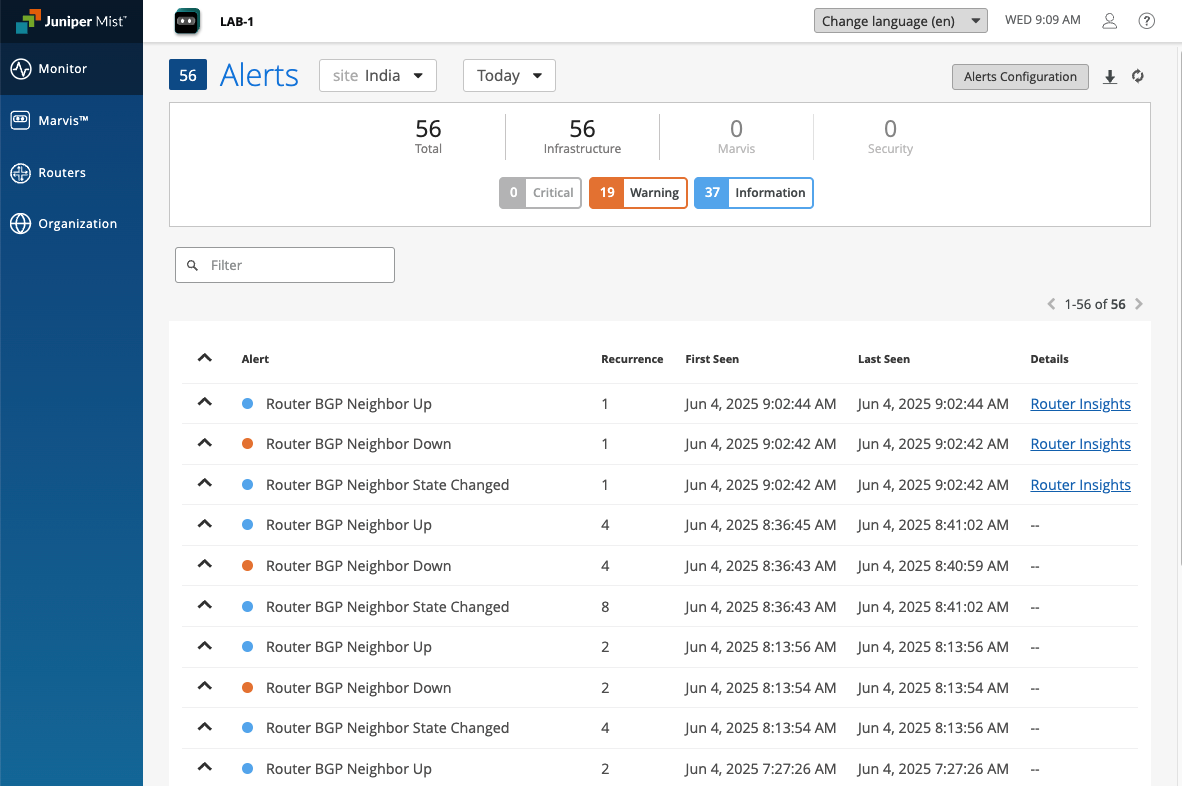
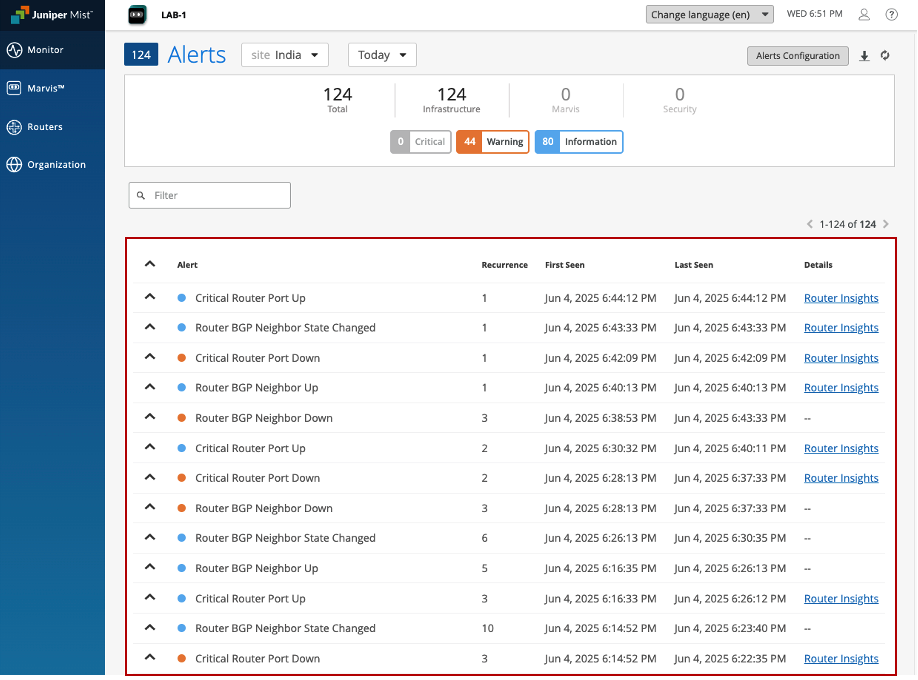
Navigate to Monitor > Alerts
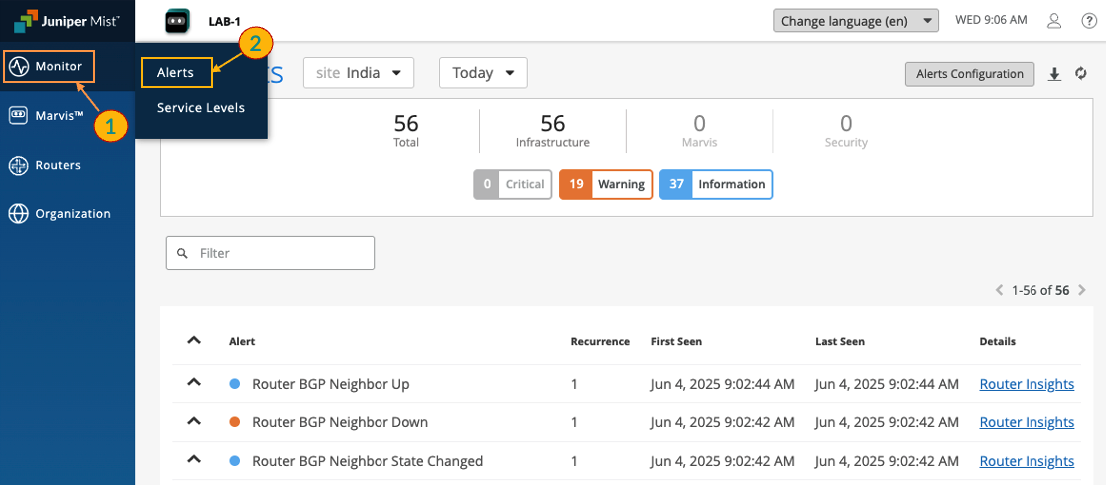
The Alerts page displays the generated alerts and notifies administrators about anomalies in the network.
Service Level Expectations
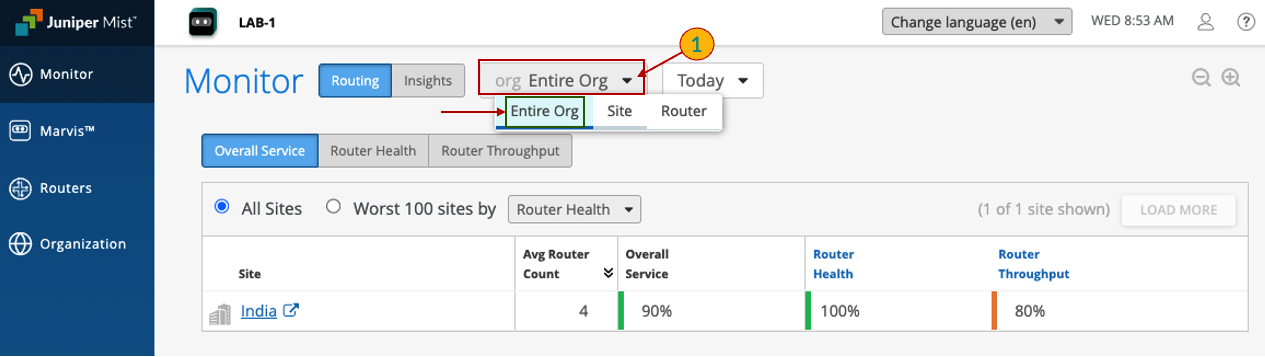
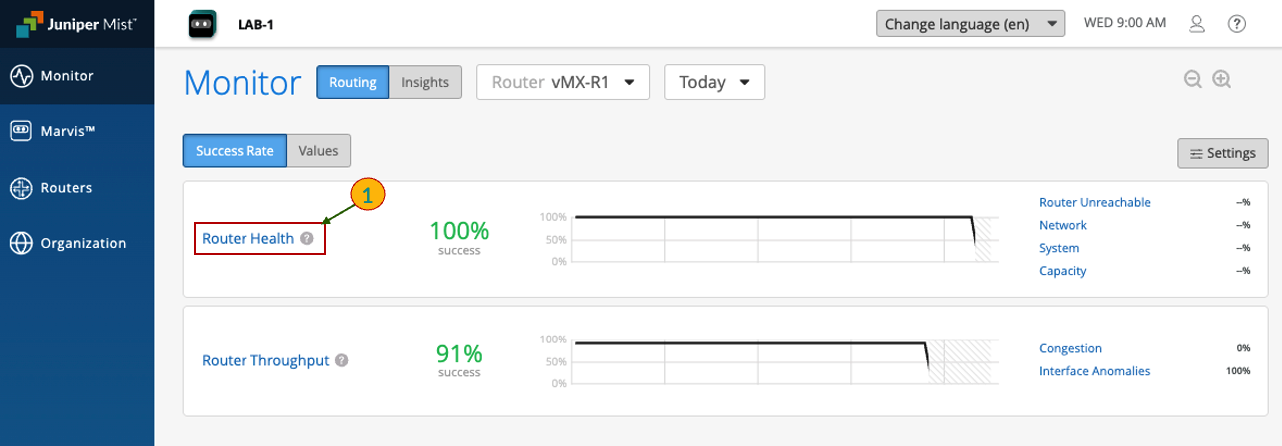
To access the Service Levels Expectations page, go to Monitor > Service Levels > Routing
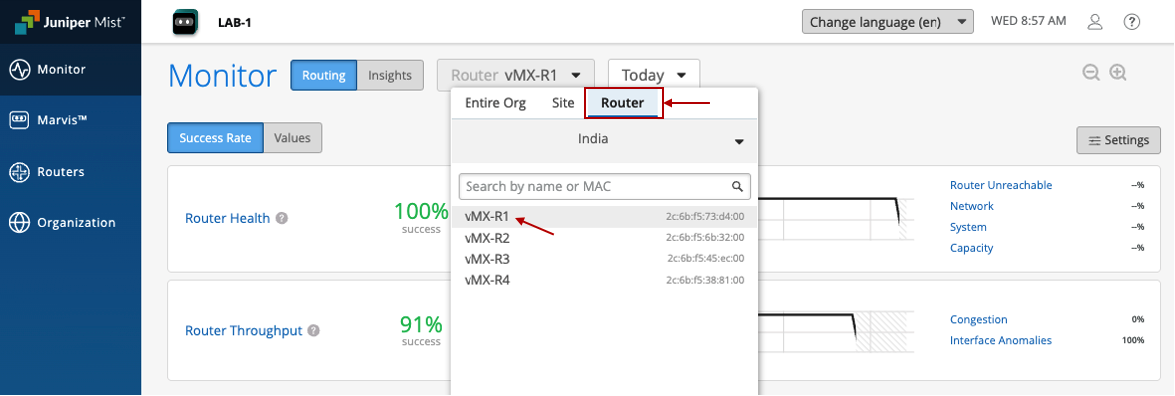
By default, the view shows data for the Entire Org. However, you can filter by a specific Site and even a particular Router to view the Service Level Expectations (SLE) for that specific router within the selected site
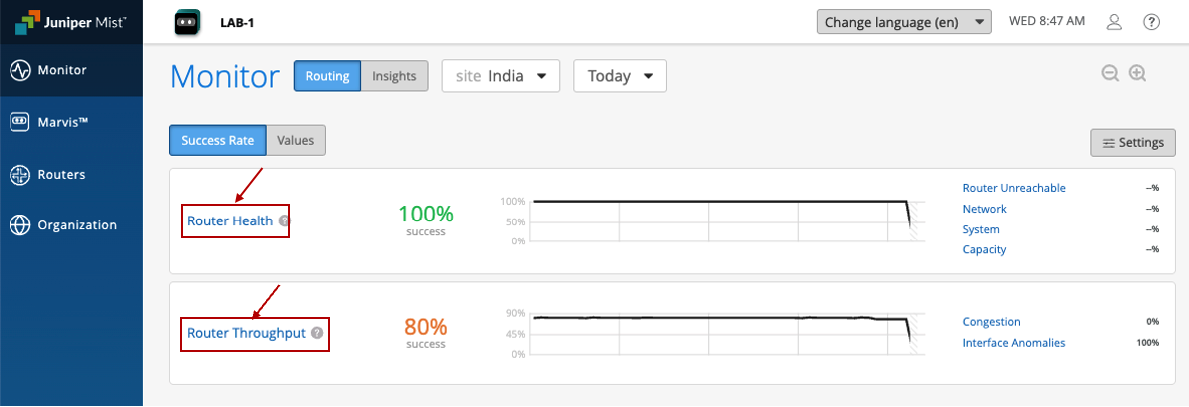
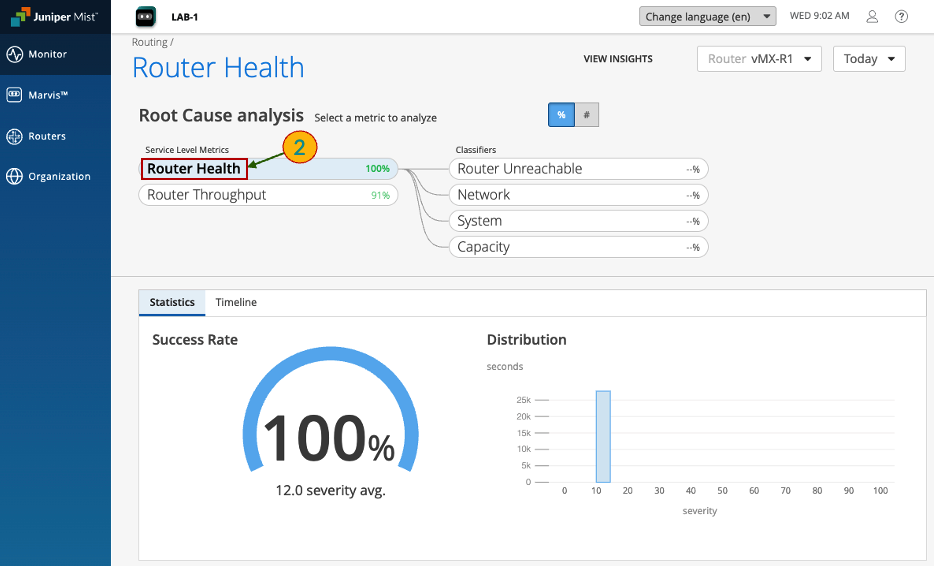
You can analyze the Service Level Matrix for Router Health by clicking on Router Health. This section provides various classifier and sub-classifier options for deeper insight
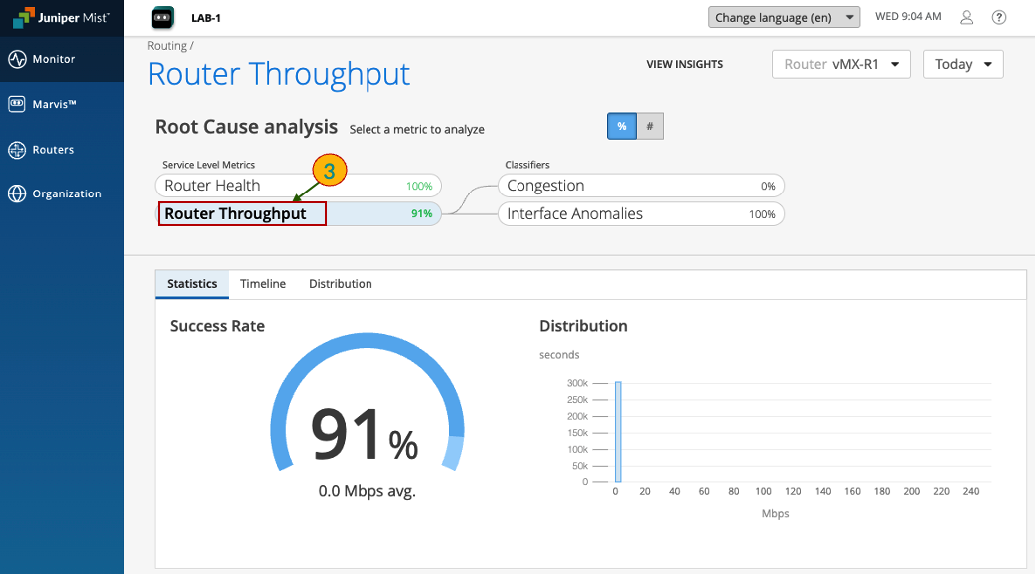
Similarly, you can analyze the Service Level Matrix for Router Throughput by clicking on Router Throughput. This section also provides various classifier and sub-classifier options for detailed throughput analysis
Network Failure Root Cause Analysis
Disable (Shutdown) Core router interface
Open vMX-R4 Remote Shell Utility
Disable (shutdown) interface connected to vMX-R3 router
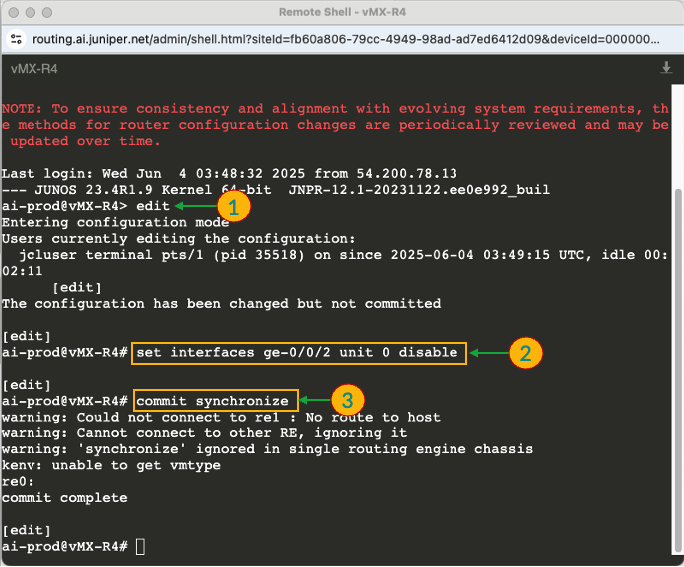
Once the interface is disabled, an alert will be automatically generated—first for the physical port status, followed by a subsequent alert for the BGP neighborship loss. Additionally, a notification will be sent to the email address specified during the alert configuration process, ensuring prompt awareness and response to the event.
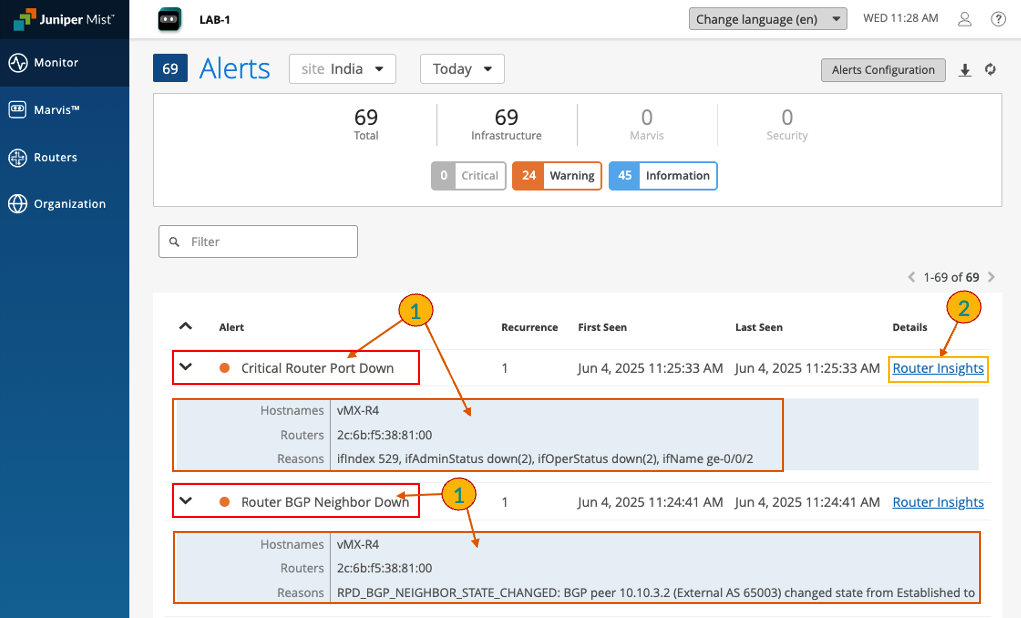
Check Alerts
Click on Router Insights to understand the root cause of the Alert
Select the Event and then click on View Details to know more details
The pop-up window indicates that the interface was disabled, which triggered the corresponding Alert.
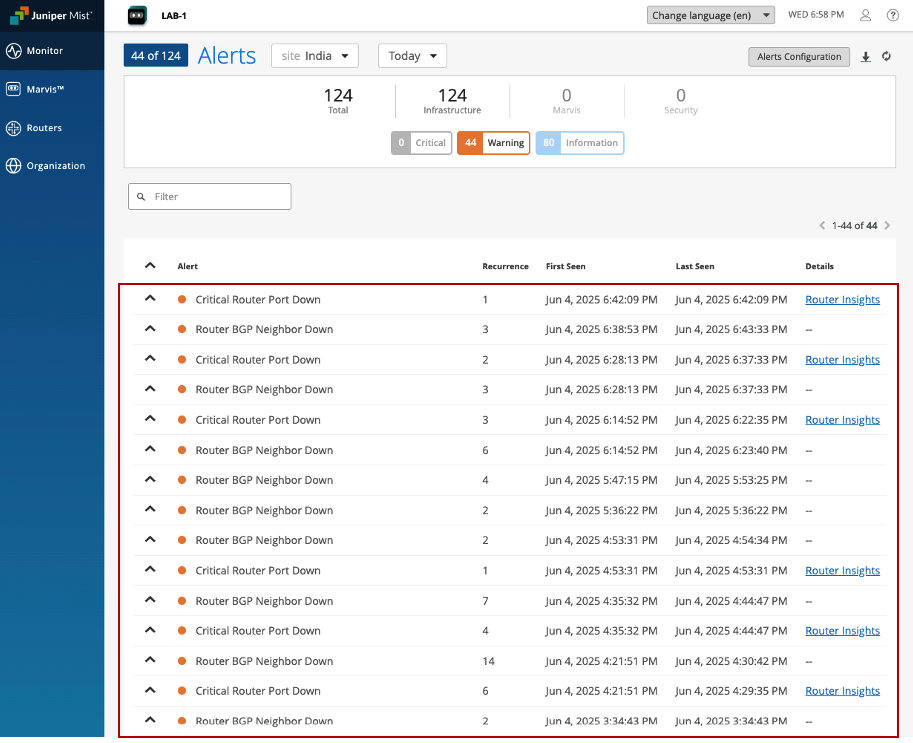
Navigate to the Alerts section, where you’ll observe that the interface has gone down multiple times, resulting in repeated BGP neighborship flaps.
The network admin should collect interface logs and event history from the JRA platform and share them with the Service Provider for troubleshooting and resolution.
Compliance Assessment and Audit Readiness
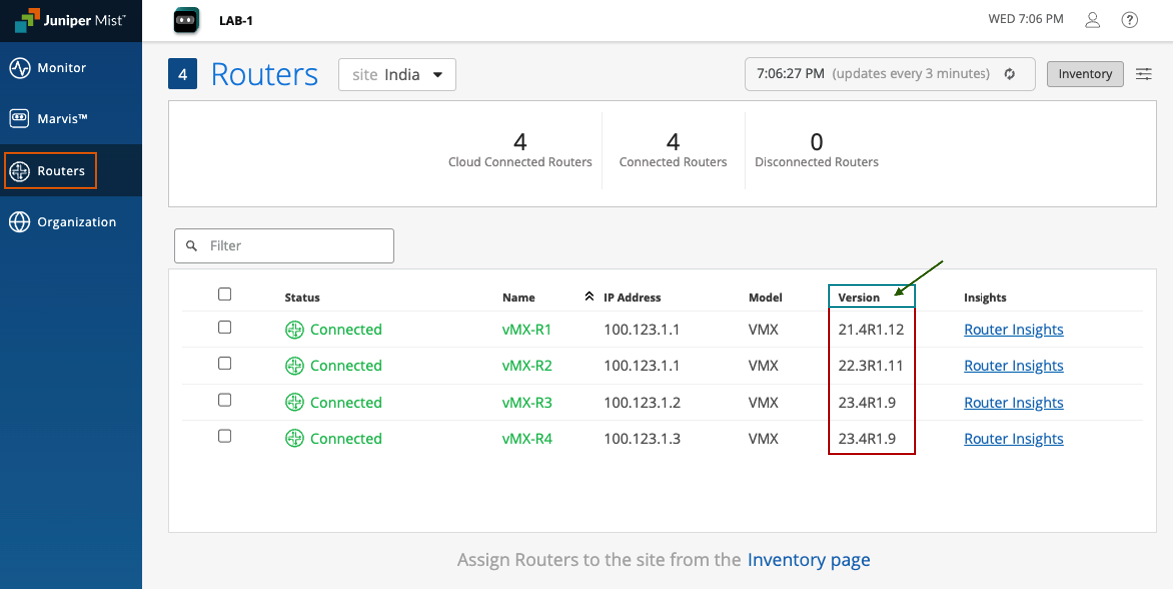
Go to Routers section: the page will show all the Routers, their Name, IP Address, Model, Version
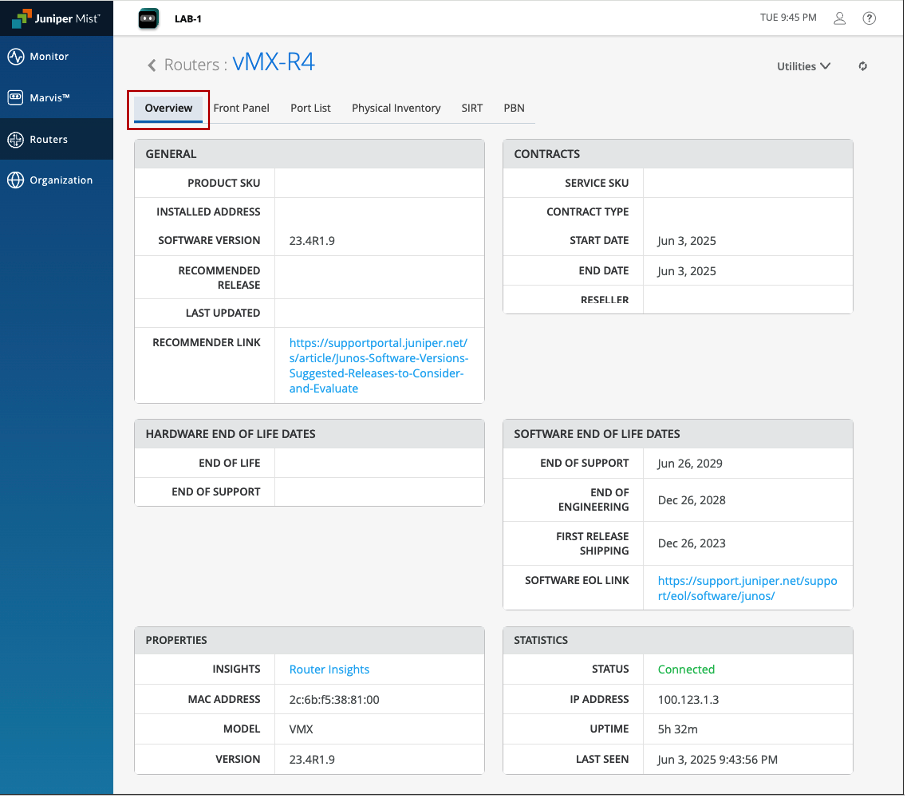
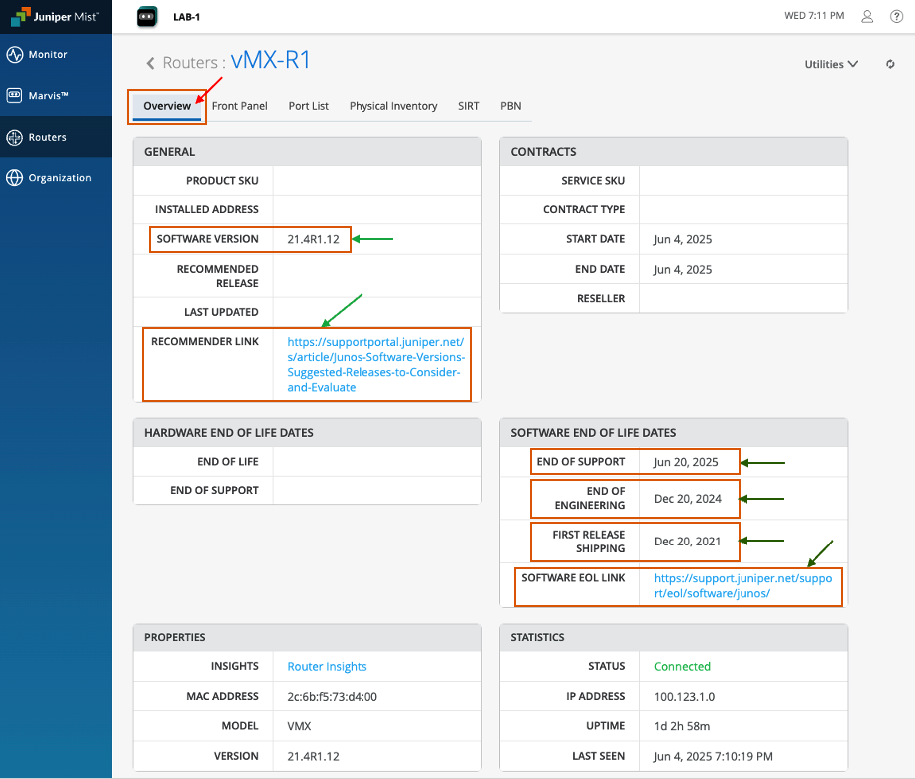
Next go to Overview section: this page will show various details like.
Software Version - installed image release
Recommender Link - suggested releases
EOS date - end of support date
EOL link - OS dates & milestones
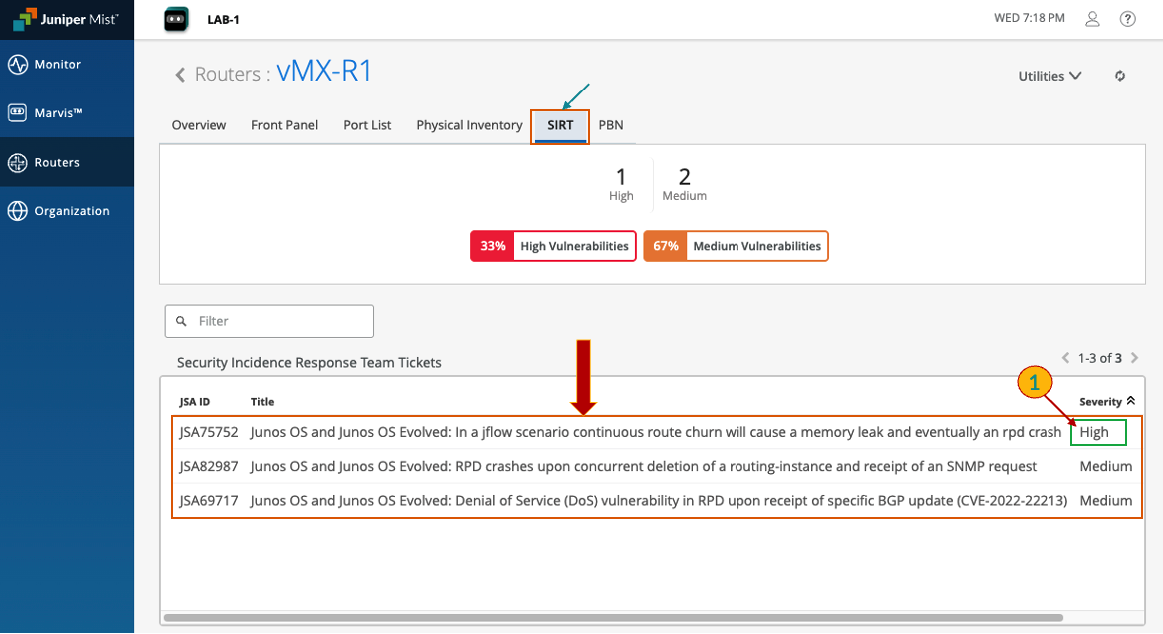
Next go to SIRT section: this page will show all SIRT tickets for the router and OS
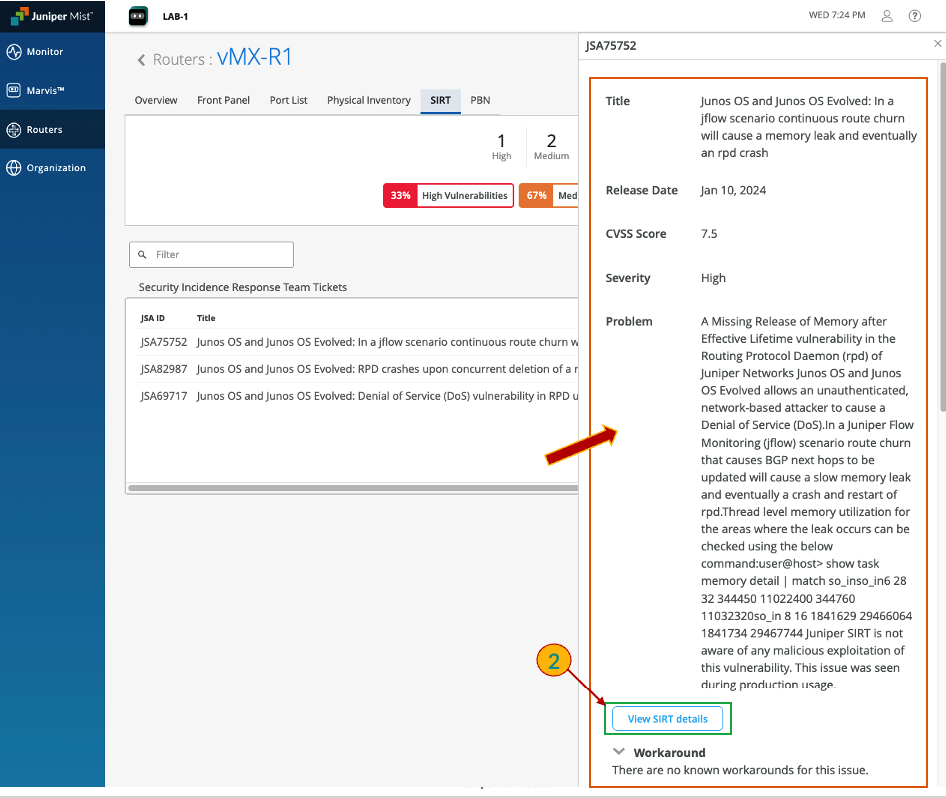
Click on any of the SIRT to get its details
A side pop-up will appear displaying the SIRT (Service Incident Response Ticket) details, along with a link to view more information about the SIRT ticket
Next go to PBN section: this page will show all the Bugs for this router and OS
Click on any of the bug to get more details
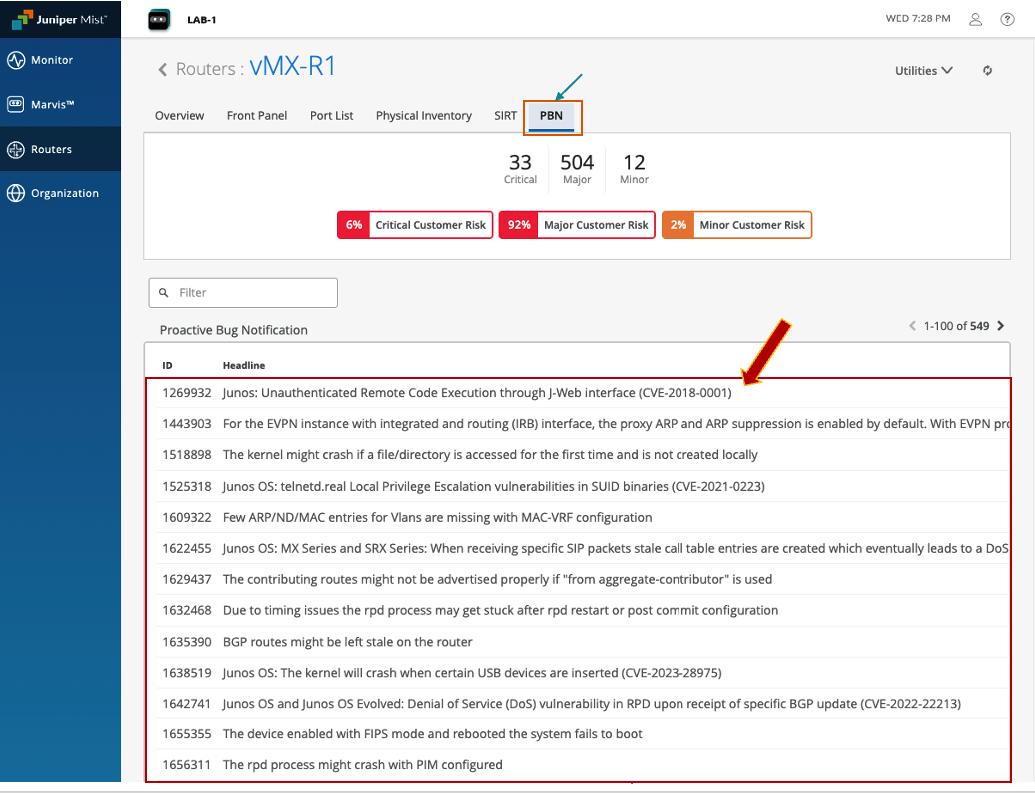
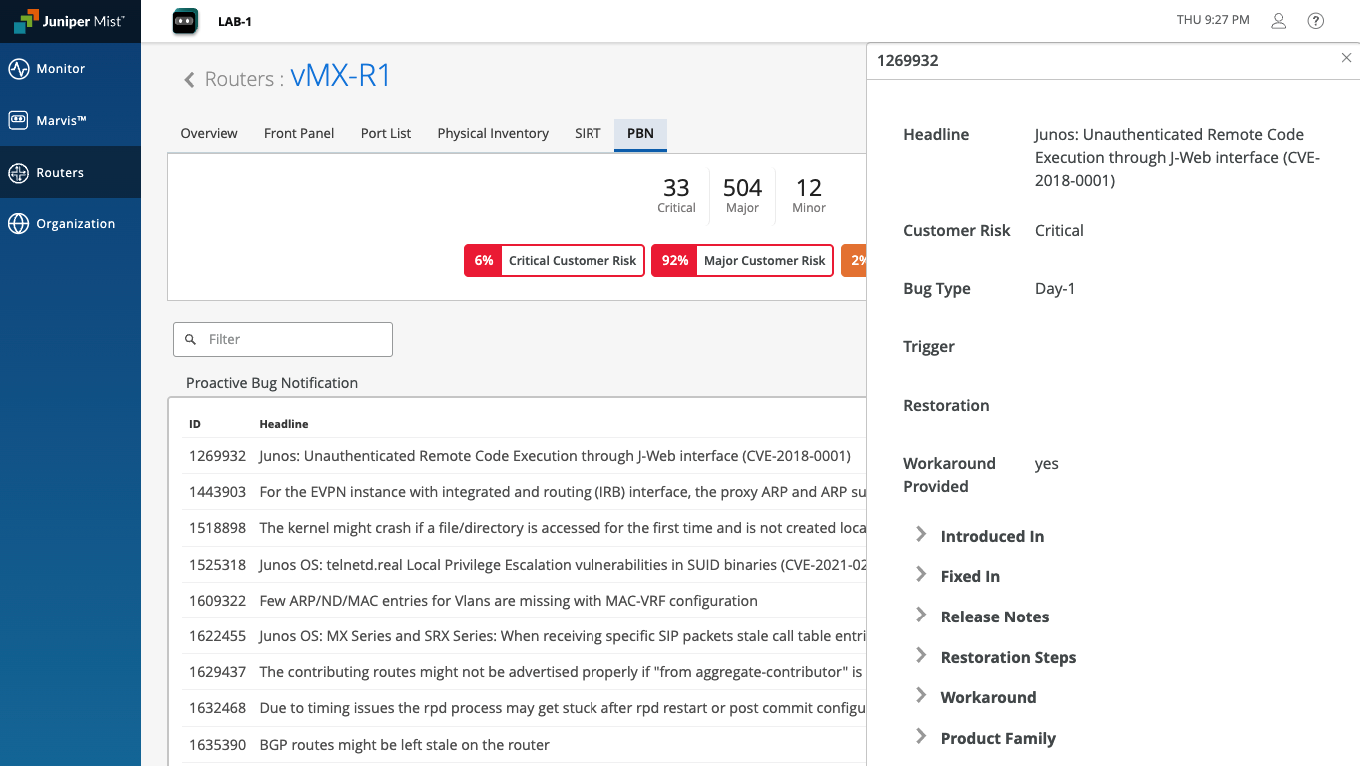
Network admins can easily view compliance info like software versions, EOL/EOS status, and vulnerability alerts. This consolidated view simplifies audits, reduces manual work, and helps quickly generate accurate compliance reports for internal and regulatory needs.
You have successfully completed this Hands-On Lab!
Feel free to explore more about Juniper Routing Assurance at following link: https://www.juniper.net/us/en/products/cloud-services/routing-assurance.html
Lab Survey
Please take 2 minutes and complet the Routing Assurance Hands-On Lab Survey